| Param | Original file | Final file |
|---|---|---|
| Filename | modeM0/AS1A13_074T03_9000005976_44239cztM0_level2.fits | modeM0/AS1A13_074T03_9000005976_44239cztM0_level2_quad_clean.evt |
| Size (bytes) | 507,389,760 | 110,790,720 |
| Size | 483.9 MB | 105.7 MB |
| Events in quadrant A | 6,509,619 | 724,504 |
| Events in quadrant B | 3,486,865 | 766,050 |
| Events in quadrant C | 3,355,695 | 737,728 |
| Events in quadrant D | 4,900,576 | 651,486 |
| Mode M0 | |||
|---|---|---|---|
| Quadrant | BADHDUFLAG | Total packets | Discarded packets |
| A | 0 | 24209 | 2 |
| B | 0 | 14804 | 2 |
| C | 0 | 14833 | 2 |
| D | 0 | 19253 | 2 |
| Mode SS | |||
|---|---|---|---|
| Quadrant | BADHDUFLAG | Total packets | Discarded packets |
| A | 0 | 140 | 0 |
| B | 0 | 140 | 0 |
| C | 0 | 140 | 0 |
| D | 0 | 140 | 0 |
| Mode M9 | |||
|---|---|---|---|
| Quadrant | BADHDUFLAG | Total packets | Discarded packets |
| A | 0 | 19 | 0 |
| B | 0 | 19 | 0 |
| C | 0 | 19 | 0 |
| D | 0 | 19 | 0 |
| Quadrant | Total seconds | Saturated seconds | Saturation percentage |
|---|---|---|---|
| A | 6816 | 412 | 6.044601% |
| B | 6817 | 203 | 2.977849% |
| C | 6817 | 165 | 2.420420% |
| D | 6817 | 507 | 7.437289% |
Noise dominated data is calculated using 1-second bins in cleaned event files. If a bin has >2000 counts, and if more than 50% of those come from <1% of pixels, then it is considered to be noise-dominated and hence unusable.
| Quadrant | # 1 sec bins | Bins with >0 counts | Bins with >2000 counts | High rate bins dominated by noise | Noise dominated (total time) | Noise dominated (detector-on time) | Marked lightcurve |
|---|---|---|---|---|---|---|---|
| A | 8641 | 6817 | 95 | 95 | 1.10% | 1.39% | 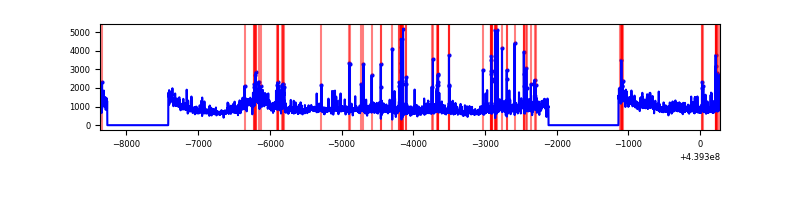 |
| B | 8642 | 6818 | 20 | 20 | 0.23% | 0.29% | 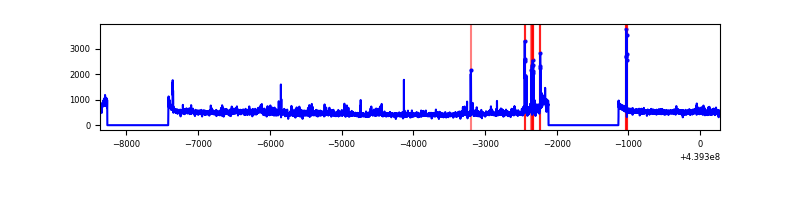 |
| C | 8642 | 6818 | 31 | 31 | 0.36% | 0.45% | 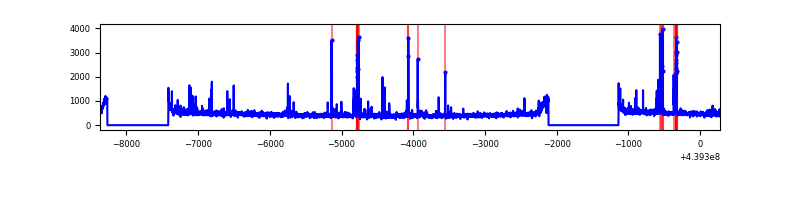 |
| D | 8642 | 6819 | 340 | 340 | 3.93% | 4.99% | 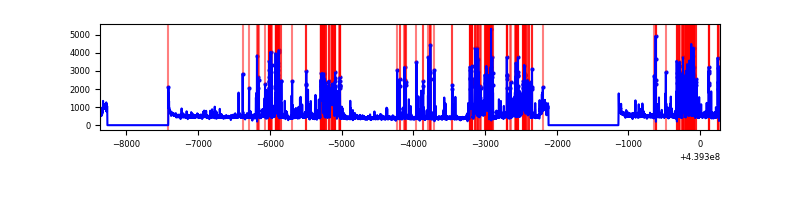 |
Top three noisy pixels from each quadrant. If the there are fewer than three noisy pixels in the level2.evt file, extra rows are filled as -1
| Pixel properties | Quadrant properties | ||||||
|---|---|---|---|---|---|---|---|
| Quadrant | DetID | PixID | Counts | Sigma | Mean | Median | Sigma |
| A | 15 | 223 | 1885178 | 11651.91 | 784 | 766 | 161.7 |
| A | 10 | 83 | 1479264 | 9142.02 | 784 | 766 | 161.7 |
| A | 7 | 3 | 53061 | 323.36 | 784 | 766 | 161.7 |
| B | 4 | 158 | 89818 | 575.74 | 789 | 765 | 154.7 |
| B | 0 | 155 | 76316 | 488.45 | 789 | 765 | 154.7 |
| B | 0 | 213 | 53495 | 340.91 | 789 | 765 | 154.7 |
| C | 14 | 254 | 225413 | 1208.88 | 784 | 790 | 185.8 |
| C | 3 | 233 | 25605 | 133.55 | 784 | 790 | 185.8 |
| C | 4 | 254 | 24116 | 125.54 | 784 | 790 | 185.8 |
| D | 13 | 249 | 934461 | 4841.91 | 768 | 745 | 192.8 |
| D | 1 | 52 | 847372 | 4390.3 | 768 | 745 | 192.8 |
| D | 2 | 249 | 50349 | 257.23 | 768 | 745 | 192.8 |
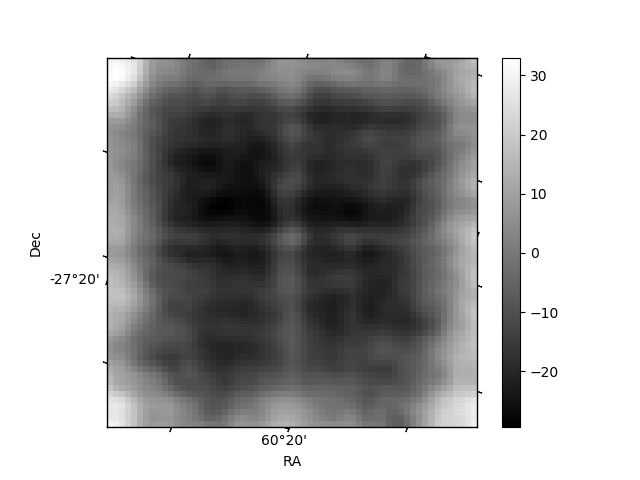
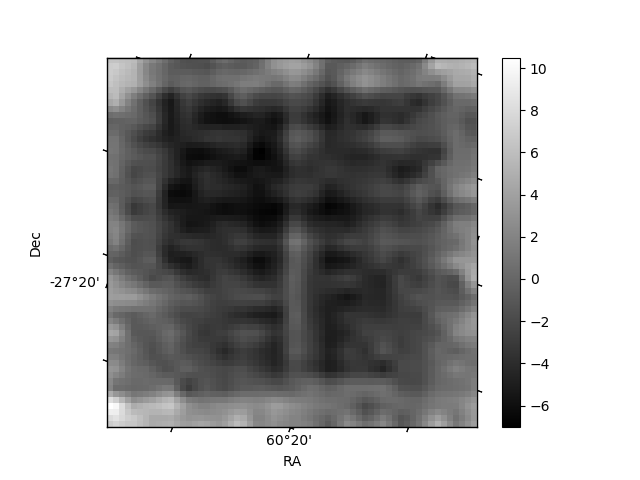
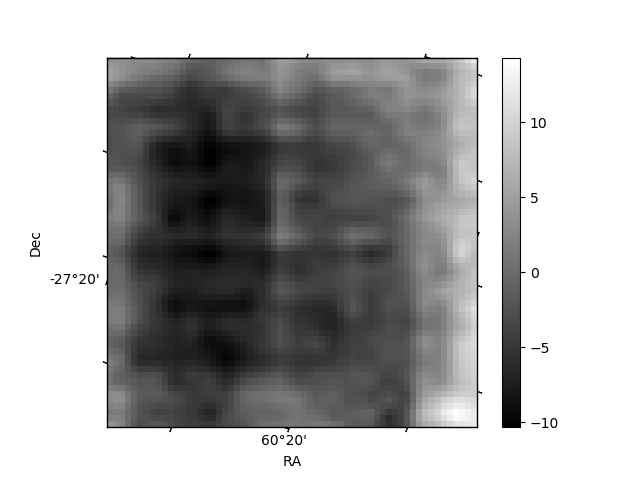
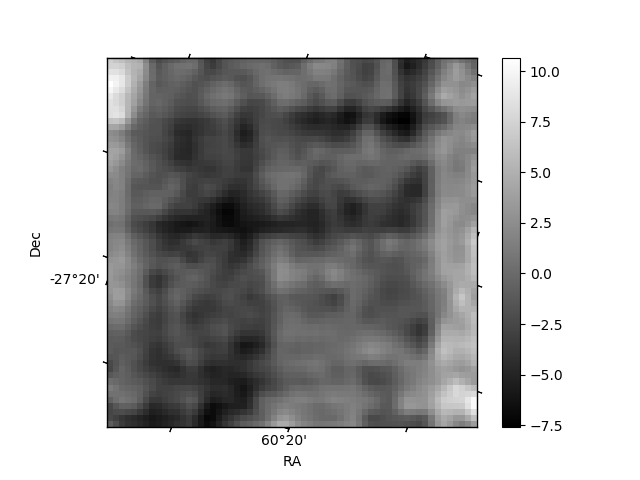
Histogram calculated using DETX and DETY for each event in the final _common_clean file
| Quadrant A | 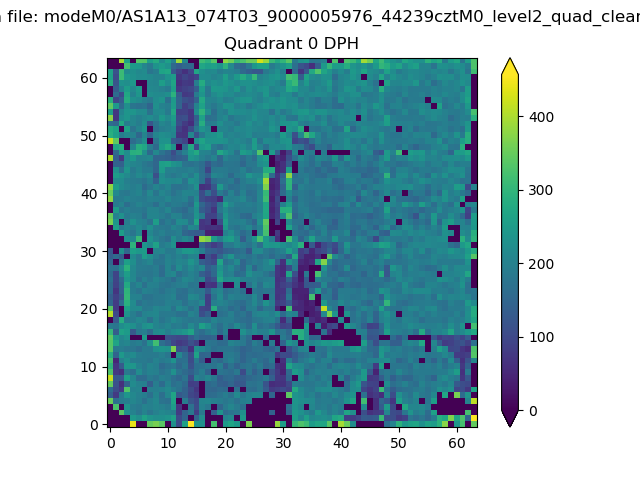 |
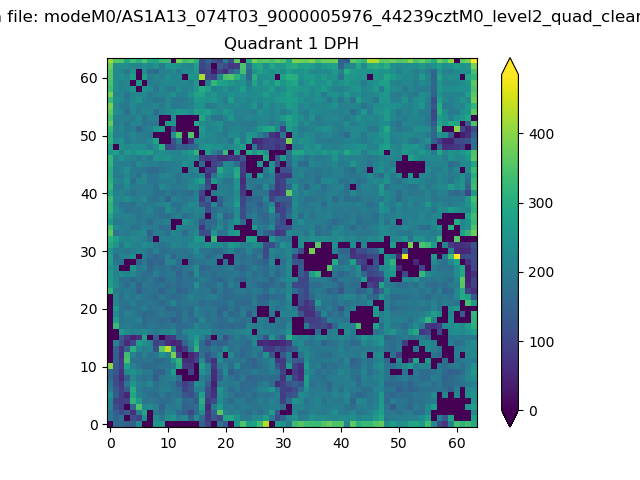 |
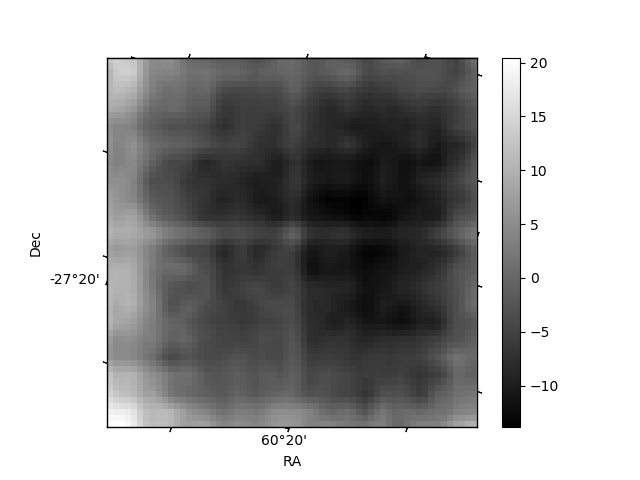
Quadrant B |
|---|---|---|---|
| Quadrant D | 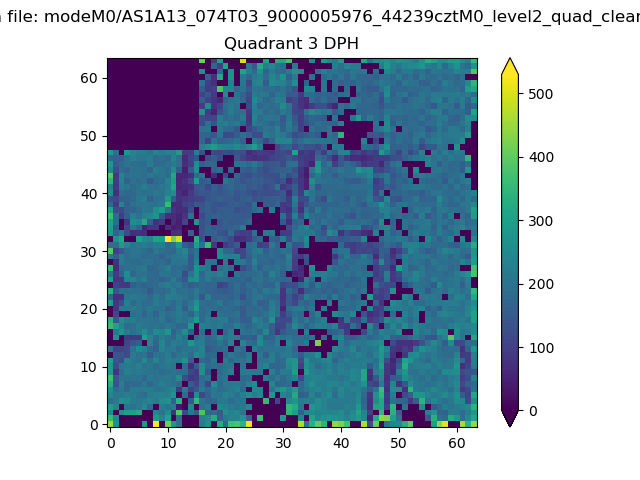 |
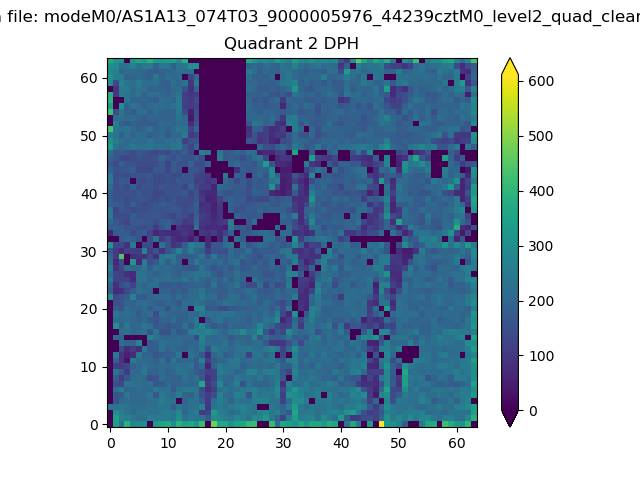 |
Quadrant C |
| Plot type | Count rate plots | Images |
|---|---|---|
| Comparison with Poisson distribution Blue bars denote a histogram of data divided into 1 sec bins. Red curve is a Poisson curve with rate = median count rate of data. |
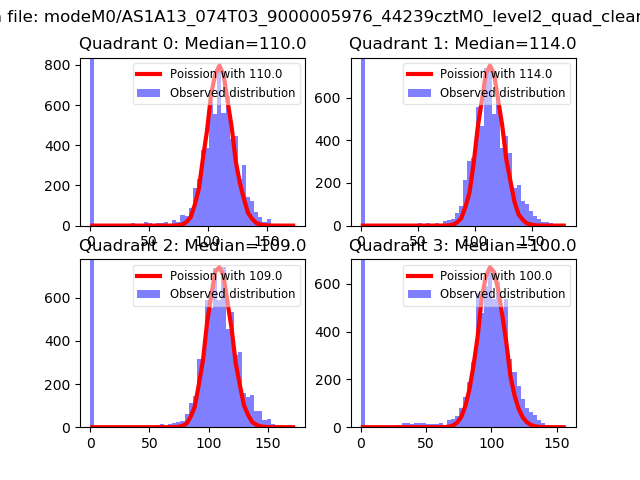 |
 |
| Quadrant-wise count rates Data is divided into 100 sec bins |
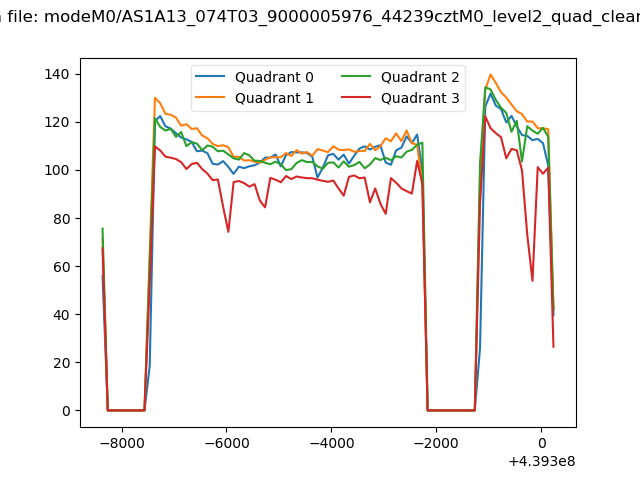 |
|
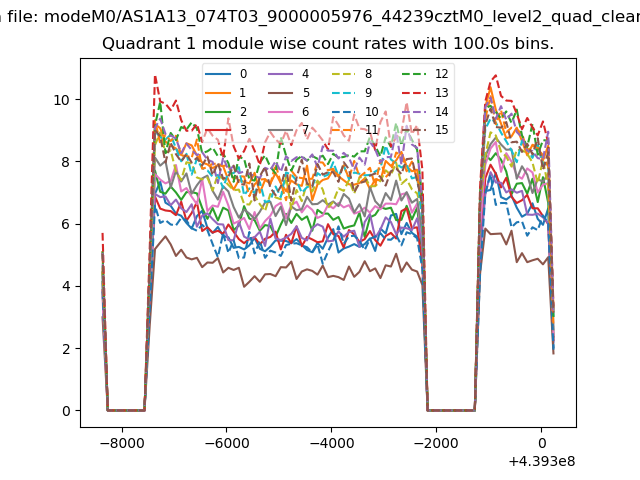
| Module-wise count rates for Quadrant A Data is divided into 100 sec bins |
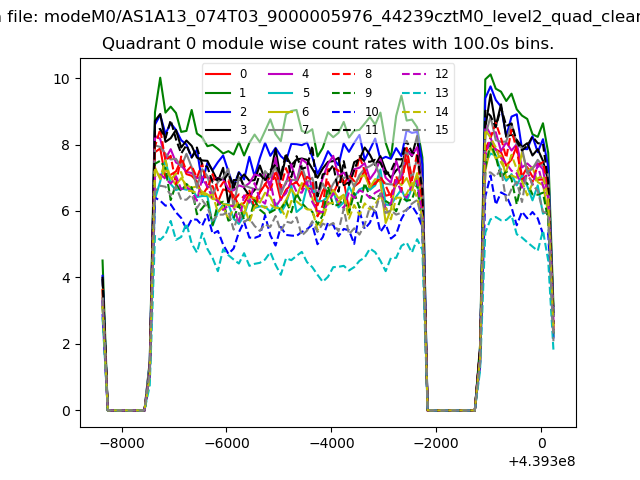 |
 |
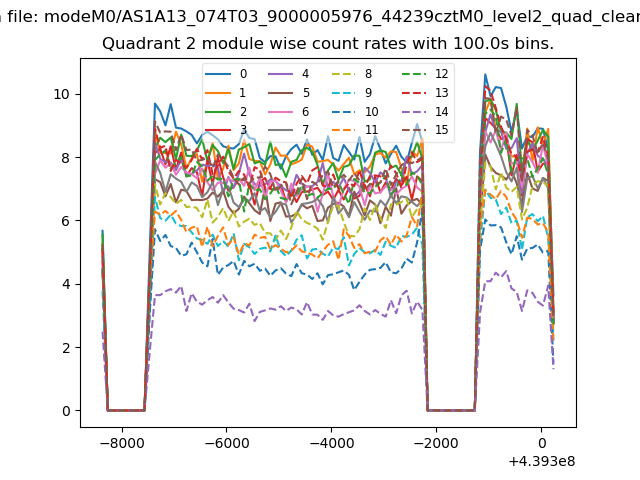
| Module-wise count rates for Quadrant B Data is divided into 100 sec bins |
 |
 |
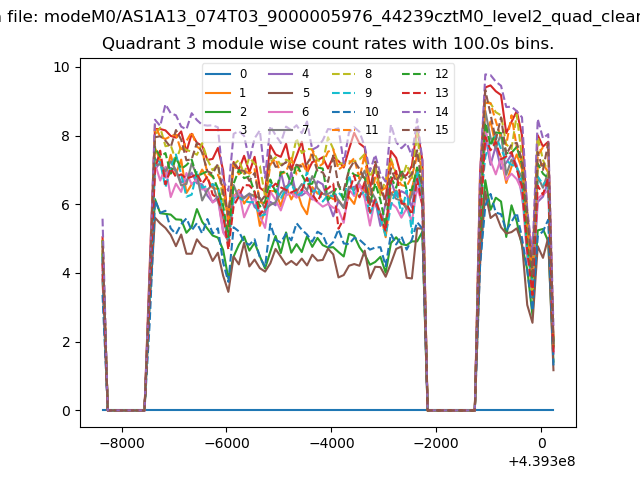
| Module-wise count rates for Quadrant C Data is divided into 100 sec bins |
 |
 |
| Module-wise count rates for Quadrant D Data is divided into 100 sec bins |
 |
 |
| Parameter | Plot |
|---|---|
| CZT HV Monitor | 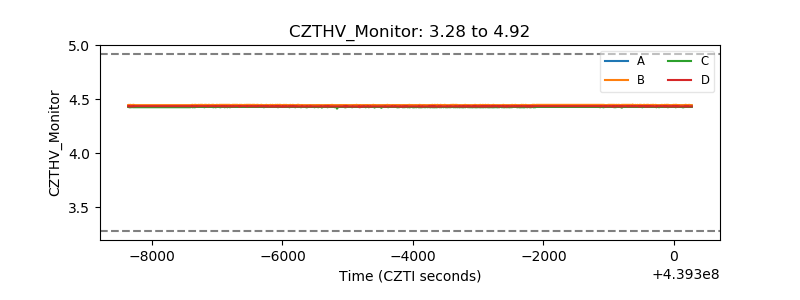 |
| D_VDD | 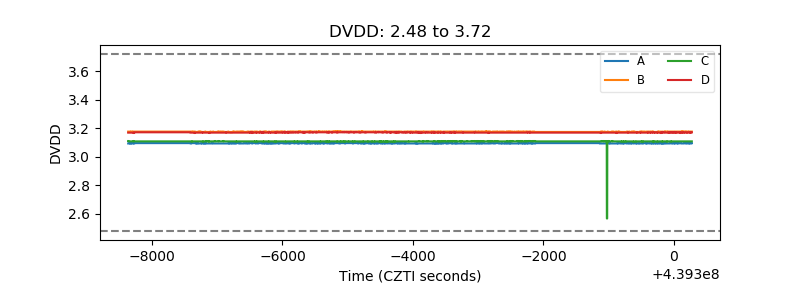 |
| Temperature 1 | 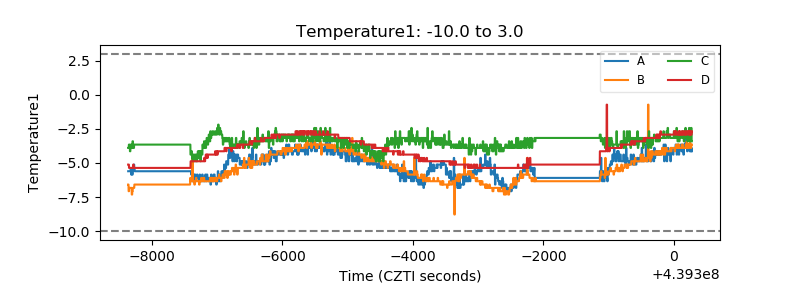 |
| Veto HV Monitor | 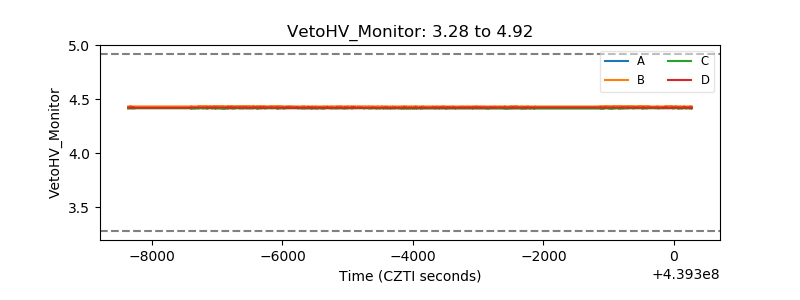 |
| Veto LLD | 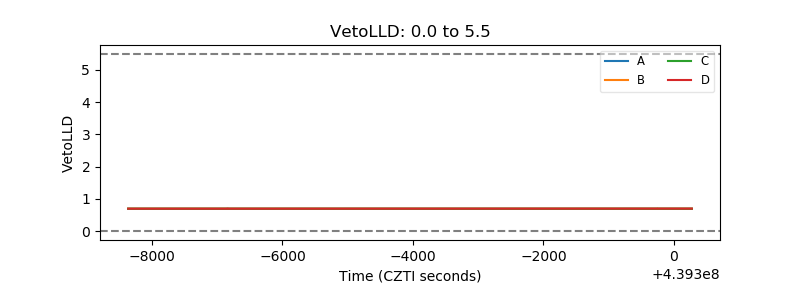 |
| Alpha Counter |  |
| _CPM_Rate | 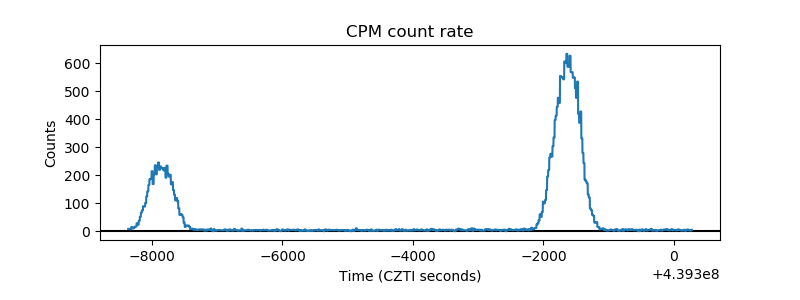 |
| CZT Counter | 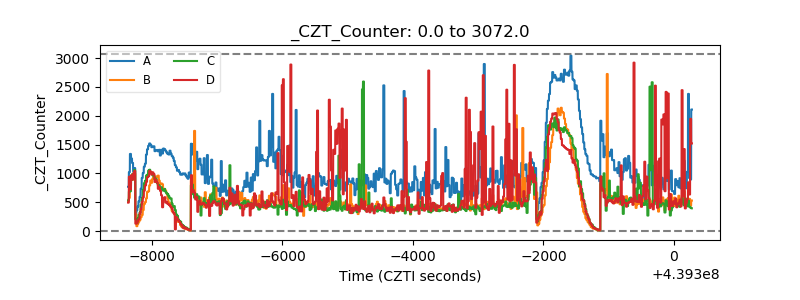 |
| +2.5 Volts monitor | 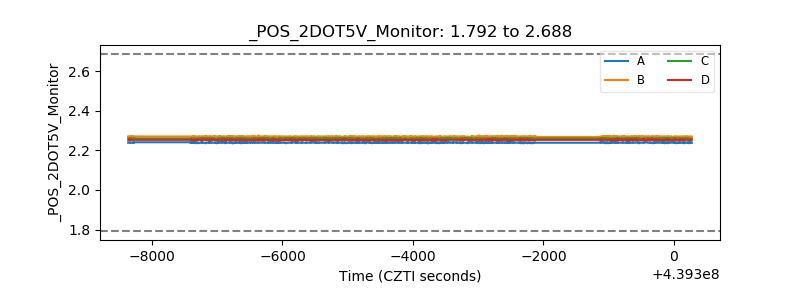 |
| +5 Volts monitor | 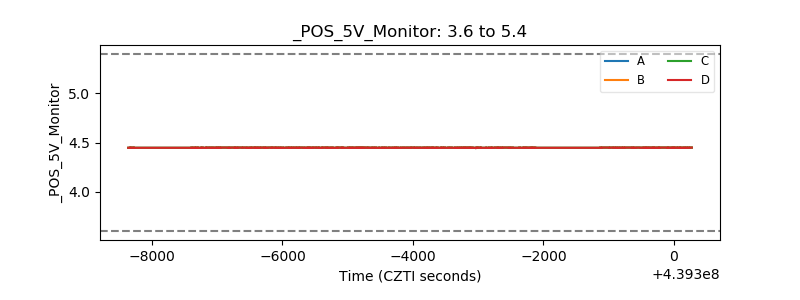 |
| _ROLL_ROT | 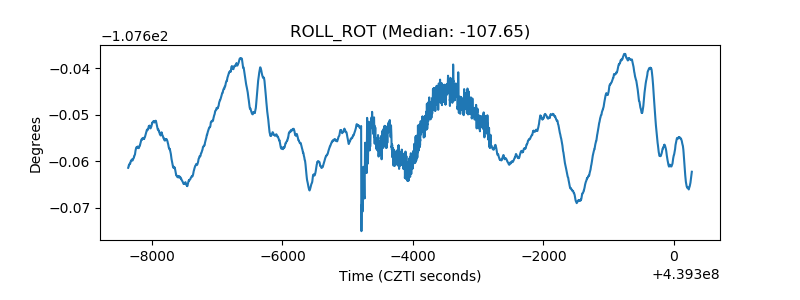 |
| _Roll_DEC | 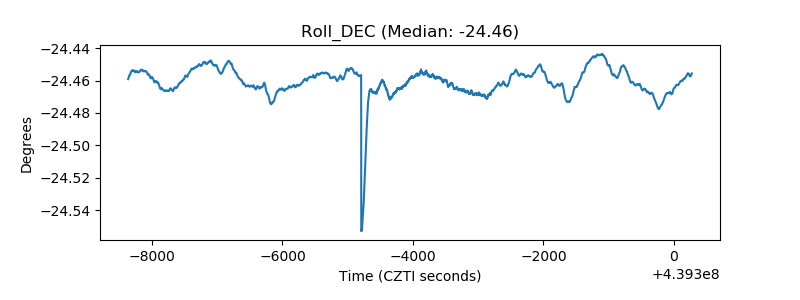 |
| _Roll_RA | 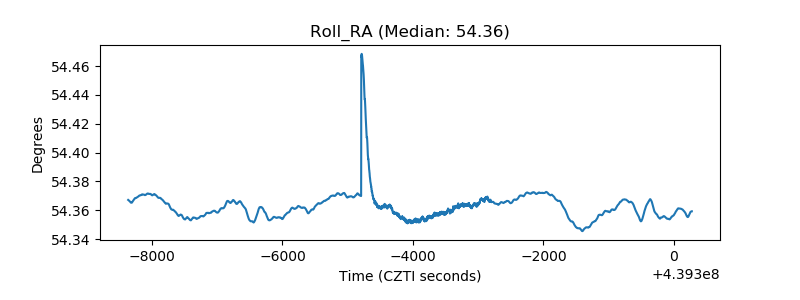 |
| Veto Counter | 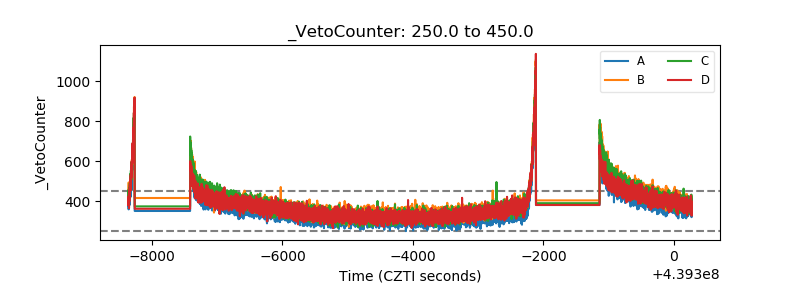 |