| Param | Original file | Final file |
|---|---|---|
| Filename | modeM0/AS1A13_079T01_9000005978_44241cztM0_level2.fits | modeM0/AS1A13_079T01_9000005978_44241cztM0_level2_quad_clean.evt |
| Size (bytes) | 531,334,080 | 122,650,560 |
| Size | 506.7 MB | 117.0 MB |
| Events in quadrant A | 7,253,499 | 791,623 |
| Events in quadrant B | 4,118,165 | 860,947 |
| Events in quadrant C | 3,574,178 | 826,257 |
| Events in quadrant D | 4,174,885 | 743,740 |
| Mode M0 | |||
|---|---|---|---|
| Quadrant | BADHDUFLAG | Total packets | Discarded packets |
| A | 0 | 26820 | 2 |
| B | 0 | 17100 | 2 |
| C | 0 | 15423 | 2 |
| D | 0 | 17319 | 4 |
| Mode SS | |||
|---|---|---|---|
| Quadrant | BADHDUFLAG | Total packets | Discarded packets |
| A | 0 | 146 | 0 |
| B | 0 | 146 | 0 |
| C | 0 | 146 | 0 |
| D | 0 | 146 | 0 |
| Mode M9 | |||
|---|---|---|---|
| Quadrant | BADHDUFLAG | Total packets | Discarded packets |
| A | 0 | 23 | 0 |
| B | 0 | 23 | 0 |
| C | 0 | 23 | 0 |
| D | 0 | 23 | 0 |
| Quadrant | Total seconds | Saturated seconds | Saturation percentage |
|---|---|---|---|
| A | 7053 | 773 | 10.959875% |
| B | 7053 | 298 | 4.225152% |
| C | 7054 | 129 | 1.828750% |
| D | 7053 | 324 | 4.593790% |
Noise dominated data is calculated using 1-second bins in cleaned event files. If a bin has >2000 counts, and if more than 50% of those come from <1% of pixels, then it is considered to be noise-dominated and hence unusable.
| Quadrant | # 1 sec bins | Bins with >0 counts | Bins with >2000 counts | High rate bins dominated by noise | Noise dominated (total time) | Noise dominated (detector-on time) | Marked lightcurve |
|---|---|---|---|---|---|---|---|
| A | 9343 | 7055 | 363 | 363 | 3.89% | 5.15% | 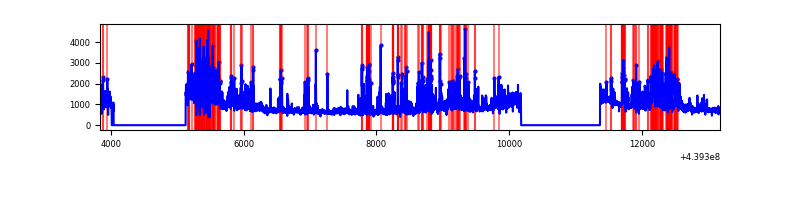 |
| B | 9343 | 7055 | 74 | 74 | 0.79% | 1.05% | 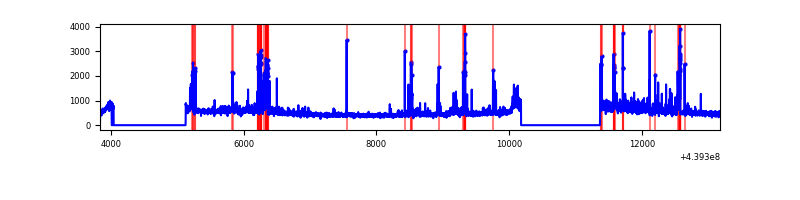 |
| C | 9344 | 7057 | 10 | 10 | 0.11% | 0.14% | 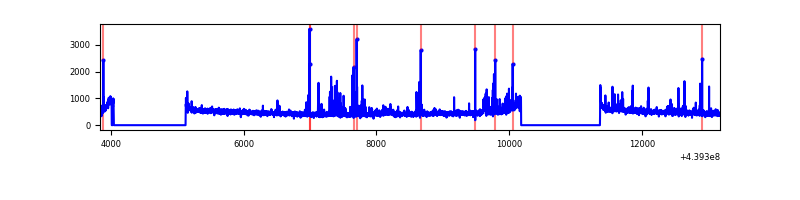 |
| D | 9343 | 7056 | 128 | 128 | 1.37% | 1.81% | 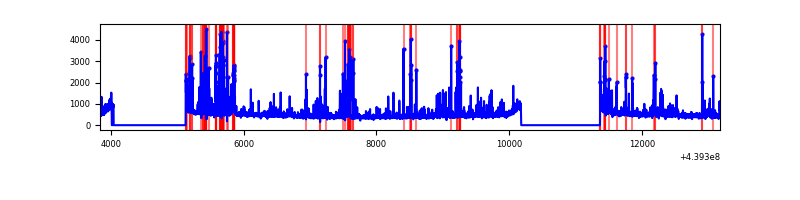 |
Top three noisy pixels from each quadrant. If the there are fewer than three noisy pixels in the level2.evt file, extra rows are filled as -1
| Pixel properties | Quadrant properties | ||||||
|---|---|---|---|---|---|---|---|
| Quadrant | DetID | PixID | Counts | Sigma | Mean | Median | Sigma |
| A | 15 | 223 | 1807746 | 10587.71 | 830 | 815 | 170.7 |
| A | 10 | 83 | 1573784 | 9216.81 | 830 | 815 | 170.7 |
| A | 2 | 79 | 360110 | 2105.29 | 830 | 815 | 170.7 |
| B | 4 | 158 | 266833 | 1616.49 | 842 | 820 | 164.6 |
| B | 5 | 172 | 115837 | 698.93 | 842 | 820 | 164.6 |
| B | 0 | 230 | 104302 | 628.83 | 842 | 820 | 164.6 |
| C | 14 | 254 | 145458 | 741.1 | 827 | 830 | 195.2 |
| C | 14 | 220 | 61721 | 312.02 | 827 | 830 | 195.2 |
| C | 2 | 14 | 53959 | 272.24 | 827 | 830 | 195.2 |
| D | 13 | 249 | 355289 | 1723.79 | 819 | 793 | 205.6 |
| D | 1 | 52 | 260623 | 1263.47 | 819 | 793 | 205.6 |
| D | 5 | 222 | 159040 | 769.5 | 819 | 793 | 205.6 |
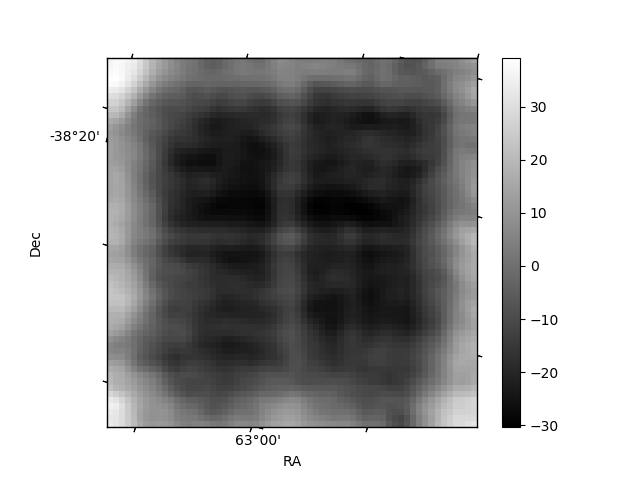
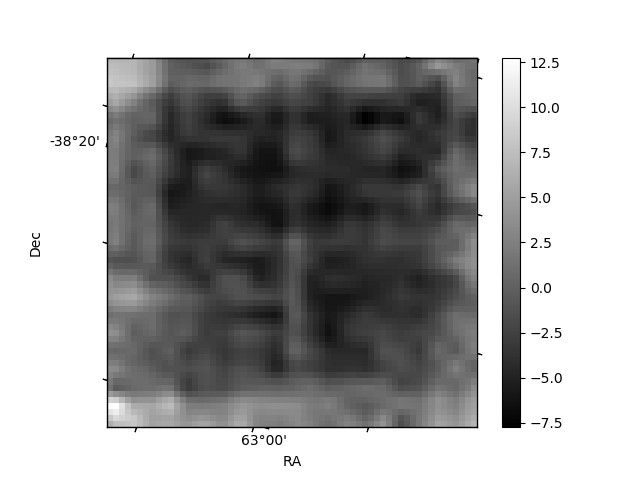
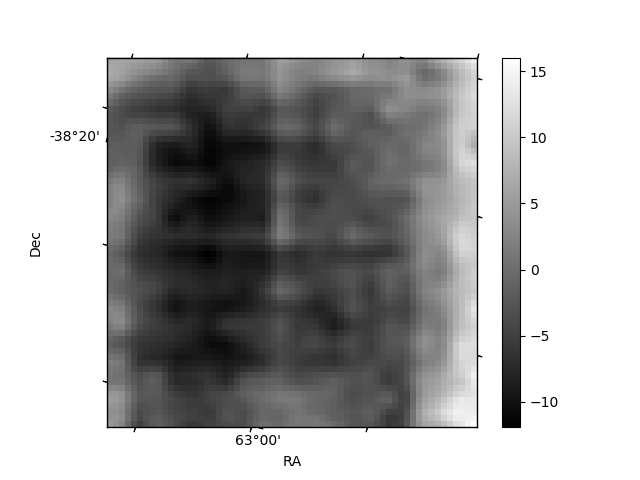
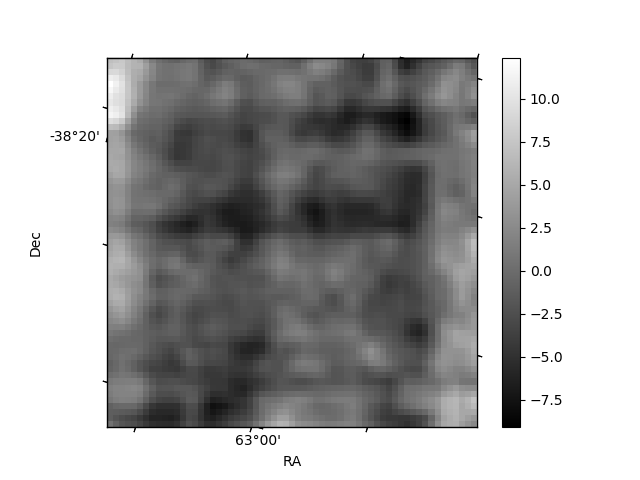
Histogram calculated using DETX and DETY for each event in the final _common_clean file
| Quadrant A | 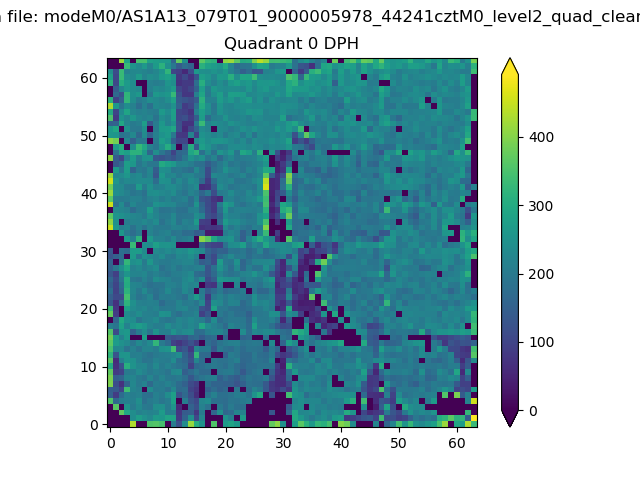 |
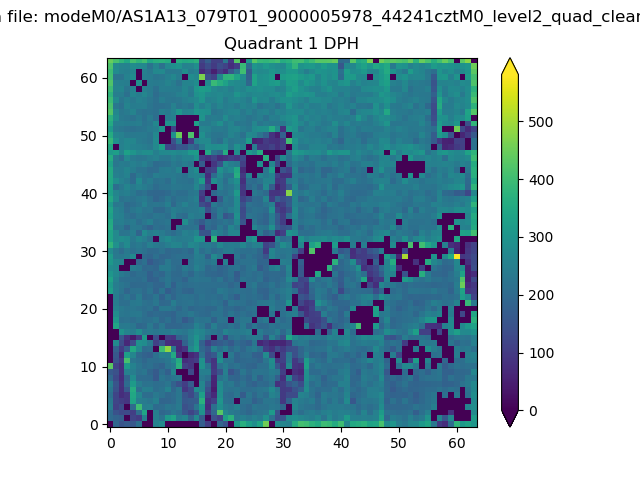 |
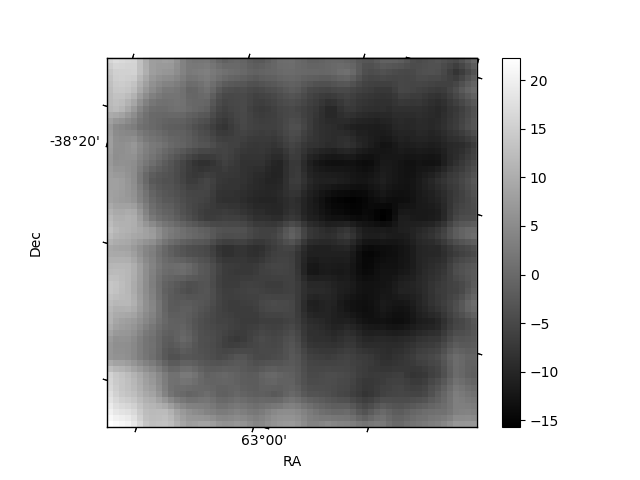
Quadrant B |
|---|---|---|---|
| Quadrant D | 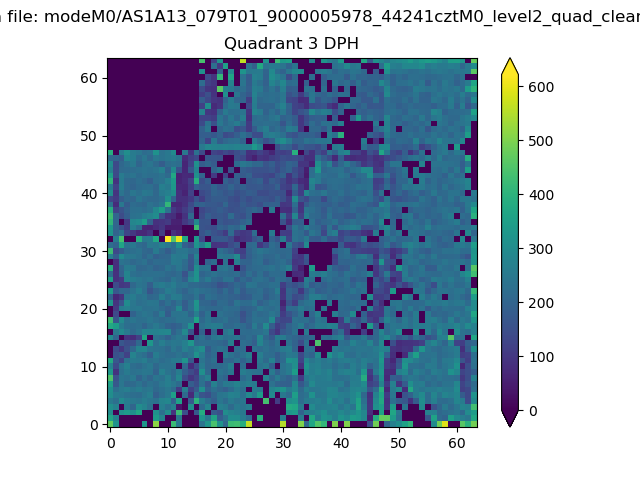 |
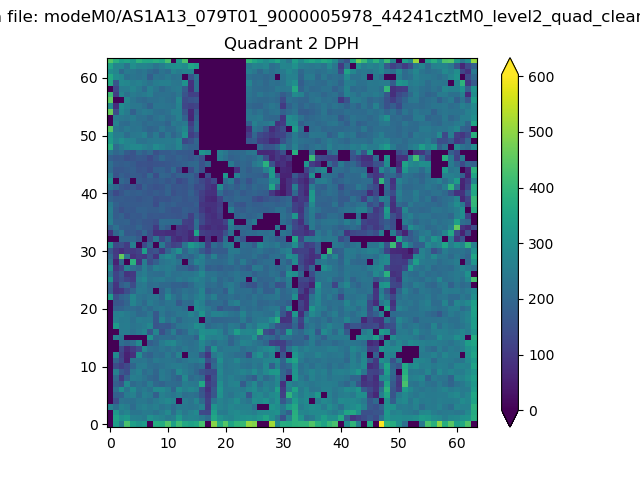 |
Quadrant C |
| Plot type | Count rate plots | Images |
|---|---|---|
| Comparison with Poisson distribution Blue bars denote a histogram of data divided into 1 sec bins. Red curve is a Poisson curve with rate = median count rate of data. |
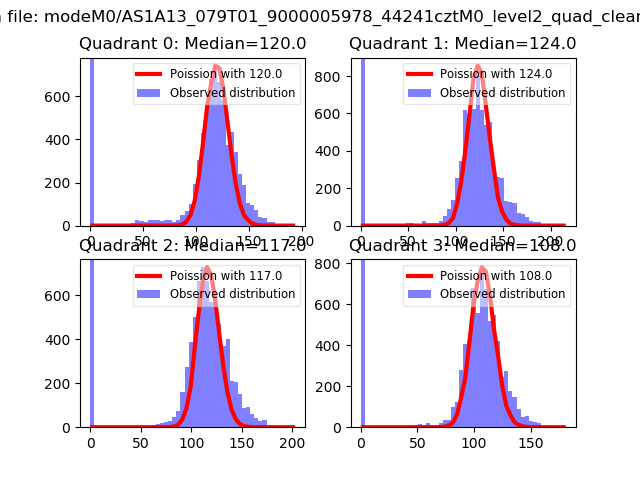 |
 |
| Quadrant-wise count rates Data is divided into 100 sec bins |
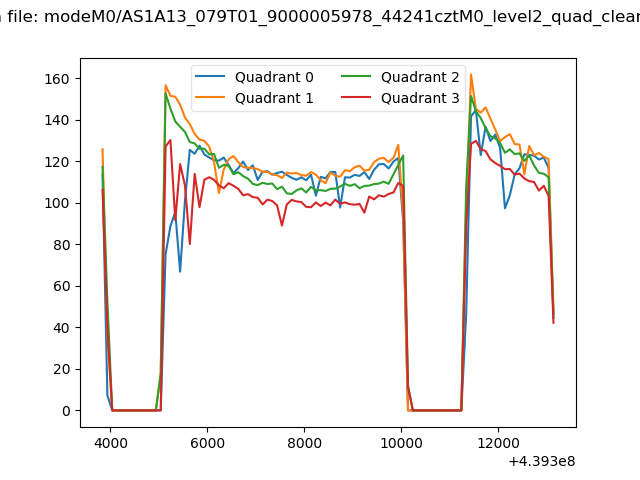 |
|
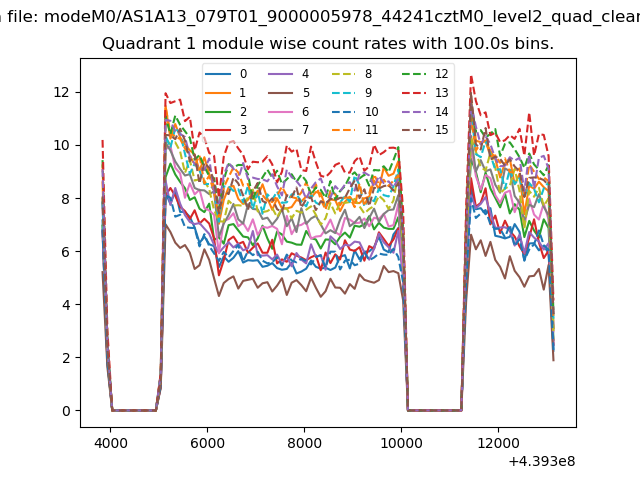
| Module-wise count rates for Quadrant A Data is divided into 100 sec bins |
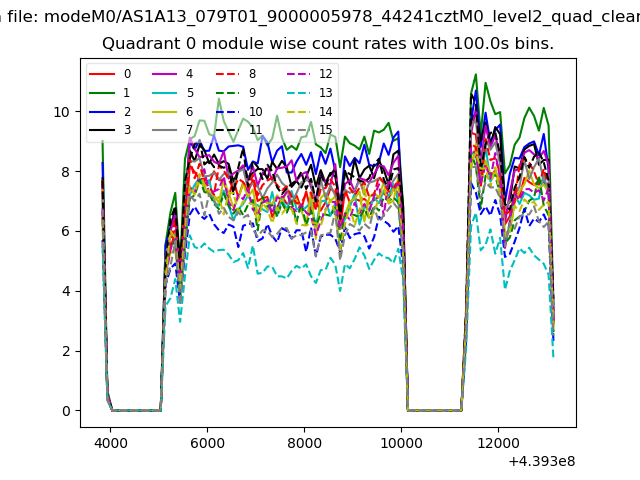 |
 |
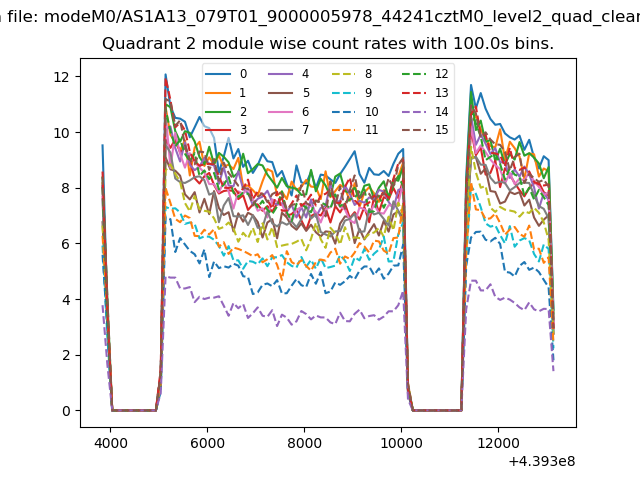
| Module-wise count rates for Quadrant B Data is divided into 100 sec bins |
 |
 |
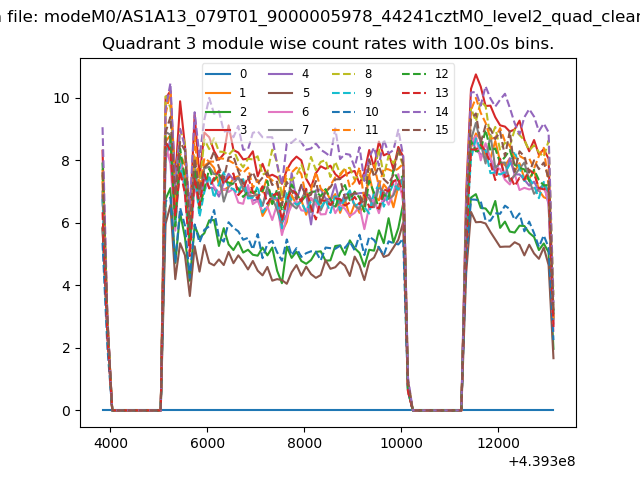
| Module-wise count rates for Quadrant C Data is divided into 100 sec bins |
 |
 |
| Module-wise count rates for Quadrant D Data is divided into 100 sec bins |
 |
 |
| Parameter | Plot |
|---|---|
| CZT HV Monitor | 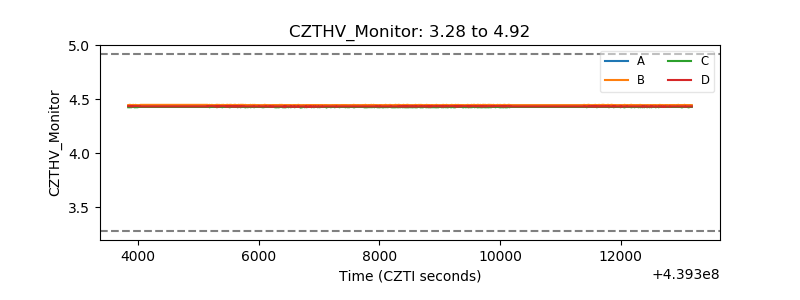 |
| D_VDD | 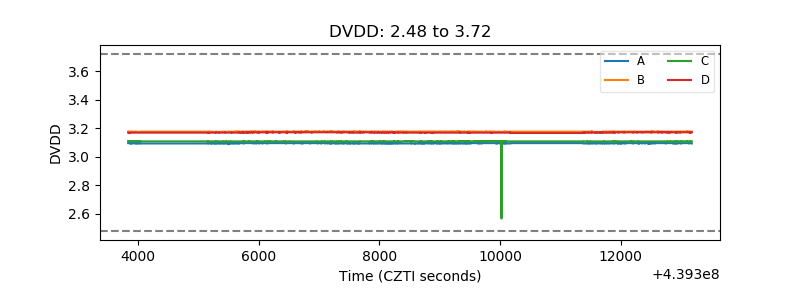 |
| Temperature 1 | 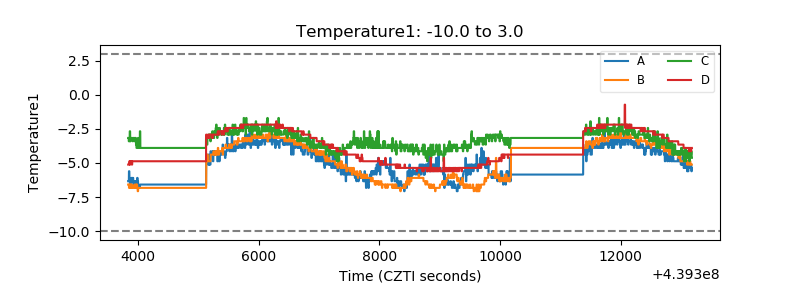 |
| Veto HV Monitor |  |
| Veto LLD | 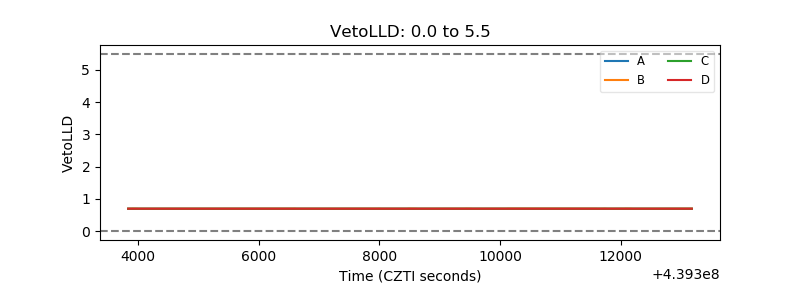 |
| Alpha Counter | 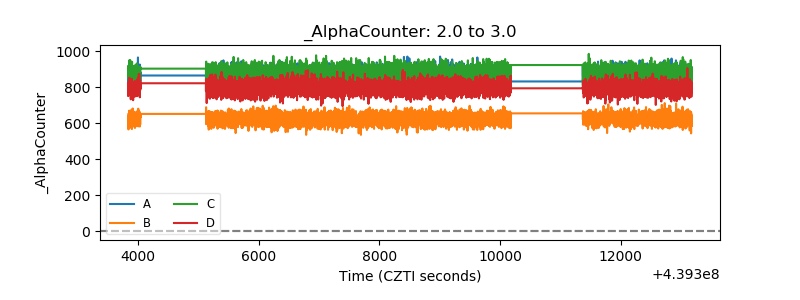 |
| _CPM_Rate | 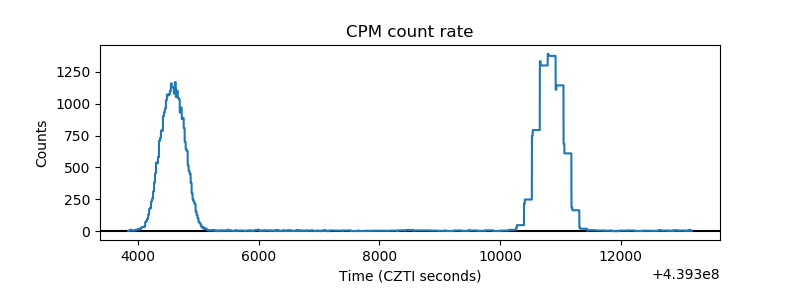 |
| CZT Counter | 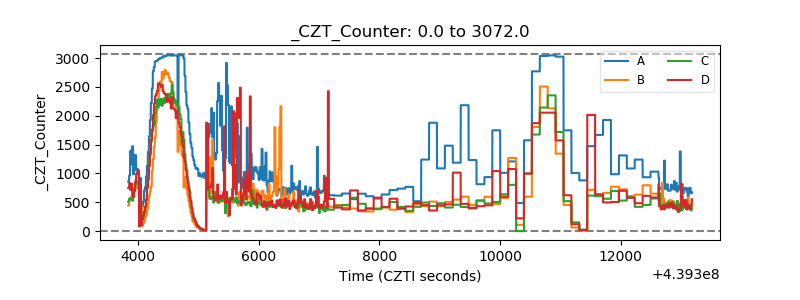 |
| +2.5 Volts monitor | 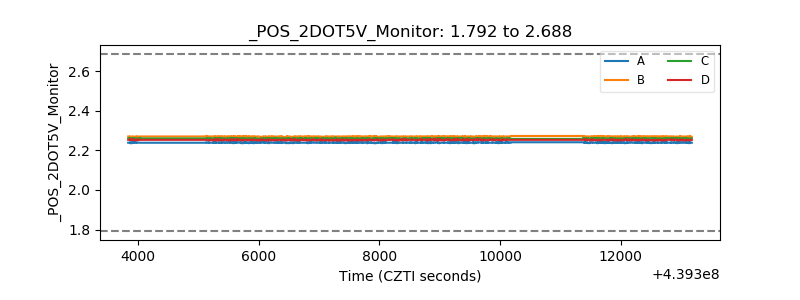 |
| +5 Volts monitor |  |
| _ROLL_ROT | 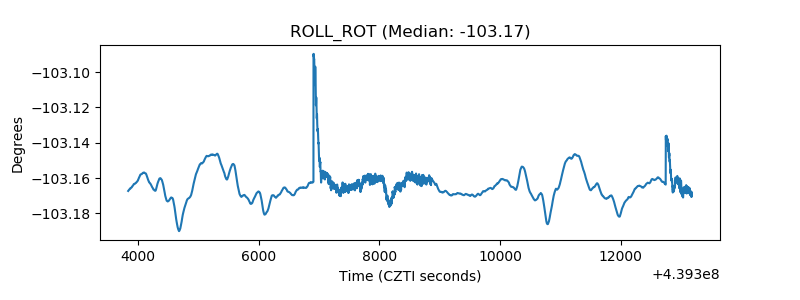 |
| _Roll_DEC | 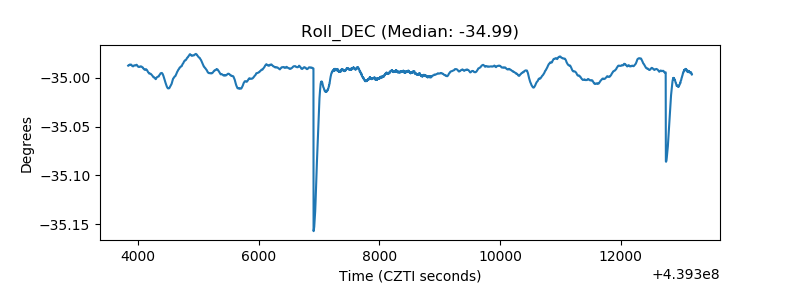 |
| _Roll_RA | 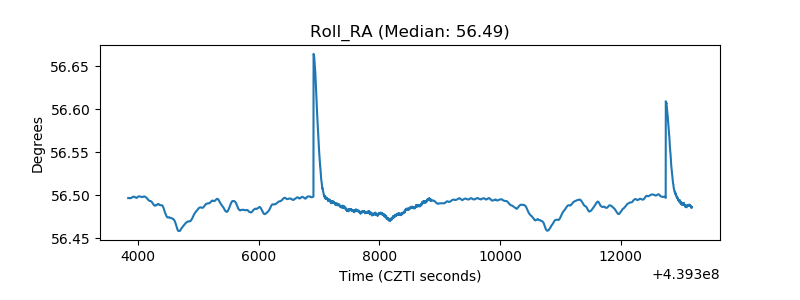 |
| Veto Counter | 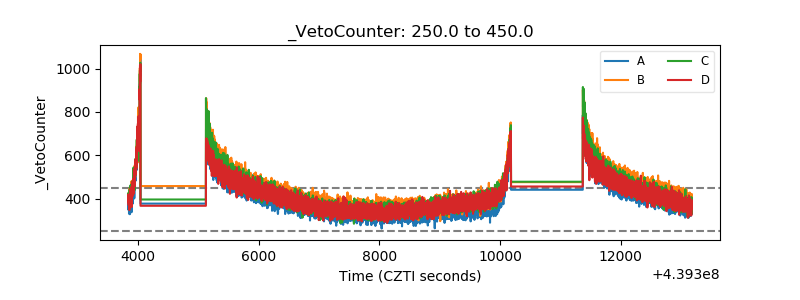 |