| Param | Original file | Final file |
|---|---|---|
| Filename | modeM0/AS1A13_079T01_9000005978_44242cztM0_level2.fits | modeM0/AS1A13_079T01_9000005978_44242cztM0_level2_quad_clean.evt |
| Size (bytes) | 505,581,120 | 118,321,920 |
| Size | 482.2 MB | 112.8 MB |
| Events in quadrant A | 6,990,242 | 788,580 |
| Events in quadrant B | 3,746,254 | 831,423 |
| Events in quadrant C | 3,573,541 | 783,805 |
| Events in quadrant D | 3,886,117 | 712,781 |
| Mode M0 | |||
|---|---|---|---|
| Quadrant | BADHDUFLAG | Total packets | Discarded packets |
| A | 0 | 25537 | 1 |
| B | 0 | 15682 | 1 |
| C | 0 | 15055 | 2 |
| D | 0 | 16224 | 1 |
| Mode SS | |||
|---|---|---|---|
| Quadrant | BADHDUFLAG | Total packets | Discarded packets |
| A | 0 | 136 | 0 |
| B | 0 | 136 | 0 |
| C | 0 | 136 | 0 |
| D | 0 | 136 | 0 |
| Mode M9 | |||
|---|---|---|---|
| Quadrant | BADHDUFLAG | Total packets | Discarded packets |
| A | 0 | 12 | 0 |
| B | 0 | 12 | 0 |
| C | 0 | 12 | 0 |
| D | 0 | 12 | 0 |
| Quadrant | Total seconds | Saturated seconds | Saturation percentage |
|---|---|---|---|
| A | 6689 | 434 | 6.488264% |
| B | 6689 | 161 | 2.406937% |
| C | 6689 | 96 | 1.435192% |
| D | 6689 | 200 | 2.989984% |
Noise dominated data is calculated using 1-second bins in cleaned event files. If a bin has >2000 counts, and if more than 50% of those come from <1% of pixels, then it is considered to be noise-dominated and hence unusable.
| Quadrant | # 1 sec bins | Bins with >0 counts | Bins with >2000 counts | High rate bins dominated by noise | Noise dominated (total time) | Noise dominated (detector-on time) | Marked lightcurve |
|---|---|---|---|---|---|---|---|
| A | 7909 | 6690 | 230 | 230 | 2.91% | 3.44% | 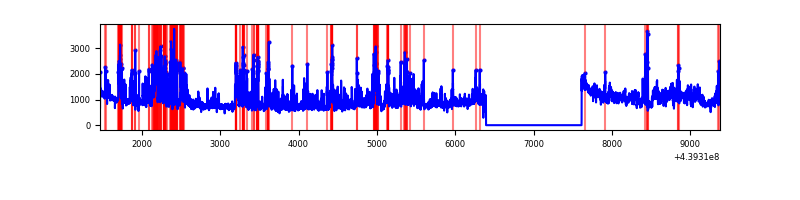 |
| B | 7909 | 6690 | 43 | 43 | 0.54% | 0.64% | 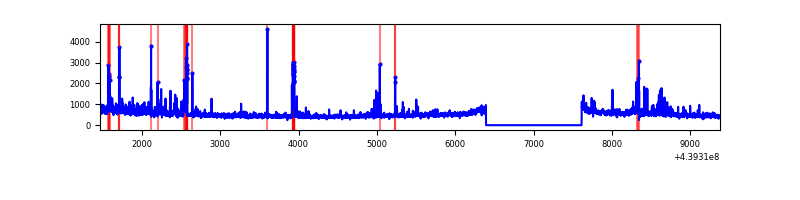 |
| C | 7909 | 6690 | 44 | 44 | 0.56% | 0.66% | 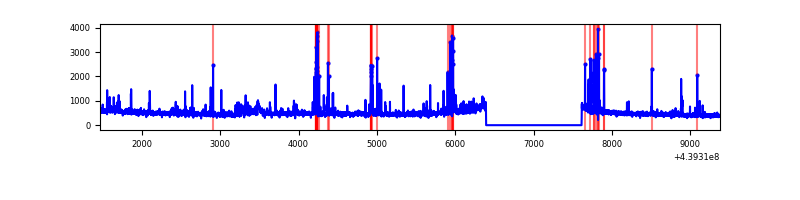 |
| D | 7909 | 6690 | 131 | 131 | 1.66% | 1.96% | 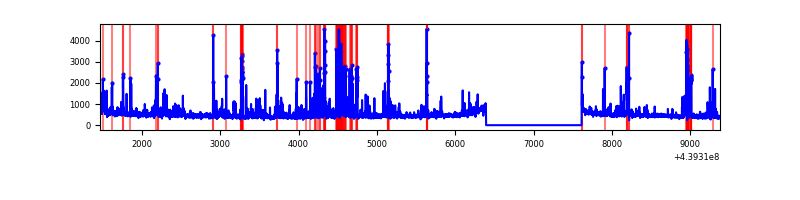 |
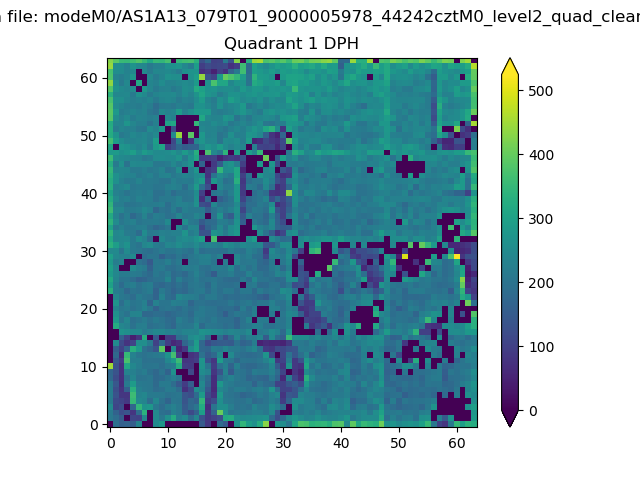
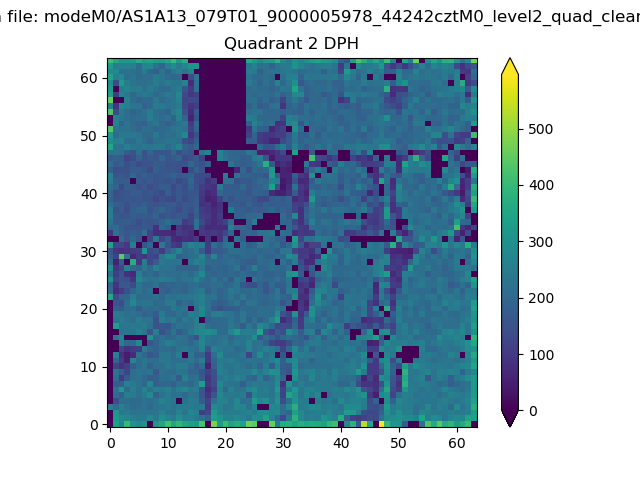
Top three noisy pixels from each quadrant. If the there are fewer than three noisy pixels in the level2.evt file, extra rows are filled as -1
| Pixel properties | Quadrant properties | ||||||
|---|---|---|---|---|---|---|---|
| Quadrant | DetID | PixID | Counts | Sigma | Mean | Median | Sigma |
| A | 15 | 223 | 2020005 | 12571.8 | 785 | 773 | 160.6 |
| A | 10 | 83 | 1486526 | 9250.34 | 785 | 773 | 160.6 |
| A | 2 | 79 | 238518 | 1480.21 | 785 | 773 | 160.6 |
| B | 4 | 158 | 121481 | 789.13 | 789 | 767 | 153.0 |
| B | 0 | 230 | 116951 | 759.51 | 789 | 767 | 153.0 |
| B | 5 | 255 | 98200 | 636.93 | 789 | 767 | 153.0 |
| C | 14 | 254 | 231729 | 1294.15 | 763 | 768 | 178.5 |
| C | 8 | 61 | 182129 | 1016.22 | 763 | 768 | 178.5 |
| C | 14 | 220 | 83597 | 464.12 | 763 | 768 | 178.5 |
| D | 13 | 249 | 619927 | 3267.24 | 757 | 733 | 189.5 |
| D | 4 | 221 | 98787 | 517.39 | 757 | 733 | 189.5 |
| D | 8 | 240 | 56127 | 292.29 | 757 | 733 | 189.5 |
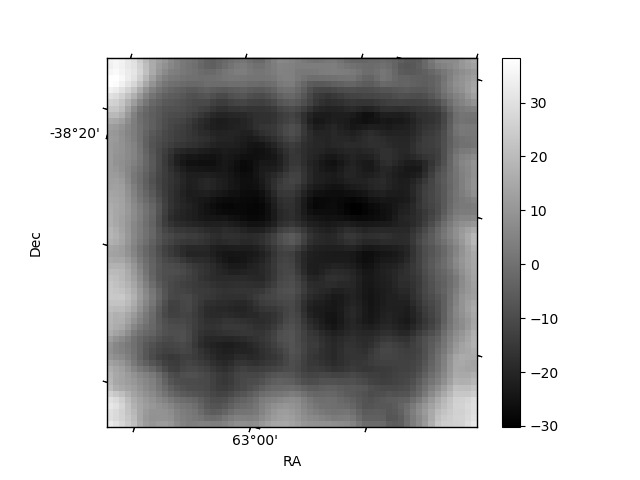
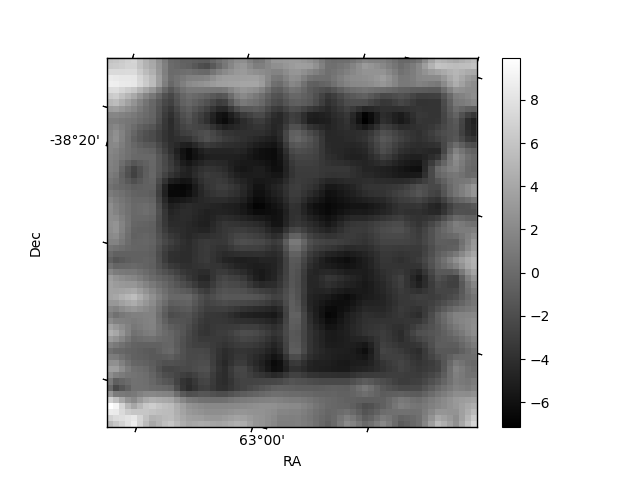
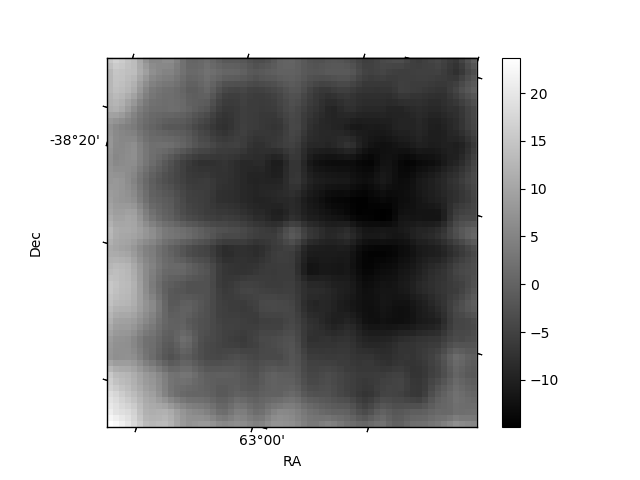
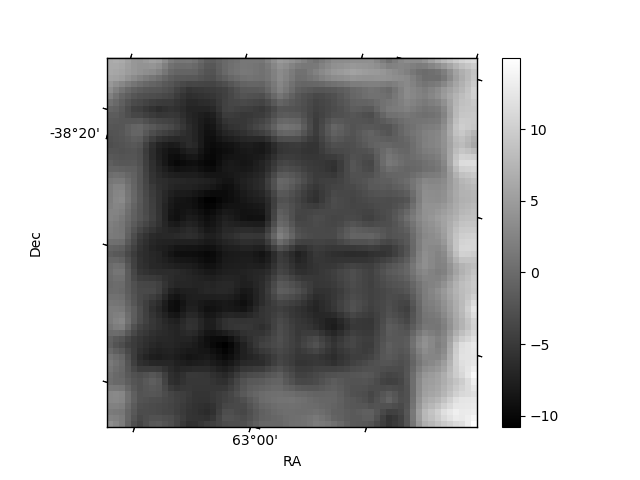
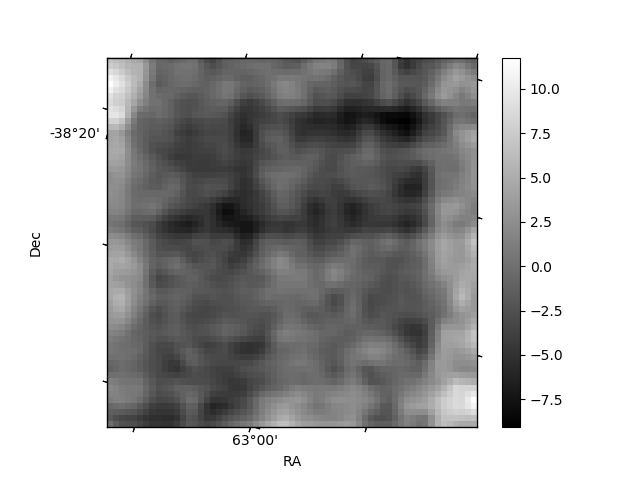
Histogram calculated using DETX and DETY for each event in the final _common_clean file
| Quadrant A | 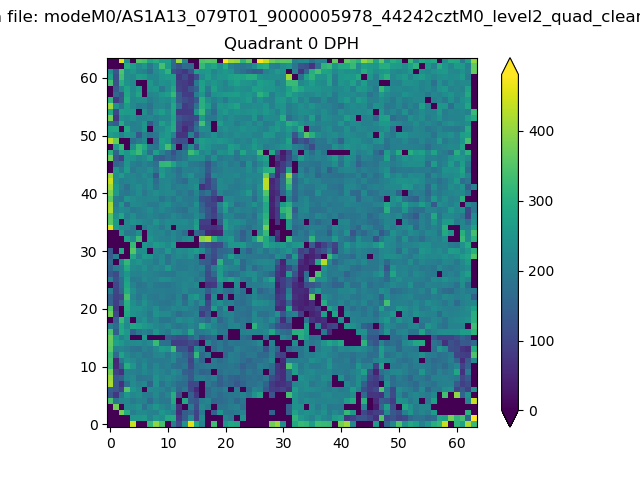 |
 |
Quadrant B |
|---|---|---|---|
| Quadrant D | 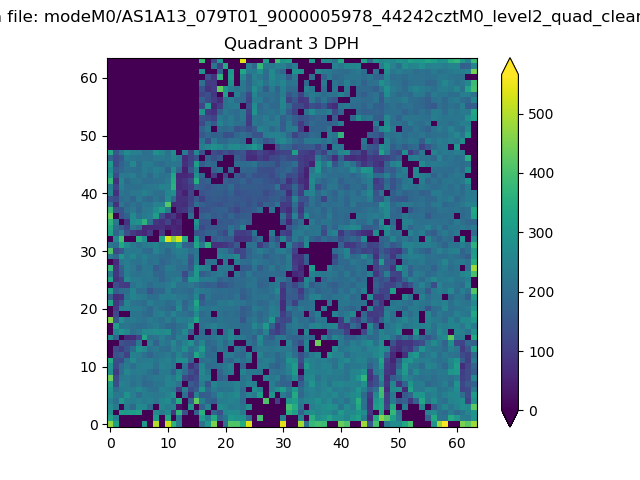 |
 |
Quadrant C |
| Plot type | Count rate plots | Images |
|---|---|---|
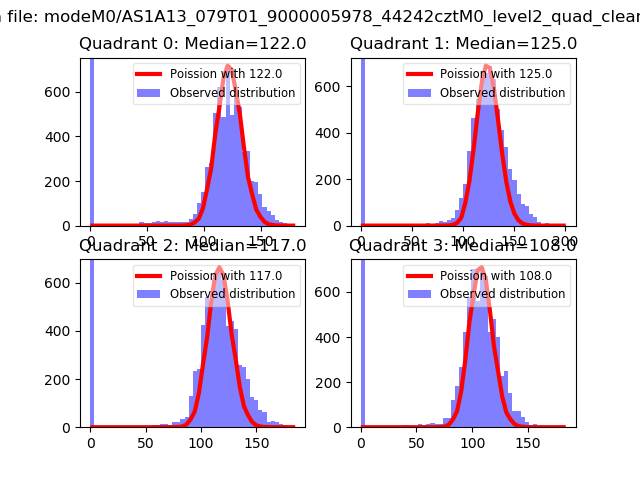
| Comparison with Poisson distribution Blue bars denote a histogram of data divided into 1 sec bins. Red curve is a Poisson curve with rate = median count rate of data. |
 |
 |
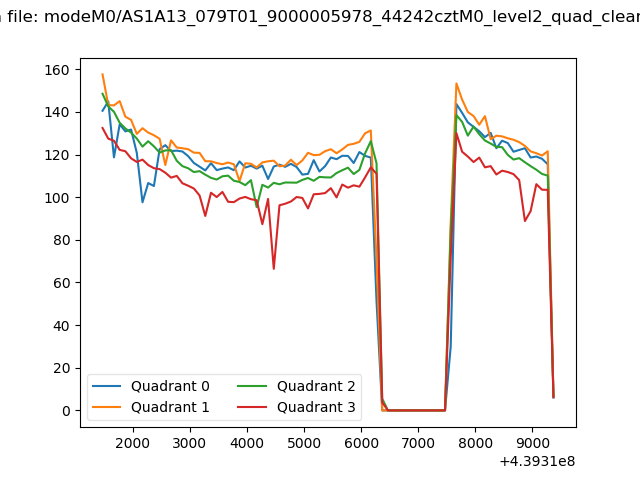
| Quadrant-wise count rates Data is divided into 100 sec bins |
 |
|
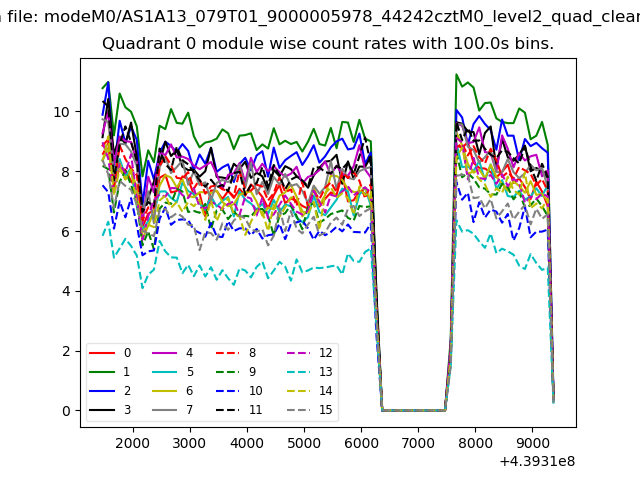
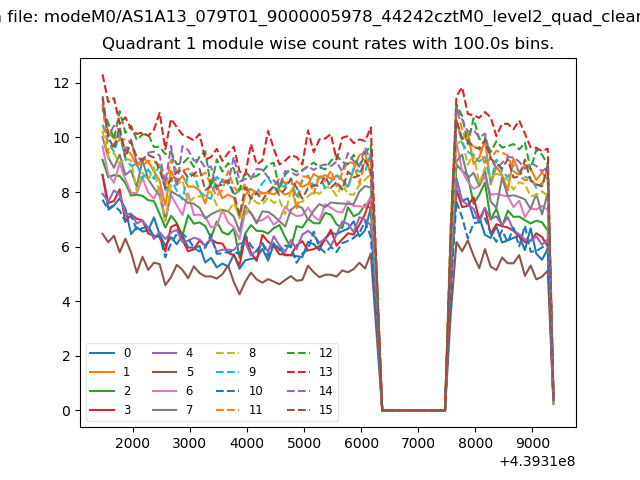
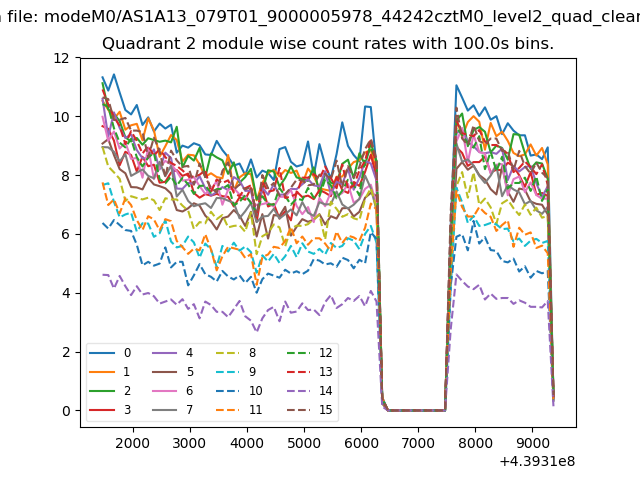
| Module-wise count rates for Quadrant A Data is divided into 100 sec bins |
 |
 |
| Module-wise count rates for Quadrant B Data is divided into 100 sec bins |
 |
 |
| Module-wise count rates for Quadrant C Data is divided into 100 sec bins |
 |
 |
| Module-wise count rates for Quadrant D Data is divided into 100 sec bins |
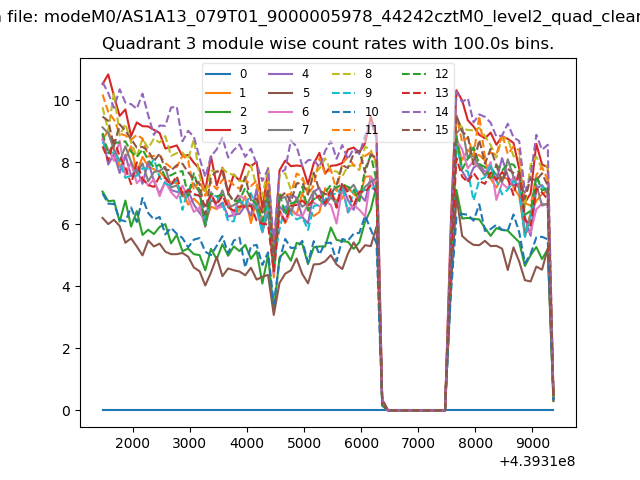 |
 |
| Parameter | Plot |
|---|---|
| CZT HV Monitor | 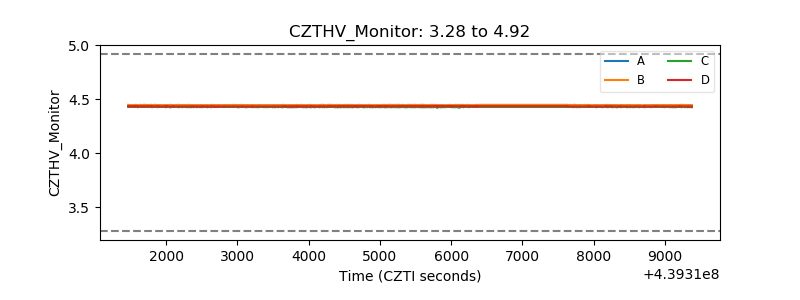 |
| D_VDD | 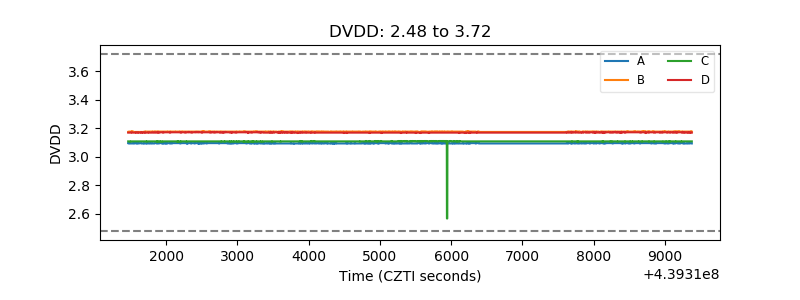 |
| Temperature 1 |  |
| Veto HV Monitor | 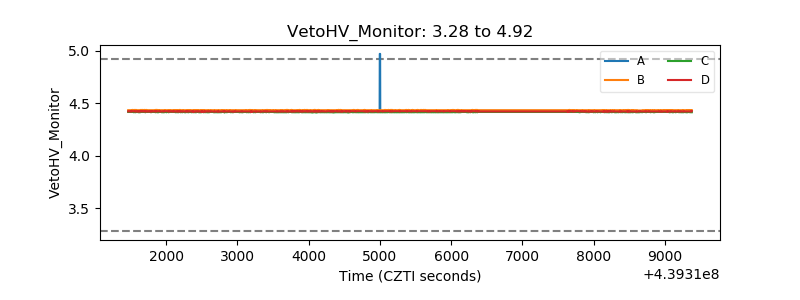 |
| Veto LLD | 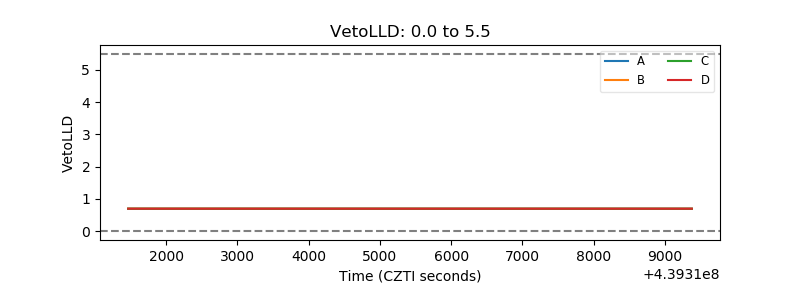 |
| Alpha Counter | 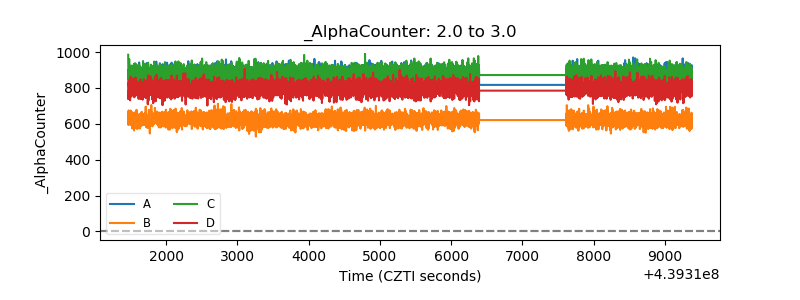 |
| _CPM_Rate | 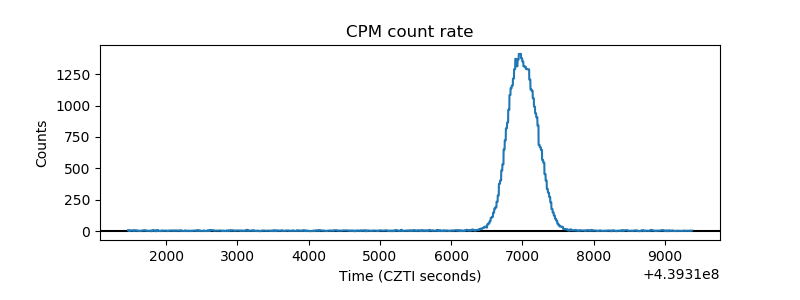 |
| CZT Counter | 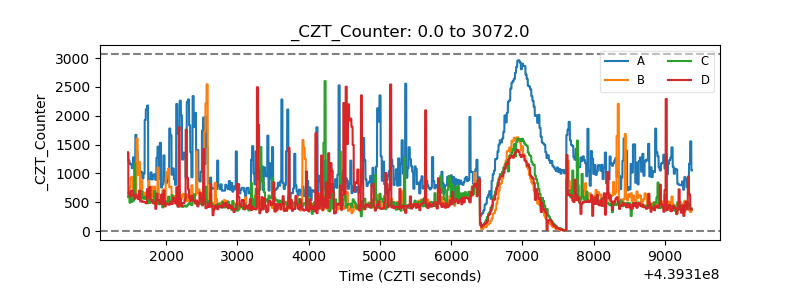 |
| +2.5 Volts monitor | 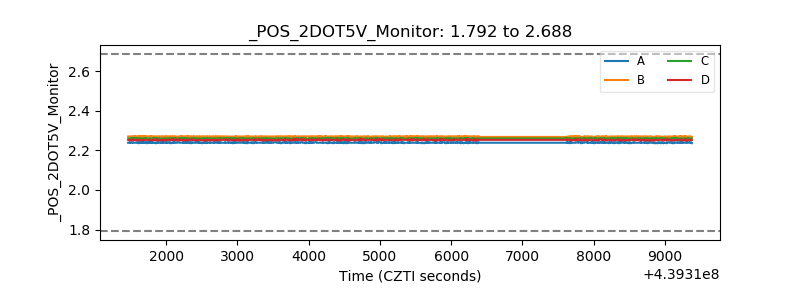 |
| +5 Volts monitor |  |
| _ROLL_ROT | 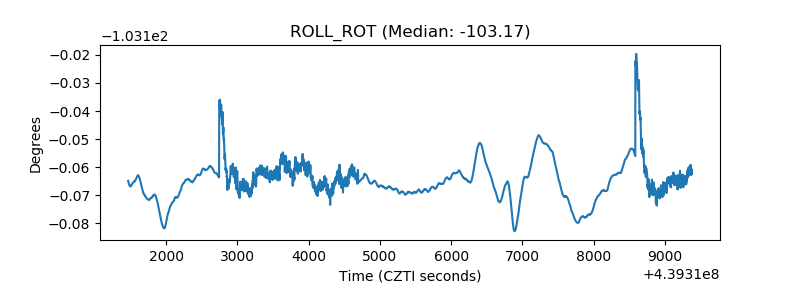 |
| _Roll_DEC | 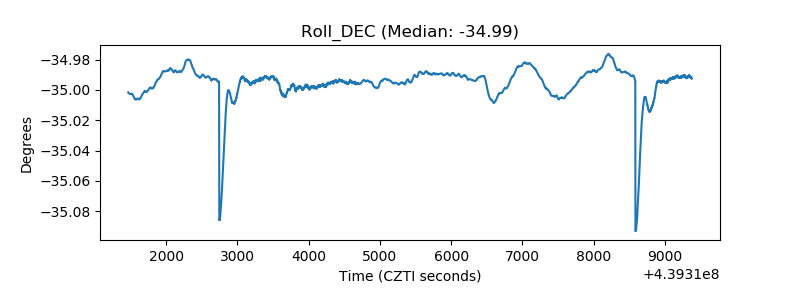 |
| _Roll_RA | 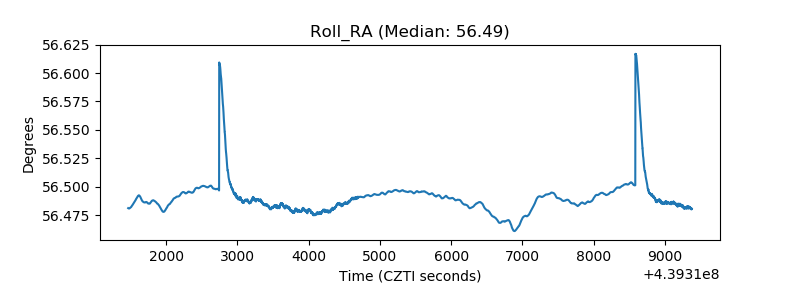 |
| Veto Counter | 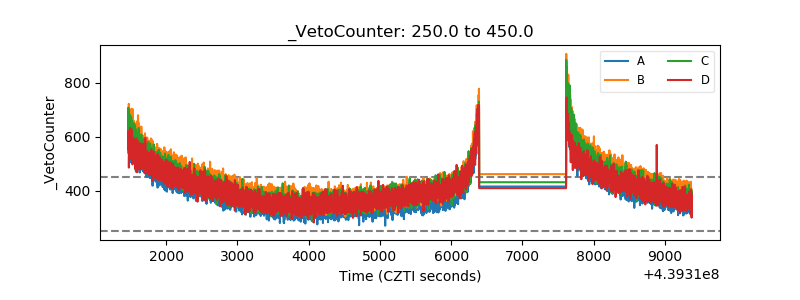 |