| Param | Original file | Final file |
|---|---|---|
| Filename | modeM0/AS1A13_079T01_9000005978_44243cztM0_level2.fits | modeM0/AS1A13_079T01_9000005978_44243cztM0_level2_quad_clean.evt |
| Size (bytes) | 478,255,680 | 106,562,880 |
| Size | 456.1 MB | 101.6 MB |
| Events in quadrant A | 7,797,014 | 650,272 |
| Events in quadrant B | 3,236,366 | 761,688 |
| Events in quadrant C | 3,132,291 | 715,982 |
| Events in quadrant D | 3,047,556 | 658,360 |
| Mode M0 | |||
|---|---|---|---|
| Quadrant | BADHDUFLAG | Total packets | Discarded packets |
| A | 0 | 27746 | 6 |
| B | 0 | 13930 | 1 |
| C | 0 | 13882 | 1 |
| D | 0 | 13775 | 1 |
| Mode SS | |||
|---|---|---|---|
| Quadrant | BADHDUFLAG | Total packets | Discarded packets |
| A | 0 | 128 | 0 |
| B | 0 | 128 | 0 |
| C | 0 | 128 | 0 |
| D | 0 | 128 | 0 |
| Mode M9 | |||
|---|---|---|---|
| Quadrant | BADHDUFLAG | Total packets | Discarded packets |
| A | 0 | 13 | 0 |
| B | 0 | 13 | 0 |
| C | 0 | 13 | 0 |
| D | 0 | 13 | 0 |
| Quadrant | Total seconds | Saturated seconds | Saturation percentage |
|---|---|---|---|
| A | 6310 | 1108 | 17.559429% |
| B | 6311 | 105 | 1.663762% |
| C | 6311 | 80 | 1.267628% |
| D | 6311 | 70 | 1.109174% |
Noise dominated data is calculated using 1-second bins in cleaned event files. If a bin has >2000 counts, and if more than 50% of those come from <1% of pixels, then it is considered to be noise-dominated and hence unusable.
| Quadrant | # 1 sec bins | Bins with >0 counts | Bins with >2000 counts | High rate bins dominated by noise | Noise dominated (total time) | Noise dominated (detector-on time) | Marked lightcurve |
|---|---|---|---|---|---|---|---|
| A | 7519 | 6310 | 784 | 784 | 10.43% | 12.42% | 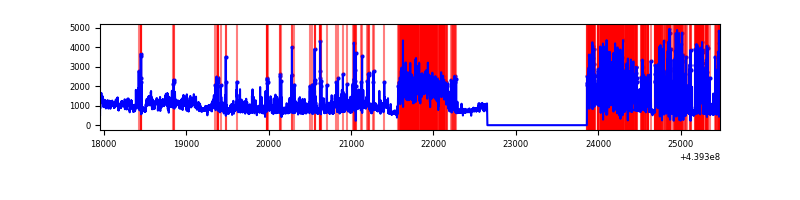 |
| B | 7521 | 6312 | 15 | 15 | 0.20% | 0.24% | 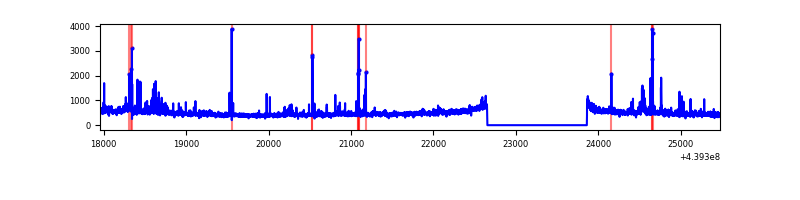 |
| C | 7521 | 6312 | 48 | 48 | 0.64% | 0.76% | 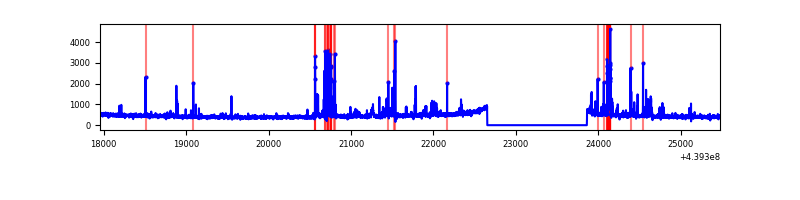 |
| D | 7521 | 6312 | 35 | 35 | 0.47% | 0.55% | 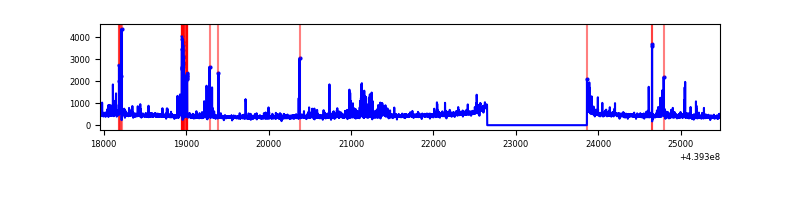 |
Top three noisy pixels from each quadrant. If the there are fewer than three noisy pixels in the level2.evt file, extra rows are filled as -1
| Pixel properties | Quadrant properties | ||||||
|---|---|---|---|---|---|---|---|
| Quadrant | DetID | PixID | Counts | Sigma | Mean | Median | Sigma |
| A | 15 | 223 | 3338889 | 23655.17 | 687 | 674 | 141.1 |
| A | 10 | 83 | 1277598 | 9048.51 | 687 | 674 | 141.1 |
| A | 12 | 227 | 162061 | 1143.62 | 687 | 674 | 141.1 |
| B | 5 | 255 | 71247 | 507.41 | 723 | 704 | 139.0 |
| B | 4 | 173 | 66192 | 471.05 | 723 | 704 | 139.0 |
| B | 0 | 190 | 60429 | 429.59 | 723 | 704 | 139.0 |
| C | 14 | 254 | 333739 | 2031.33 | 698 | 703 | 163.9 |
| C | 3 | 233 | 30904 | 184.21 | 698 | 703 | 163.9 |
| C | 5 | 250 | 15369 | 89.45 | 698 | 703 | 163.9 |
| D | 13 | 249 | 173387 | 980.15 | 694 | 673 | 176.2 |
| D | 4 | 221 | 60689 | 340.59 | 694 | 673 | 176.2 |
| D | 2 | 249 | 39884 | 222.52 | 694 | 673 | 176.2 |
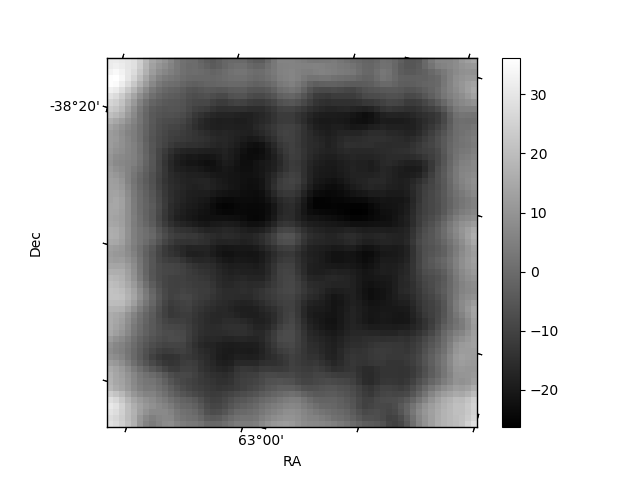
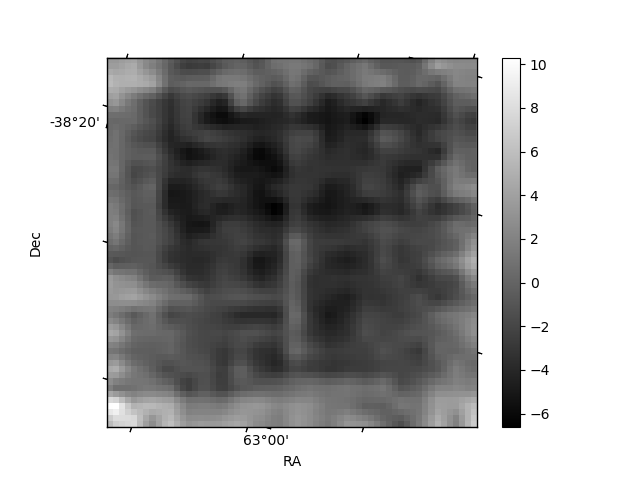
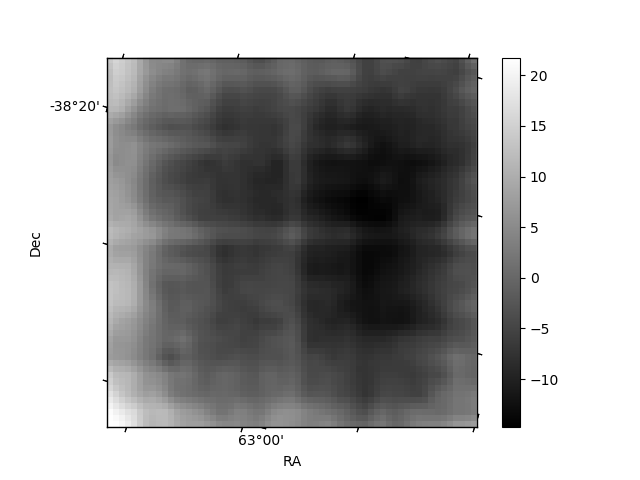
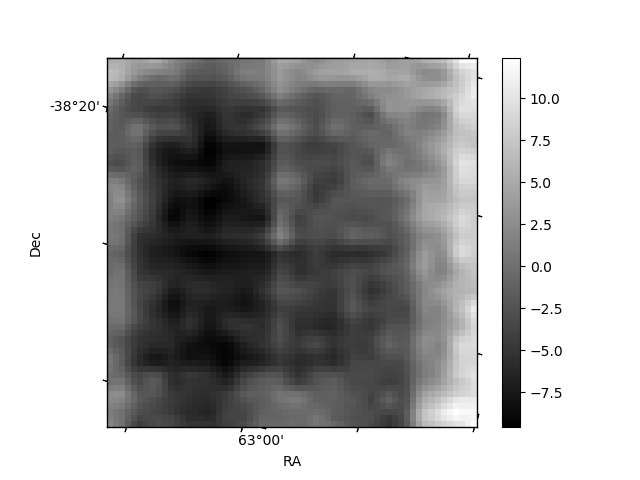
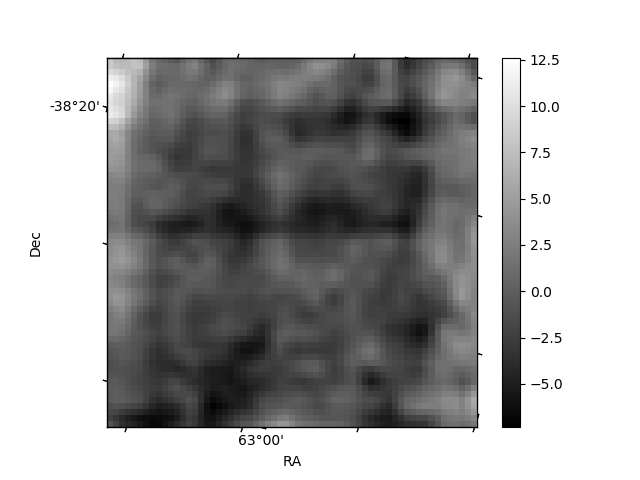
Histogram calculated using DETX and DETY for each event in the final _common_clean file
| Quadrant A | 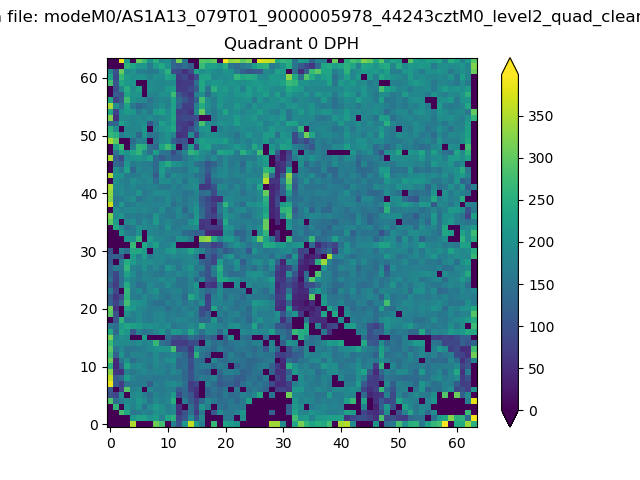 |
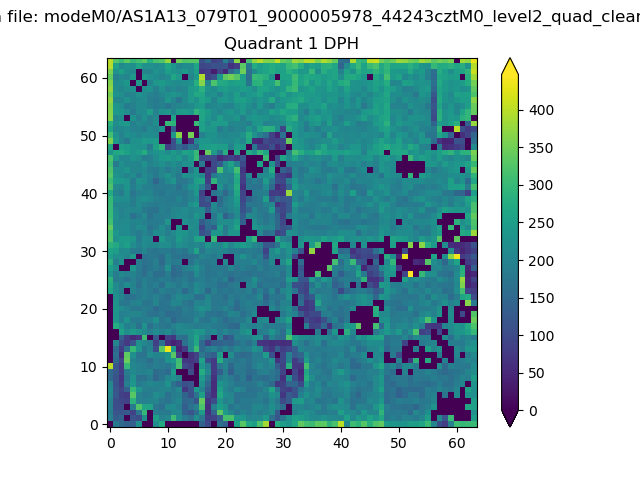 |
Quadrant B |
|---|---|---|---|
| Quadrant D | 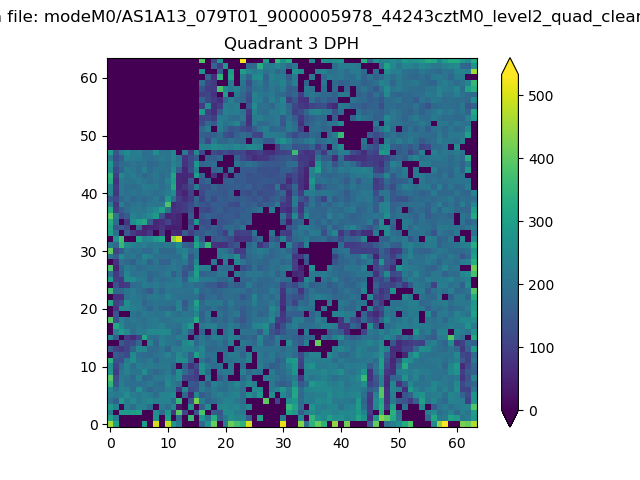 |
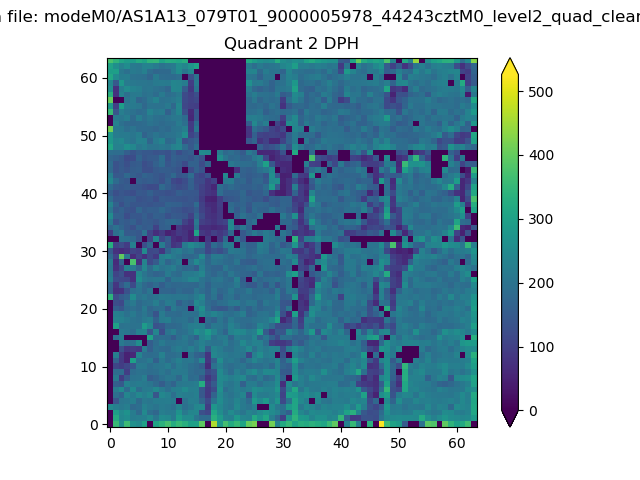 |
Quadrant C |
| Plot type | Count rate plots | Images |
|---|---|---|
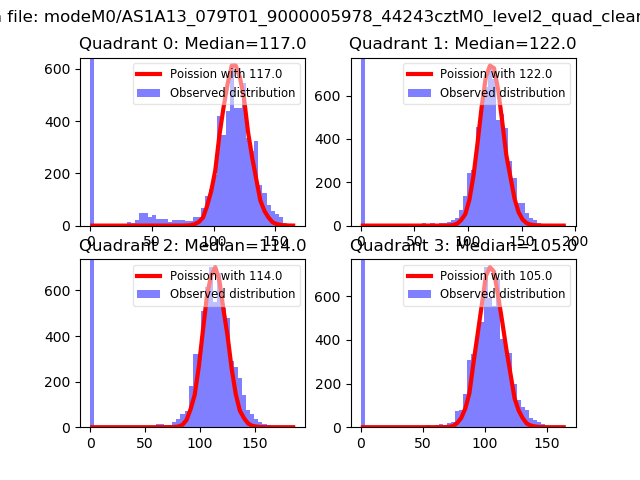
| Comparison with Poisson distribution Blue bars denote a histogram of data divided into 1 sec bins. Red curve is a Poisson curve with rate = median count rate of data. |
 |
 |
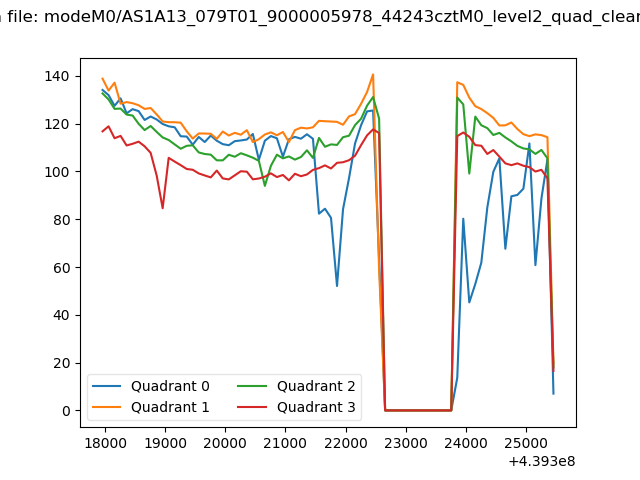
| Quadrant-wise count rates Data is divided into 100 sec bins |
 |
|
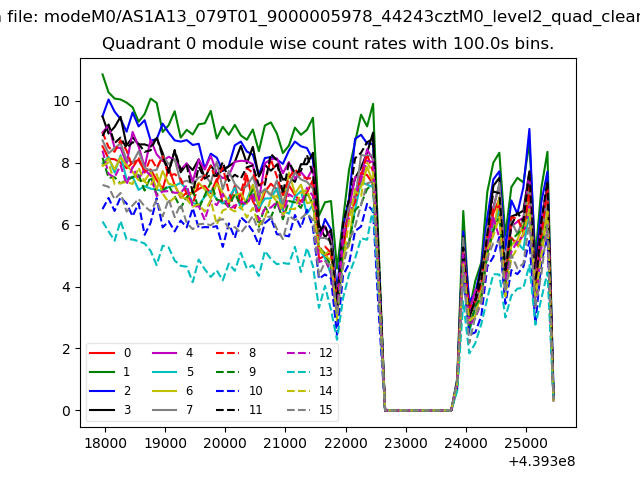
| Module-wise count rates for Quadrant A Data is divided into 100 sec bins |
 |
 |
| Module-wise count rates for Quadrant B Data is divided into 100 sec bins |
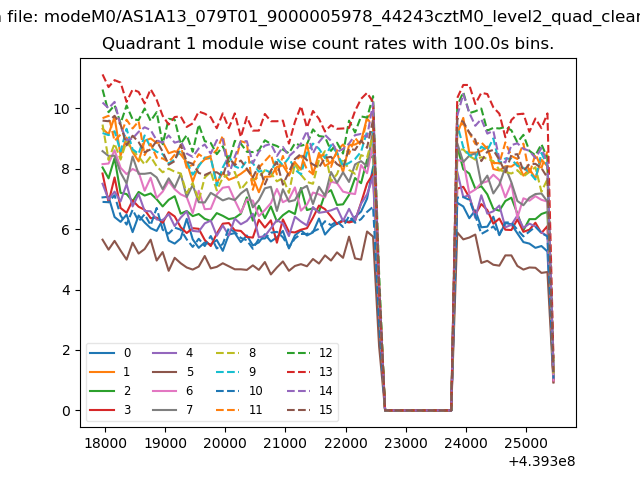 |
 |
| Module-wise count rates for Quadrant C Data is divided into 100 sec bins |
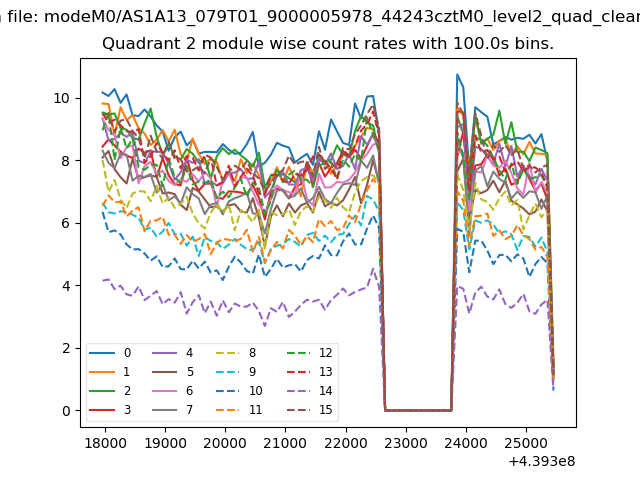 |
 |
| Module-wise count rates for Quadrant D Data is divided into 100 sec bins |
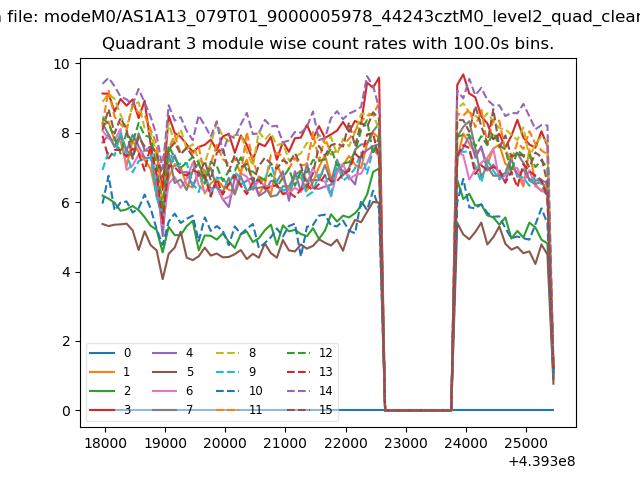 |
 |
| Parameter | Plot |
|---|---|
| CZT HV Monitor | 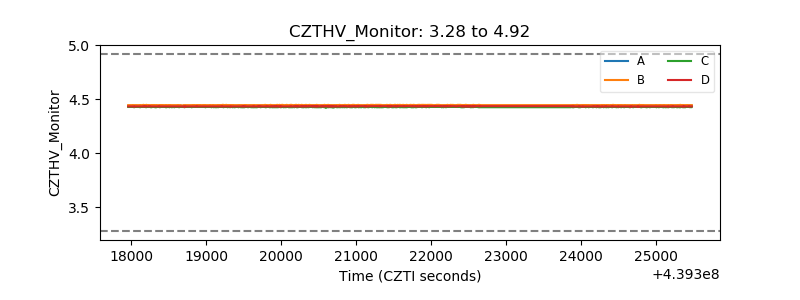 |
| D_VDD |  |
| Temperature 1 | 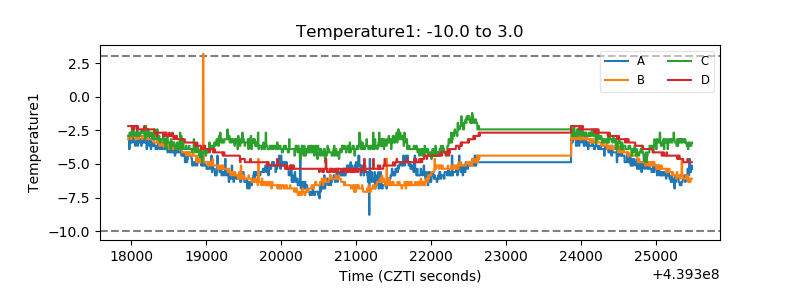 |
| Veto HV Monitor | 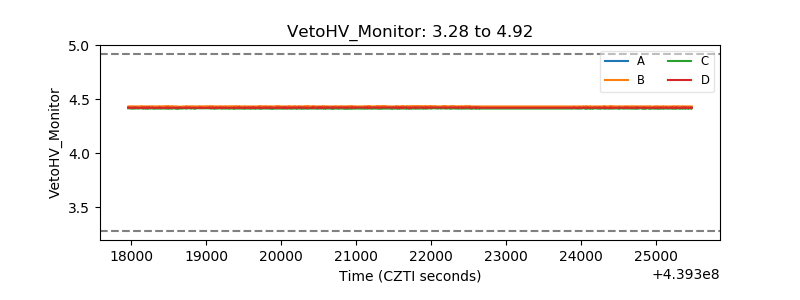 |
| Veto LLD | 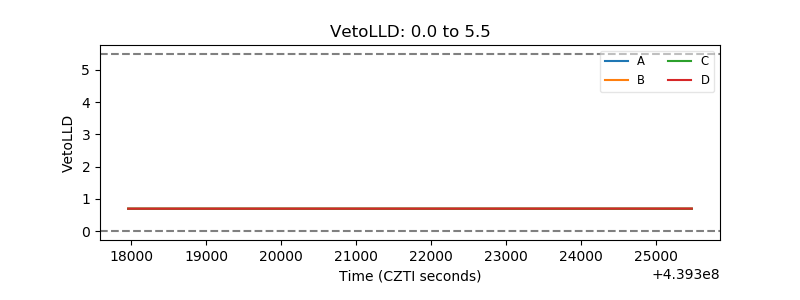 |
| Alpha Counter | 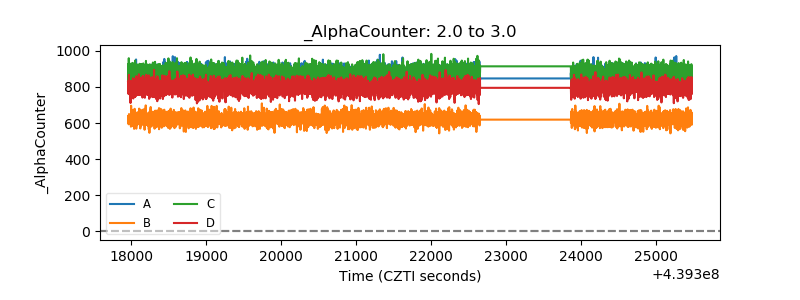 |
| _CPM_Rate | 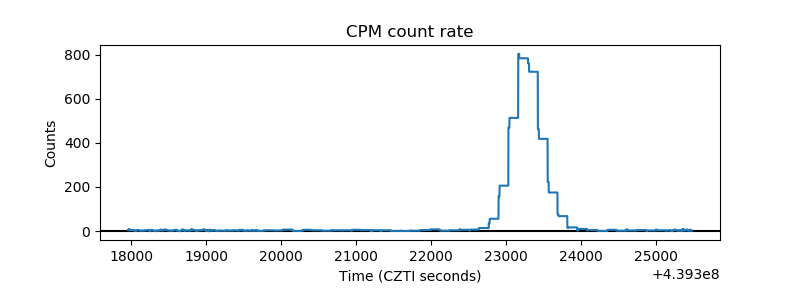 |
| CZT Counter | 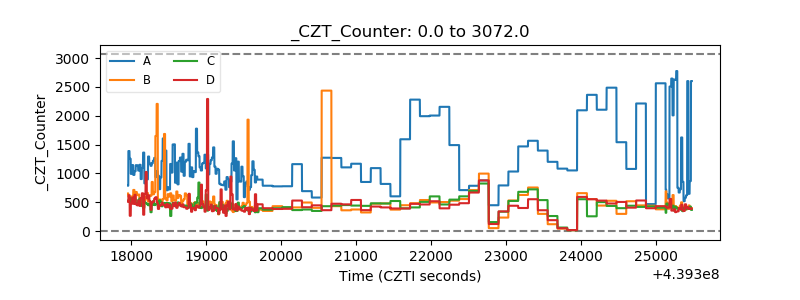 |
| +2.5 Volts monitor | 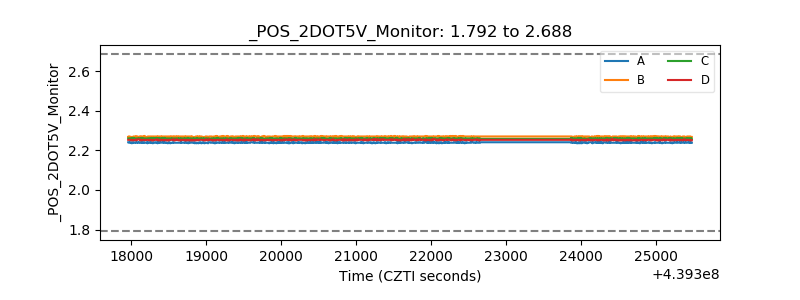 |
| +5 Volts monitor | 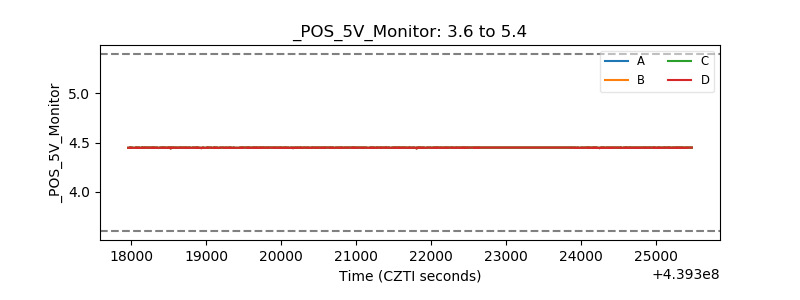 |
| _ROLL_ROT | 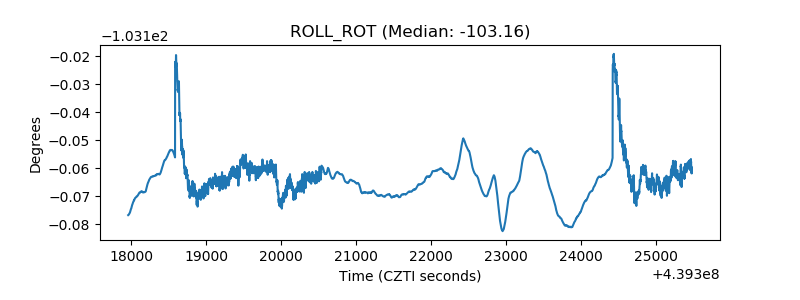 |
| _Roll_DEC | 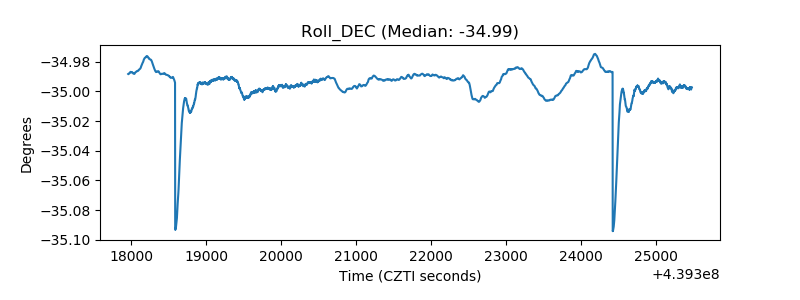 |
| _Roll_RA | 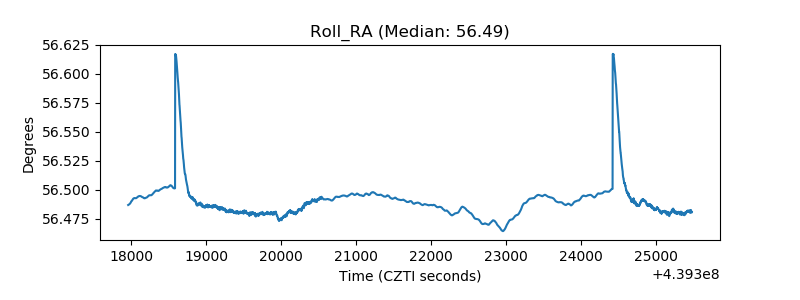 |
| Veto Counter | 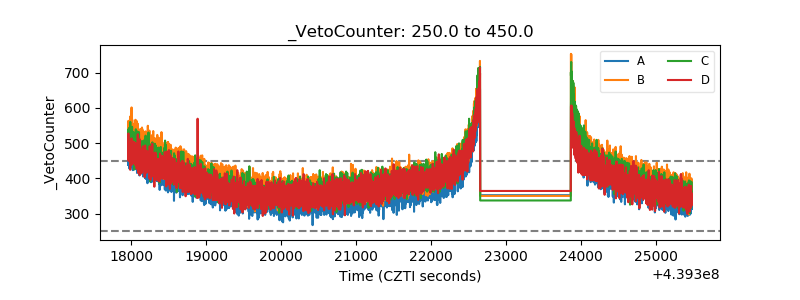 |