| Param | Original file | Final file |
|---|---|---|
| Filename | modeM0/AS1A13_079T01_9000005978_44245cztM0_level2.fits | modeM0/AS1A13_079T01_9000005978_44245cztM0_level2_quad_clean.evt |
| Size (bytes) | 530,496,000 | 110,738,880 |
| Size | 505.9 MB | 105.6 MB |
| Events in quadrant A | 8,254,636 | 639,548 |
| Events in quadrant B | 3,568,941 | 790,631 |
| Events in quadrant C | 3,072,804 | 753,008 |
| Events in quadrant D | 4,196,487 | 681,364 |
| Mode M0 | |||
|---|---|---|---|
| Quadrant | BADHDUFLAG | Total packets | Discarded packets |
| A | 0 | 29640 | 2 |
| B | 0 | 15421 | 2 |
| C | 0 | 14433 | 2 |
| D | 0 | 17638 | 3 |
| Mode SS | |||
|---|---|---|---|
| Quadrant | BADHDUFLAG | Total packets | Discarded packets |
| A | 0 | 144 | 0 |
| B | 0 | 144 | 0 |
| C | 0 | 144 | 0 |
| D | 0 | 144 | 0 |
| Mode M9 | |||
|---|---|---|---|
| Quadrant | BADHDUFLAG | Total packets | Discarded packets |
| A | 0 | 9 | 0 |
| B | 0 | 10 | 0 |
| C | 0 | 10 | 0 |
| D | 0 | 10 | 0 |
| Quadrant | Total seconds | Saturated seconds | Saturation percentage |
|---|---|---|---|
| A | 7008 | 1424 | 20.319635% |
| B | 7008 | 74 | 1.055936% |
| C | 7008 | 11 | 0.156963% |
| D | 7007 | 127 | 1.812473% |
Noise dominated data is calculated using 1-second bins in cleaned event files. If a bin has >2000 counts, and if more than 50% of those come from <1% of pixels, then it is considered to be noise-dominated and hence unusable.
| Quadrant | # 1 sec bins | Bins with >0 counts | Bins with >2000 counts | High rate bins dominated by noise | Noise dominated (total time) | Noise dominated (detector-on time) | Marked lightcurve |
|---|---|---|---|---|---|---|---|
| A | 7738 | 7009 | 1110 | 1110 | 14.34% | 15.84% | 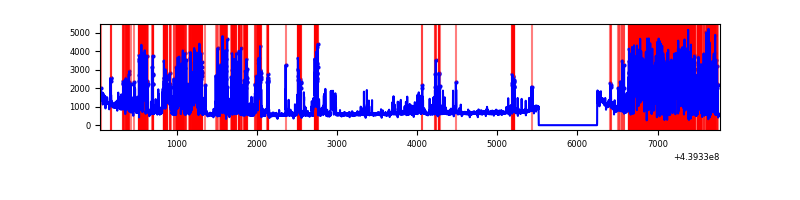 |
| B | 7738 | 7009 | 37 | 37 | 0.48% | 0.53% | 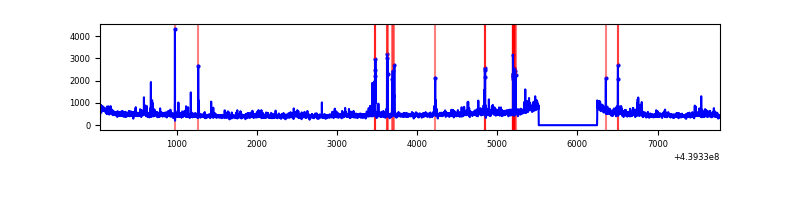 |
| C | 7738 | 7009 | 3 | 3 | 0.04% | 0.04% | 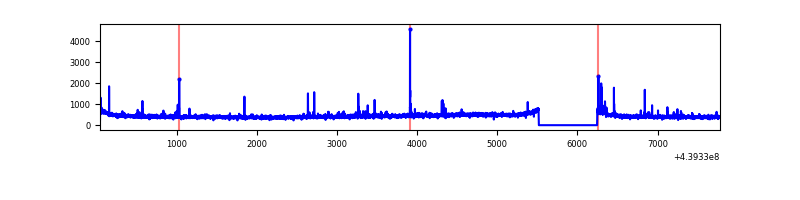 |
| D | 7737 | 7008 | 98 | 98 | 1.27% | 1.40% | 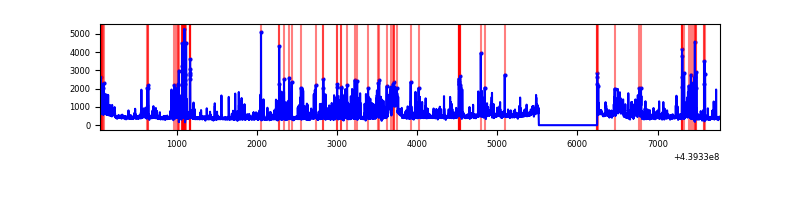 |
Top three noisy pixels from each quadrant. If the there are fewer than three noisy pixels in the level2.evt file, extra rows are filled as -1
| Pixel properties | Quadrant properties | ||||||
|---|---|---|---|---|---|---|---|
| Quadrant | DetID | PixID | Counts | Sigma | Mean | Median | Sigma |
| A | 15 | 223 | 3880194 | 26120.16 | 717 | 703 | 148.5 |
| A | 10 | 83 | 1477708 | 9944.5 | 717 | 703 | 148.5 |
| A | 10 | 248 | 89944 | 600.85 | 717 | 703 | 148.5 |
| B | 0 | 219 | 119190 | 768.13 | 778 | 755 | 154.2 |
| B | 4 | 158 | 90068 | 579.25 | 778 | 755 | 154.2 |
| B | 0 | 155 | 87370 | 561.75 | 778 | 755 | 154.2 |
| C | 14 | 254 | 83962 | 461.45 | 760 | 764 | 180.3 |
| C | 3 | 233 | 19061 | 101.48 | 760 | 764 | 180.3 |
| C | 13 | 61 | 5010 | 23.55 | 760 | 764 | 180.3 |
| D | 4 | 221 | 370650 | 2013.23 | 746 | 725 | 183.7 |
| D | 13 | 249 | 352370 | 1913.75 | 746 | 725 | 183.7 |
| D | 13 | 138 | 128657 | 696.24 | 746 | 725 | 183.7 |
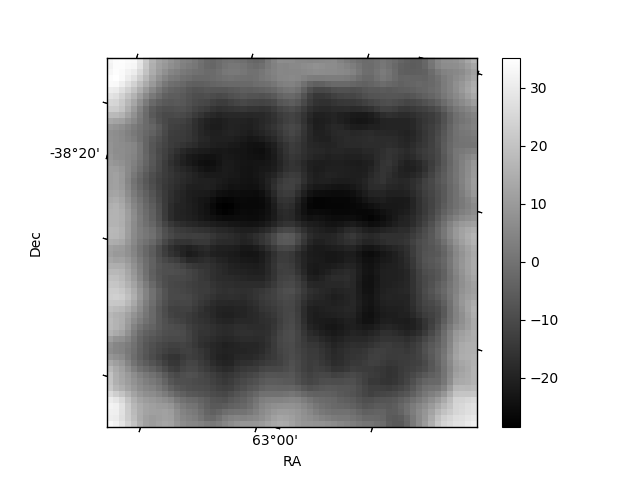
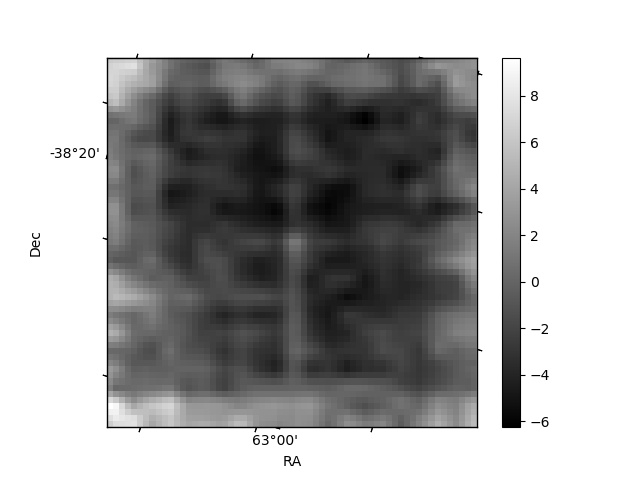
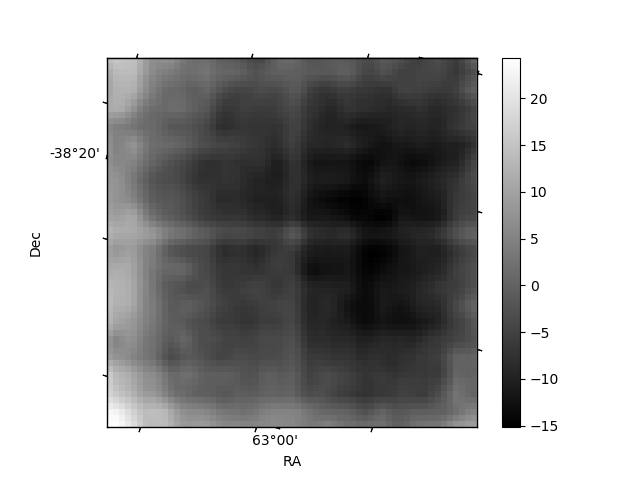
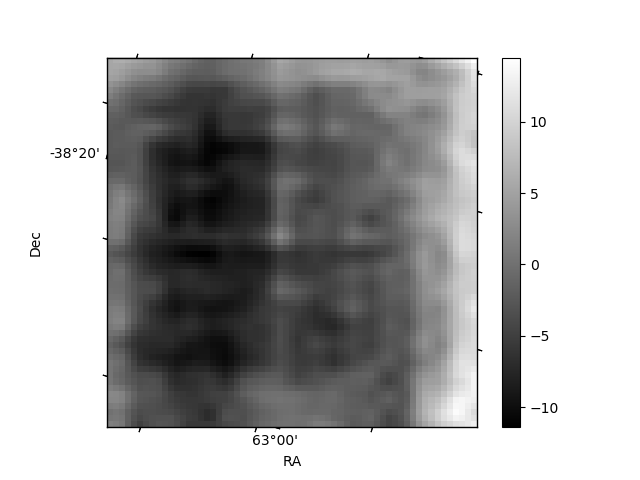
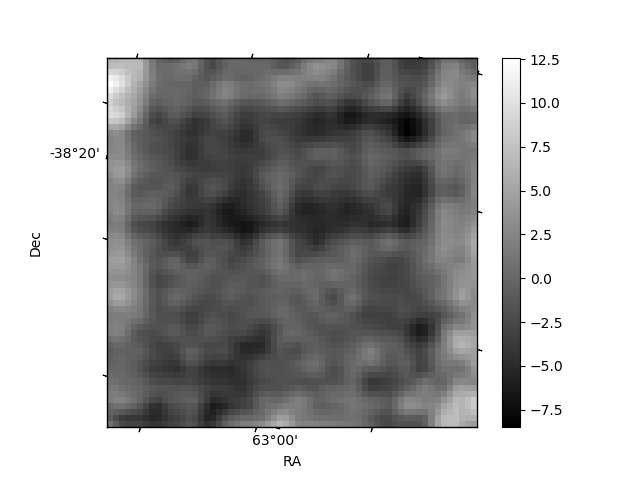
Histogram calculated using DETX and DETY for each event in the final _common_clean file
| Quadrant A | 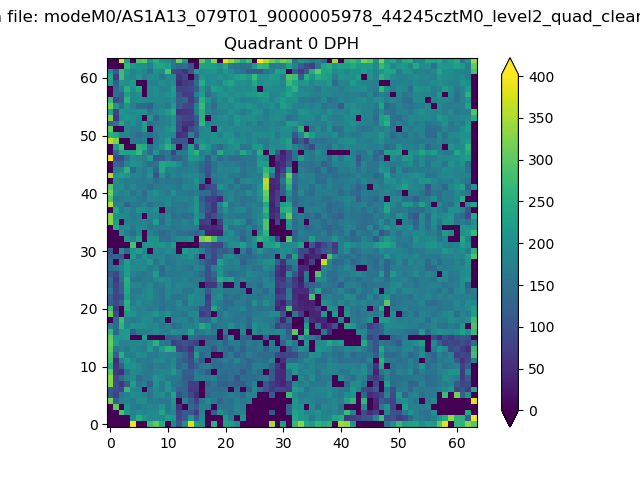 |
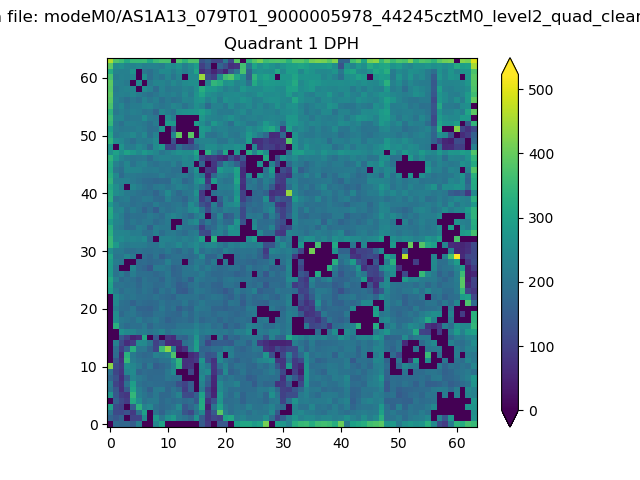 |
Quadrant B |
|---|---|---|---|
| Quadrant D | 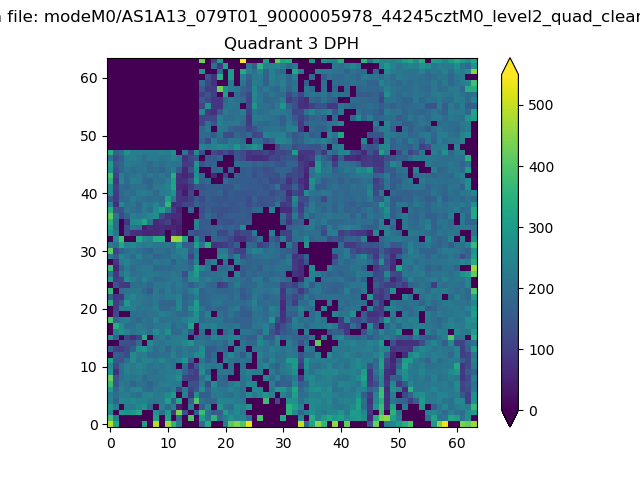 |
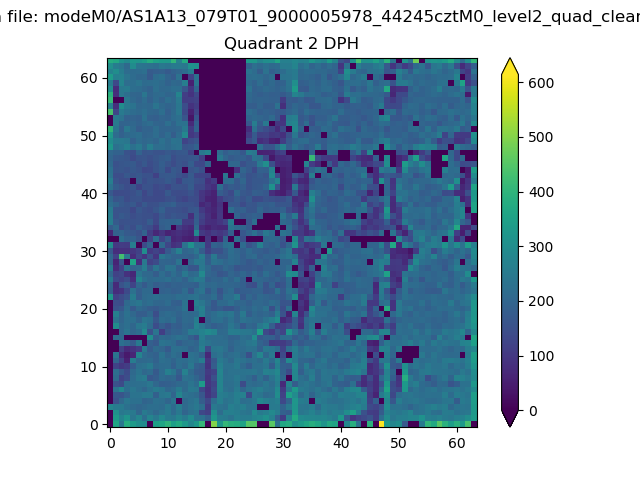 |
Quadrant C |
| Plot type | Count rate plots | Images |
|---|---|---|
| Comparison with Poisson distribution Blue bars denote a histogram of data divided into 1 sec bins. Red curve is a Poisson curve with rate = median count rate of data. |
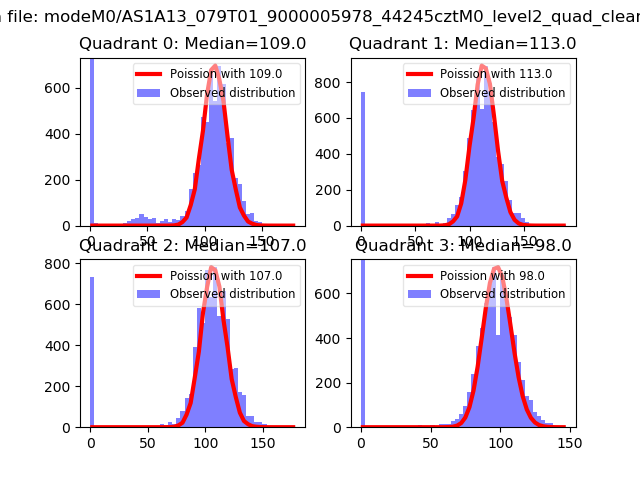 |
 |
| Quadrant-wise count rates Data is divided into 100 sec bins |
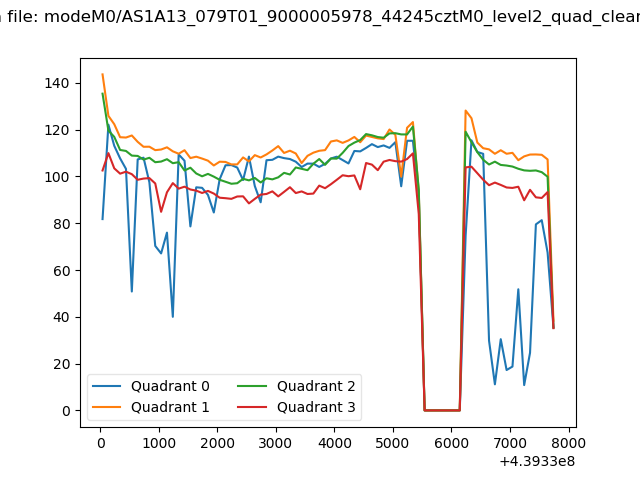 |
|
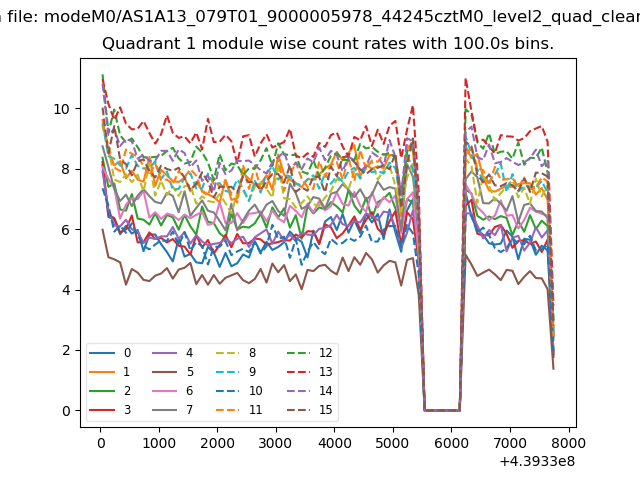
| Module-wise count rates for Quadrant A Data is divided into 100 sec bins |
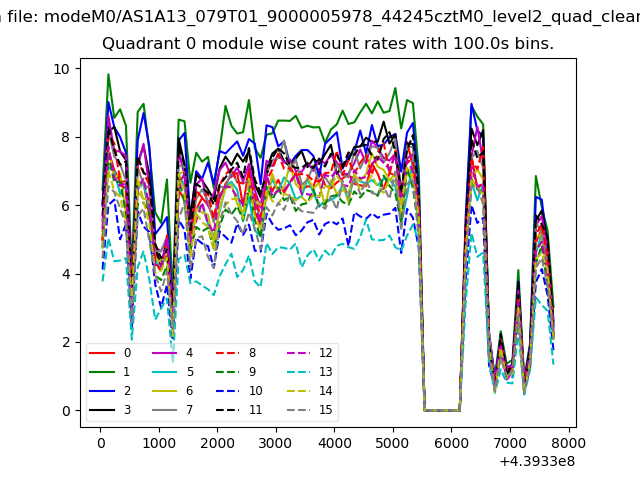 |
 |
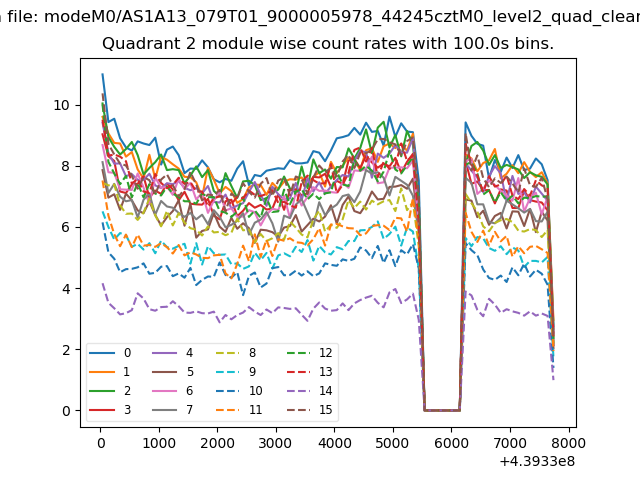
| Module-wise count rates for Quadrant B Data is divided into 100 sec bins |
 |
 |
| Module-wise count rates for Quadrant C Data is divided into 100 sec bins |
 |
 |
| Module-wise count rates for Quadrant D Data is divided into 100 sec bins |
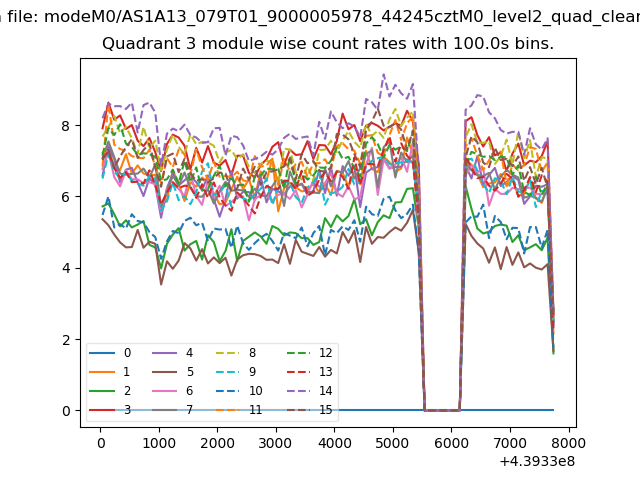 |
 |
| Parameter | Plot |
|---|---|
| CZT HV Monitor | 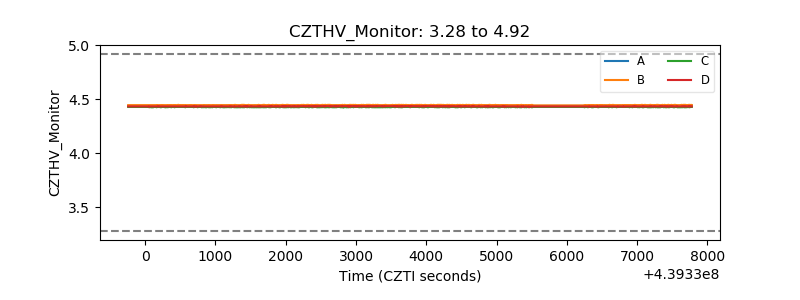 |
| D_VDD | 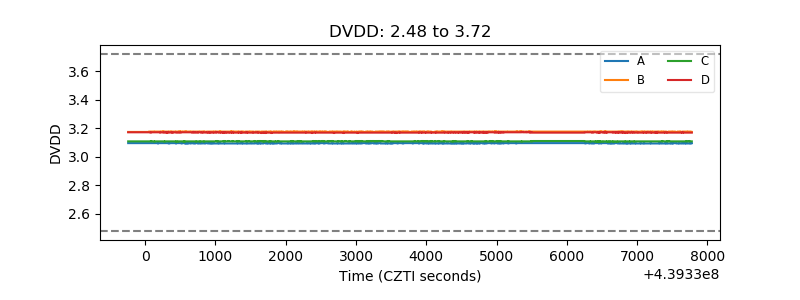 |
| Temperature 1 | 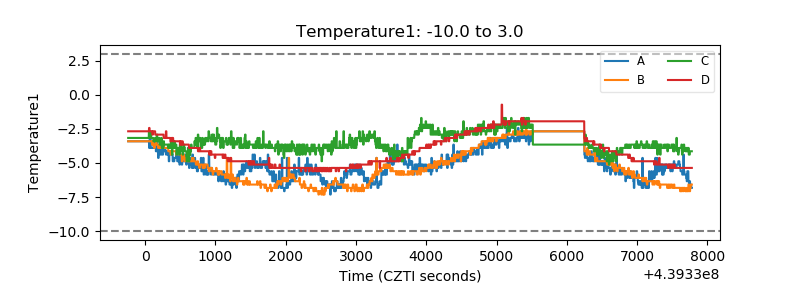 |
| Veto HV Monitor | 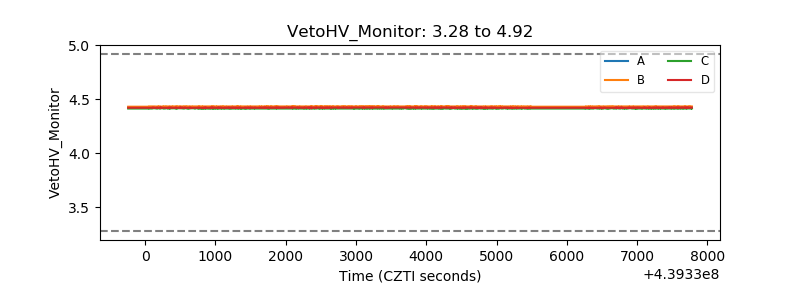 |
| Veto LLD | 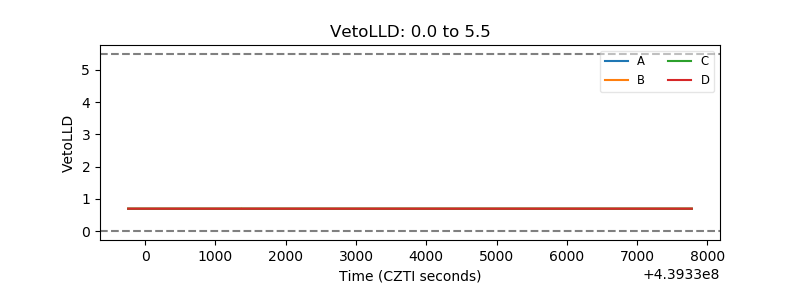 |
| Alpha Counter |  |
| _CPM_Rate | 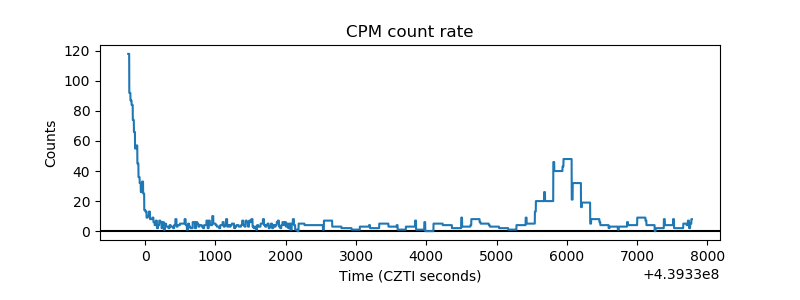 |
| CZT Counter | 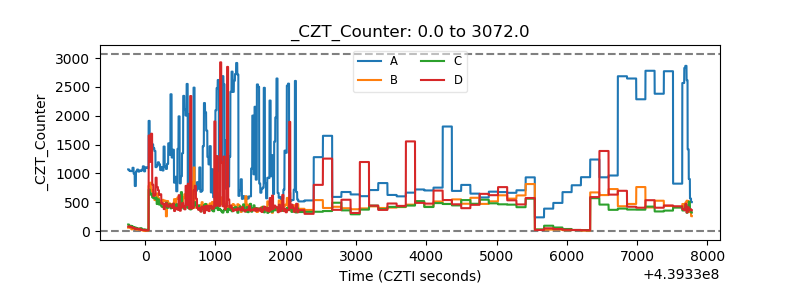 |
| +2.5 Volts monitor | 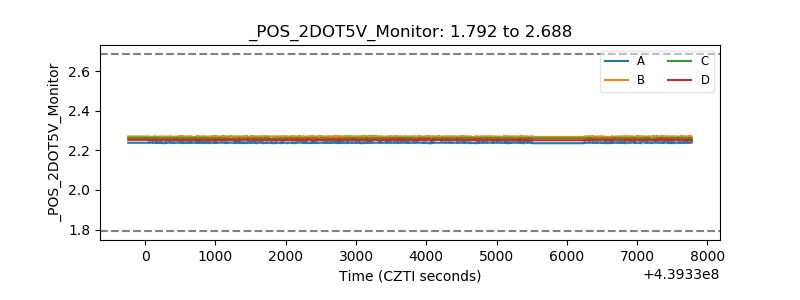 |
| +5 Volts monitor | 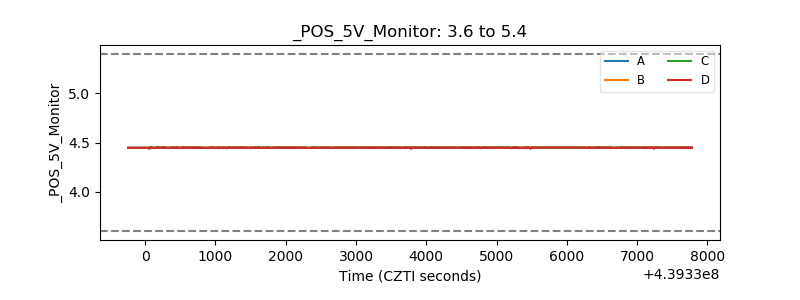 |
| _ROLL_ROT | 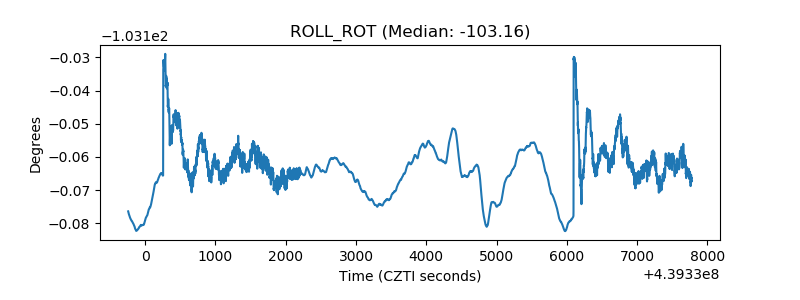 |
| _Roll_DEC | 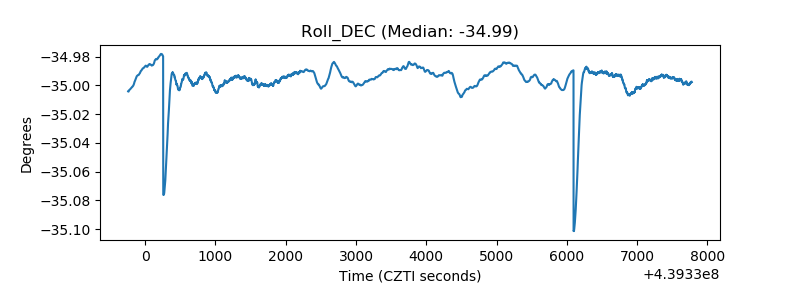 |
| _Roll_RA | 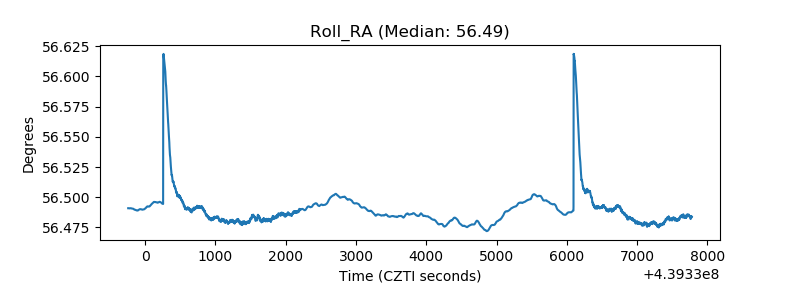 |
| Veto Counter | 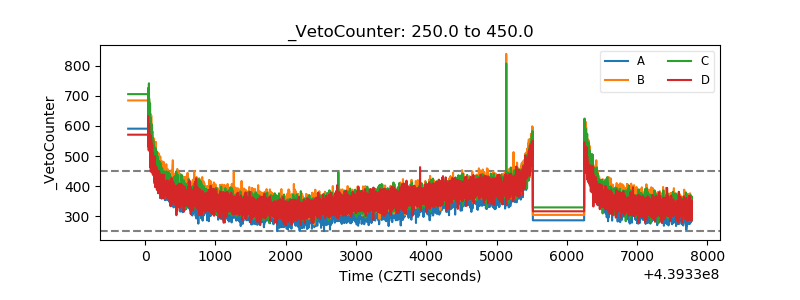 |