| Param | Original file | Final file |
|---|---|---|
| Filename | modeM0/AS1A13_079T01_9000005978_44246cztM0_level2.fits | modeM0/AS1A13_079T01_9000005978_44246cztM0_level2_quad_clean.evt |
| Size (bytes) | 850,541,760 | 104,172,480 |
| Size | 811.1 MB | 99.3 MB |
| Events in quadrant A | 16,683,076 | 232,679 |
| Events in quadrant B | 4,106,955 | 866,517 |
| Events in quadrant C | 3,488,144 | 822,674 |
| Events in quadrant D | 6,603,246 | 691,817 |
| Mode M0 | |||
|---|---|---|---|
| Quadrant | BADHDUFLAG | Total packets | Discarded packets |
| A | 0 | 54872 | 0 |
| B | 0 | 17548 | 0 |
| C | 0 | 16227 | 0 |
| D | 0 | 25088 | 1 |
| Mode SS | |||
|---|---|---|---|
| Quadrant | BADHDUFLAG | Total packets | Discarded packets |
| A | 0 | 156 | 0 |
| B | 0 | 156 | 0 |
| C | 0 | 156 | 0 |
| D | 0 | 156 | 0 |
| Quadrant | Total seconds | Saturated seconds | Saturation percentage |
|---|---|---|---|
| A | 7767 | 5853 | 75.357281% |
| B | 7767 | 92 | 1.184499% |
| C | 7767 | 41 | 0.527874% |
| D | 7767 | 918 | 11.819235% |
Noise dominated data is calculated using 1-second bins in cleaned event files. If a bin has >2000 counts, and if more than 50% of those come from <1% of pixels, then it is considered to be noise-dominated and hence unusable.
| Quadrant | # 1 sec bins | Bins with >0 counts | Bins with >2000 counts | High rate bins dominated by noise | Noise dominated (total time) | Noise dominated (detector-on time) | Marked lightcurve |
|---|---|---|---|---|---|---|---|
| A | 7766 | 7766 | 5148 | 5148 | 66.29% | 66.29% | 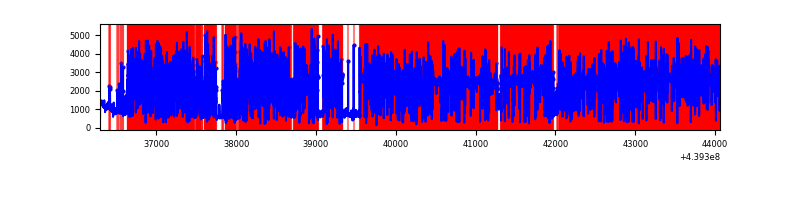 |
| B | 7767 | 7767 | 19 | 19 | 0.24% | 0.24% | 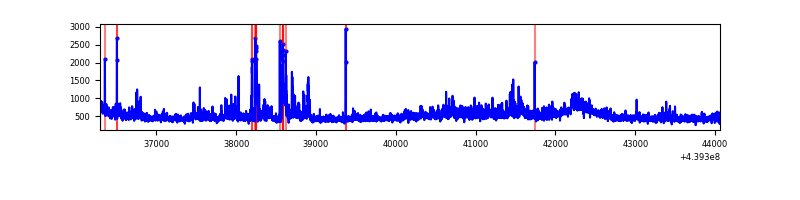 |
| C | 7767 | 7767 | 13 | 13 | 0.17% | 0.17% | 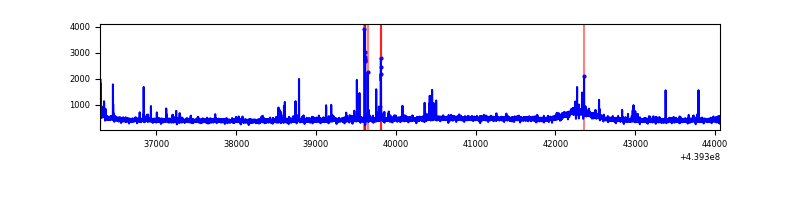 |
| D | 7767 | 7767 | 575 | 575 | 7.40% | 7.40% | 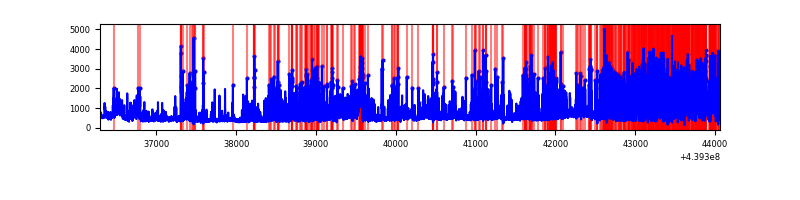 |
Top three noisy pixels from each quadrant. If the there are fewer than three noisy pixels in the level2.evt file, extra rows are filled as -1
| Pixel properties | Quadrant properties | ||||||
|---|---|---|---|---|---|---|---|
| Quadrant | DetID | PixID | Counts | Sigma | Mean | Median | Sigma |
| A | 15 | 223 | 14107099 | 156632.0 | 432 | 424 | 90.1 |
| A | 10 | 83 | 838280 | 9303.05 | 432 | 424 | 90.1 |
| A | 10 | 248 | 52863 | 582.25 | 432 | 424 | 90.1 |
| B | 0 | 219 | 174488 | 1011.07 | 867 | 838 | 171.7 |
| B | 0 | 155 | 147442 | 853.6 | 867 | 838 | 171.7 |
| B | 4 | 158 | 139422 | 806.9 | 867 | 838 | 171.7 |
| C | 14 | 254 | 136025 | 672.69 | 848 | 851 | 200.9 |
| C | 3 | 233 | 27419 | 132.21 | 848 | 851 | 200.9 |
| C | 2 | 14 | 8511 | 38.12 | 848 | 851 | 200.9 |
| D | 4 | 221 | 2434625 | 11880.76 | 810 | 784 | 204.9 |
| D | 13 | 249 | 547106 | 2666.86 | 810 | 784 | 204.9 |
| D | 8 | 240 | 151590 | 736.16 | 810 | 784 | 204.9 |
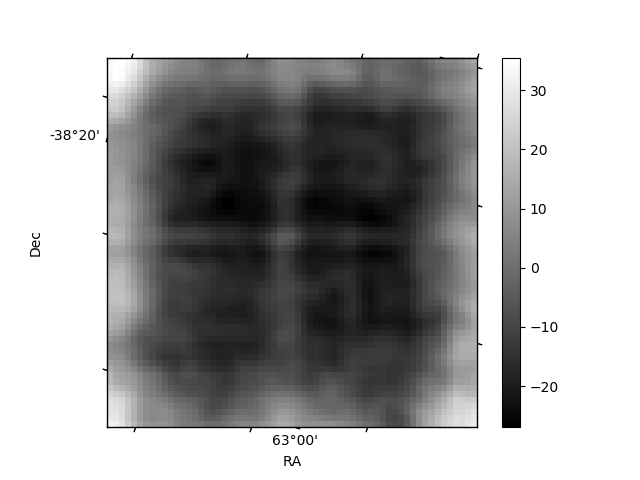
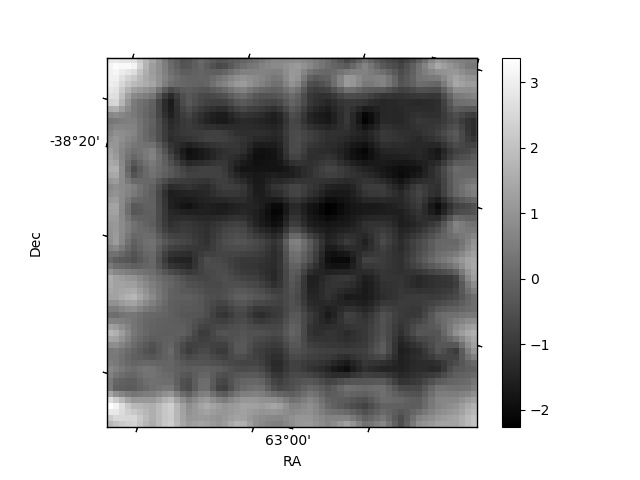
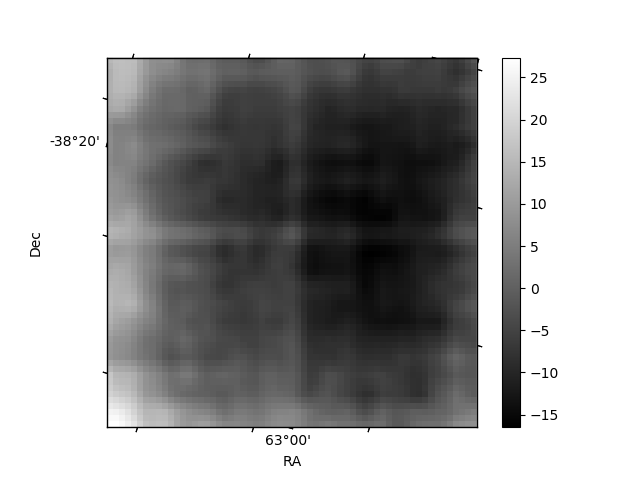
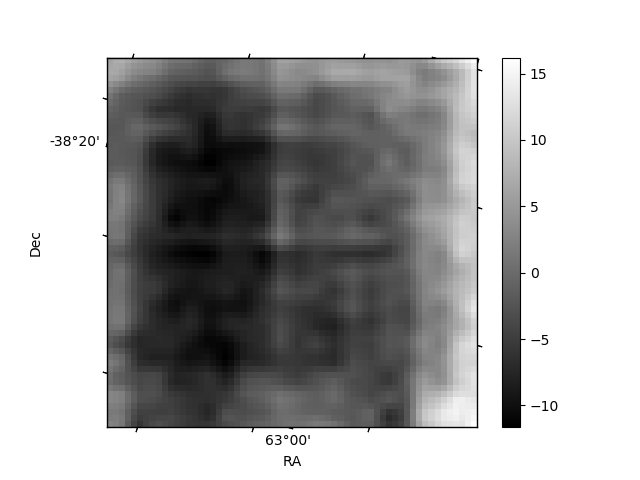
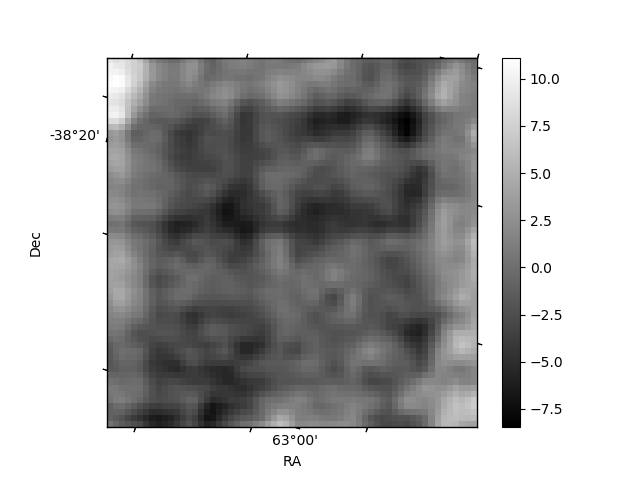
Histogram calculated using DETX and DETY for each event in the final _common_clean file
| Quadrant A | 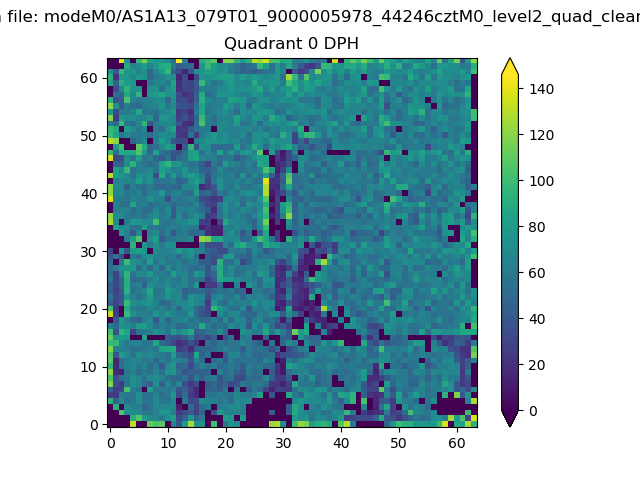 |
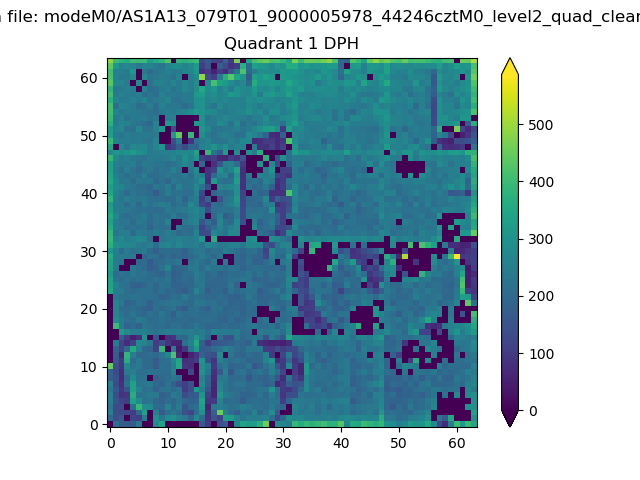 |
Quadrant B |
|---|---|---|---|
| Quadrant D | 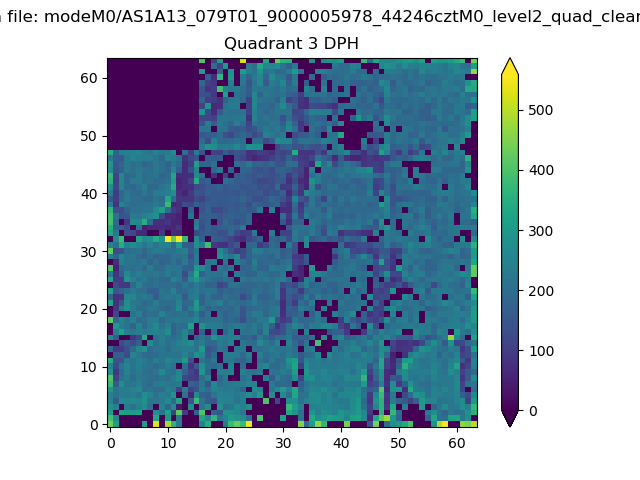 |
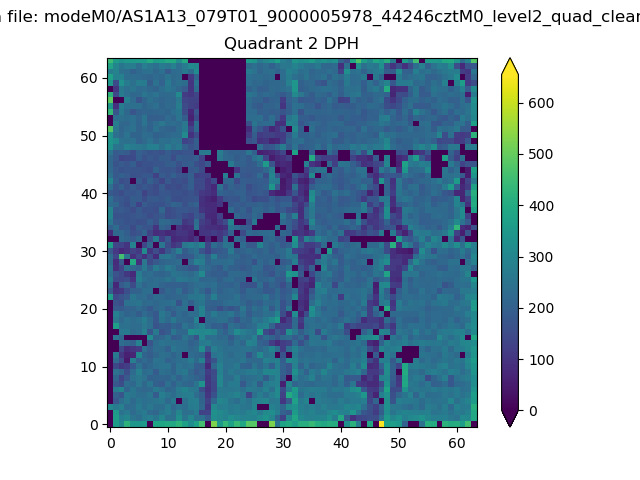 |
Quadrant C |
| Plot type | Count rate plots | Images |
|---|---|---|
| Comparison with Poisson distribution Blue bars denote a histogram of data divided into 1 sec bins. Red curve is a Poisson curve with rate = median count rate of data. |
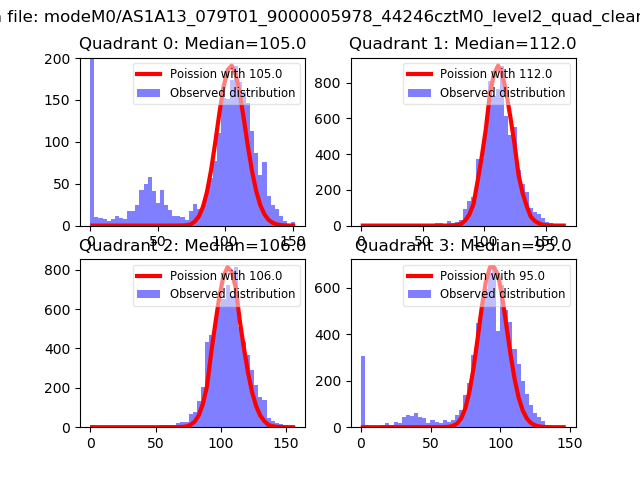 |
 |
| Quadrant-wise count rates Data is divided into 100 sec bins |
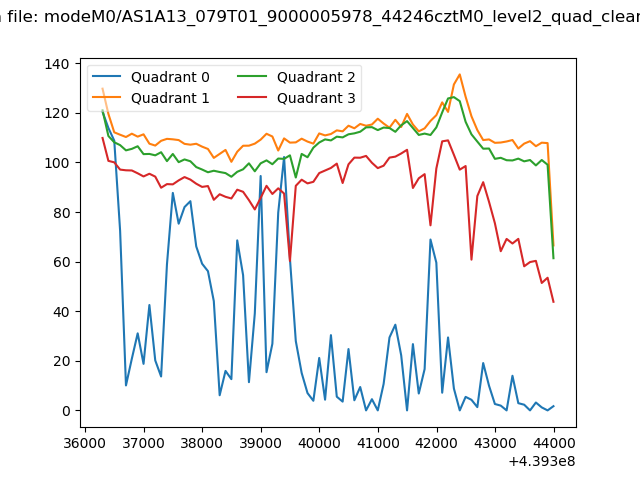 |
|
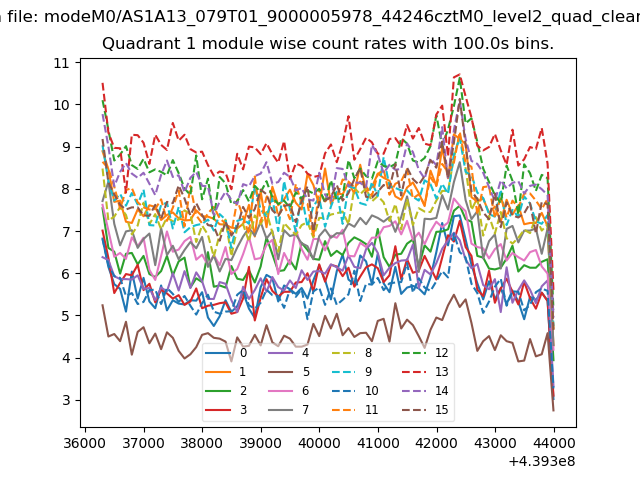
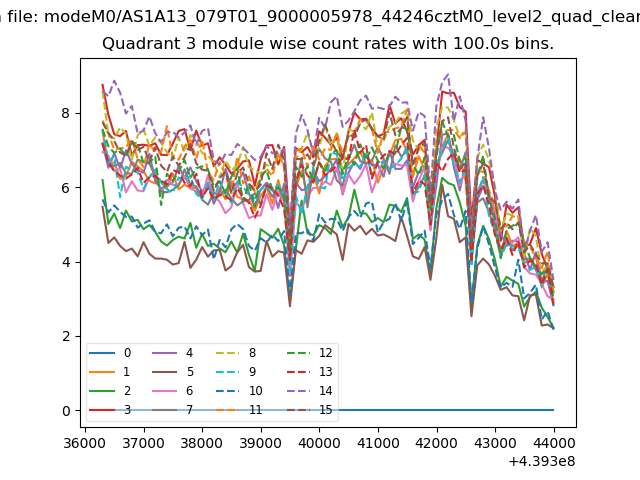
| Module-wise count rates for Quadrant A Data is divided into 100 sec bins |
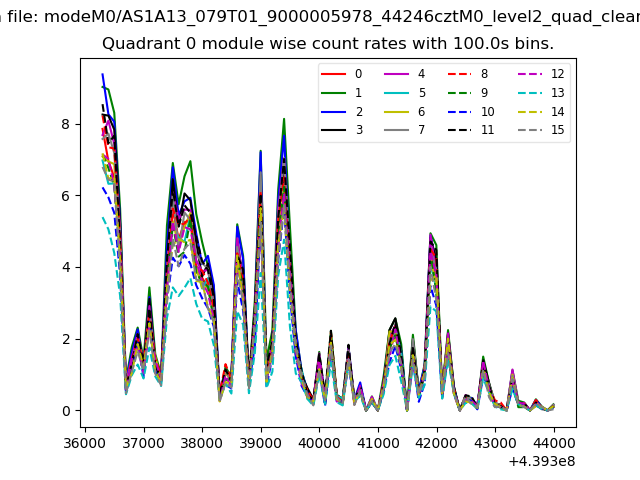 |
 |
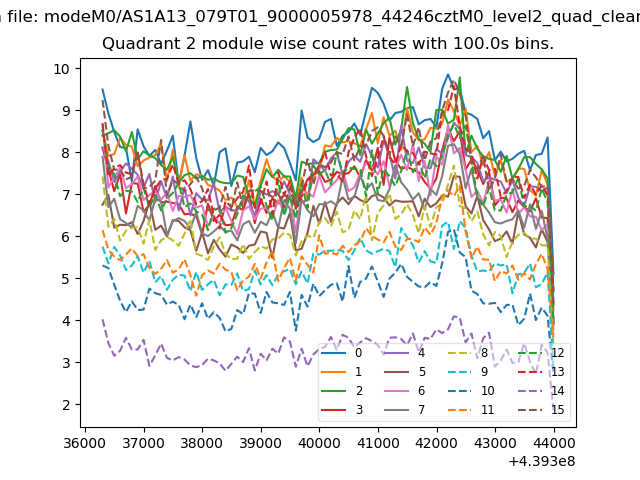
| Module-wise count rates for Quadrant B Data is divided into 100 sec bins |
 |
 |
| Module-wise count rates for Quadrant C Data is divided into 100 sec bins |
 |
 |
| Module-wise count rates for Quadrant D Data is divided into 100 sec bins |
 |
 |
| Parameter | Plot |
|---|---|
| CZT HV Monitor | 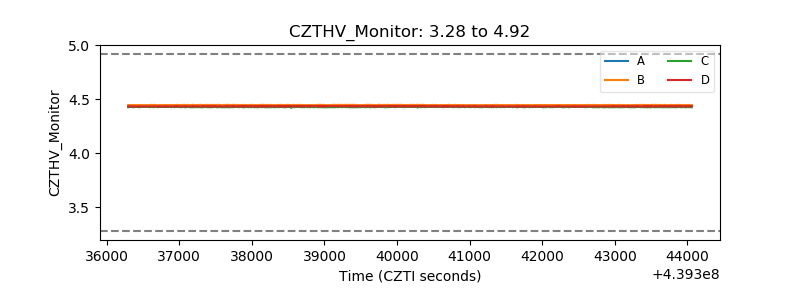 |
| D_VDD | 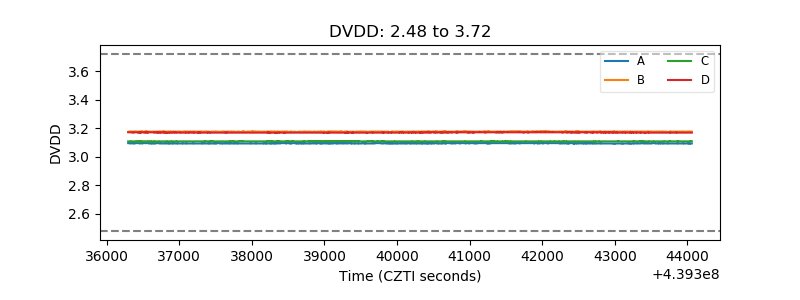 |
| Temperature 1 | 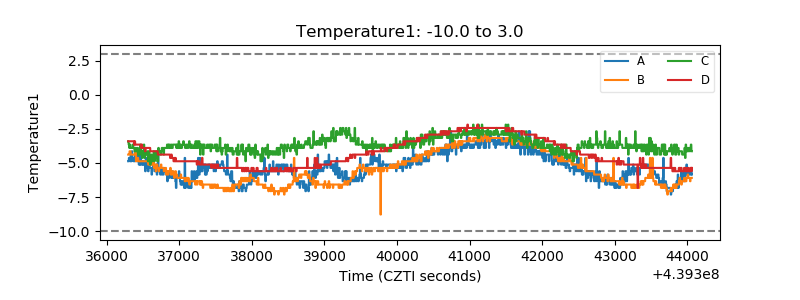 |
| Veto HV Monitor | 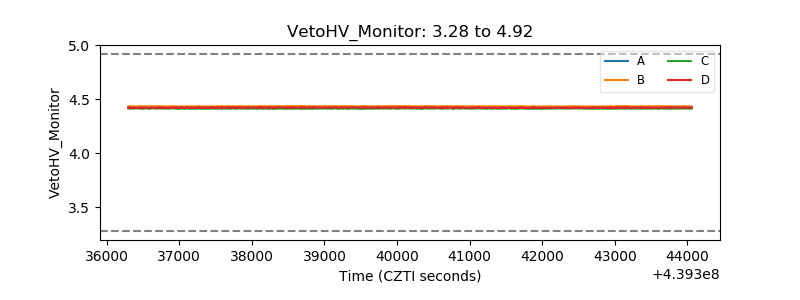 |
| Veto LLD | 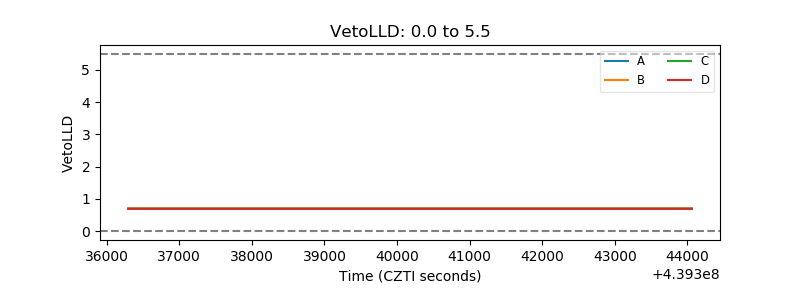 |
| Alpha Counter | 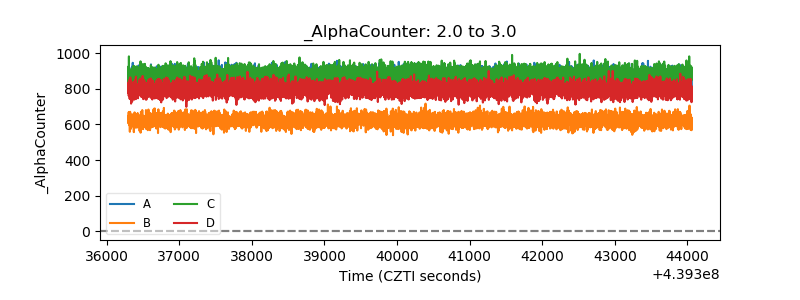 |
| _CPM_Rate | 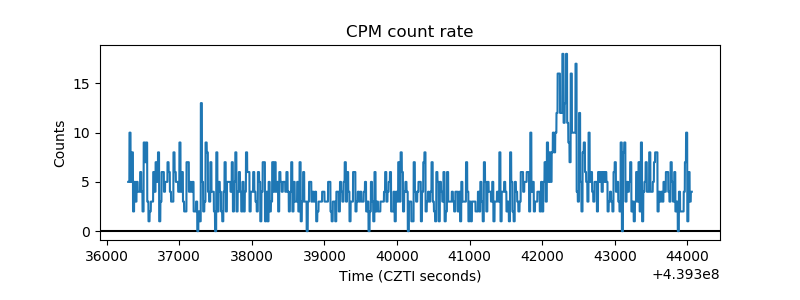 |
| CZT Counter | 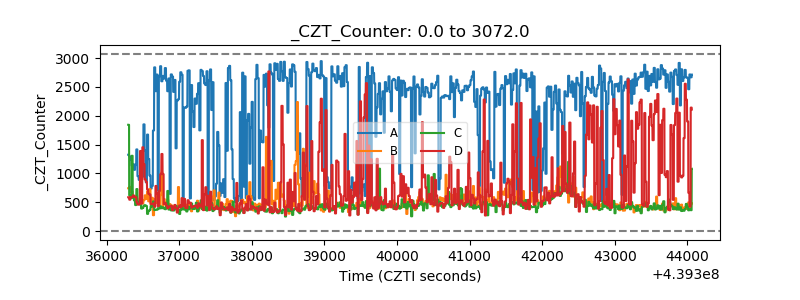 |
| +2.5 Volts monitor | 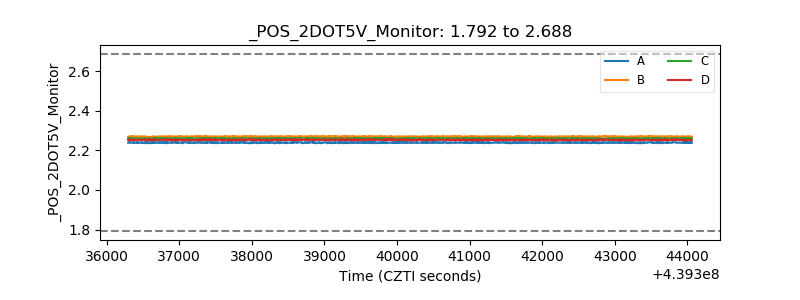 |
| +5 Volts monitor | 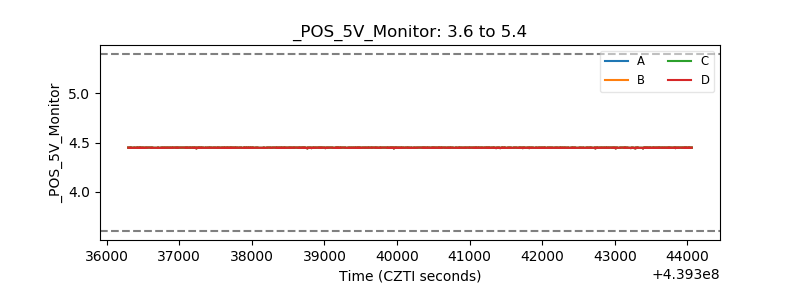 |
| _ROLL_ROT | 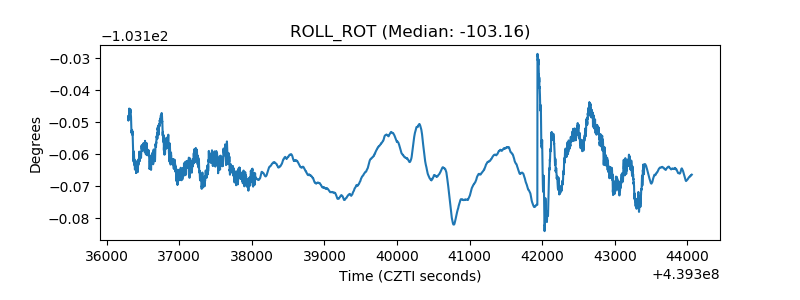 |
| _Roll_DEC | 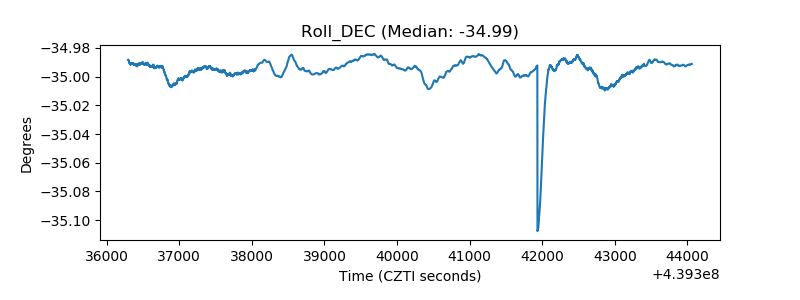 |
| _Roll_RA | 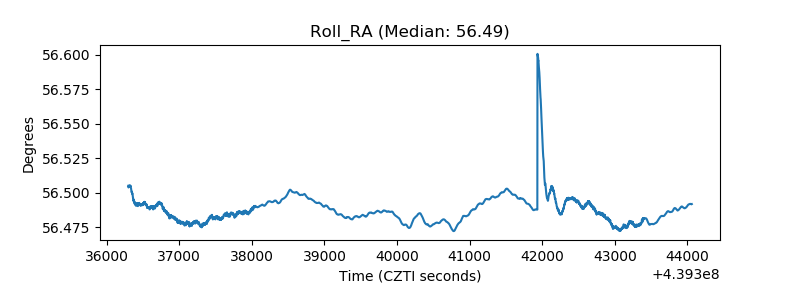 |
| Veto Counter | 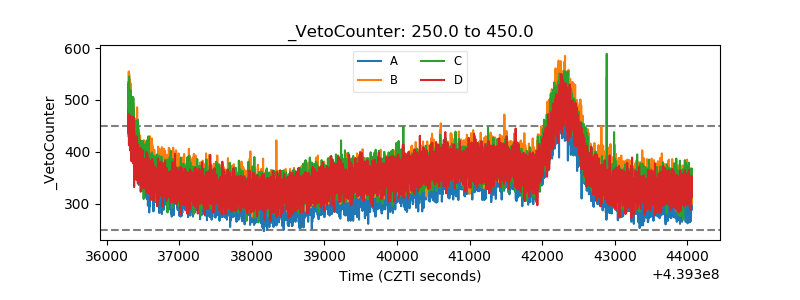 |