| Param | Original file | Final file |
|---|---|---|
| Filename | modeM0/AS1A13_079T01_9000005978_44247cztM0_level2.fits | modeM0/AS1A13_079T01_9000005978_44247cztM0_level2_quad_clean.evt |
| Size (bytes) | 913,135,680 | 90,008,640 |
| Size | 870.8 MB | 85.8 MB |
| Events in quadrant A | 17,685,763 | 83,199 |
| Events in quadrant B | 3,599,554 | 822,007 |
| Events in quadrant C | 3,486,272 | 772,231 |
| Events in quadrant D | 8,450,130 | 528,518 |
| Mode M0 | |||
|---|---|---|---|
| Quadrant | BADHDUFLAG | Total packets | Discarded packets |
| A | 0 | 57642 | 0 |
| B | 0 | 15885 | 0 |
| C | 0 | 15857 | 0 |
| D | 0 | 30328 | 0 |
| Mode SS | |||
|---|---|---|---|
| Quadrant | BADHDUFLAG | Total packets | Discarded packets |
| A | 0 | 148 | 0 |
| B | 0 | 148 | 0 |
| C | 0 | 148 | 0 |
| D | 0 | 148 | 0 |
| Quadrant | Total seconds | Saturated seconds | Saturation percentage |
|---|---|---|---|
| A | 7462 | 6772 | 90.753149% |
| B | 7462 | 19 | 0.254623% |
| C | 7462 | 29 | 0.388636% |
| D | 7462 | 2335 | 31.291879% |
Noise dominated data is calculated using 1-second bins in cleaned event files. If a bin has >2000 counts, and if more than 50% of those come from <1% of pixels, then it is considered to be noise-dominated and hence unusable.
| Quadrant | # 1 sec bins | Bins with >0 counts | Bins with >2000 counts | High rate bins dominated by noise | Noise dominated (total time) | Noise dominated (detector-on time) | Marked lightcurve |
|---|---|---|---|---|---|---|---|
| A | 7461 | 7461 | 6019 | 6019 | 80.67% | 80.67% | 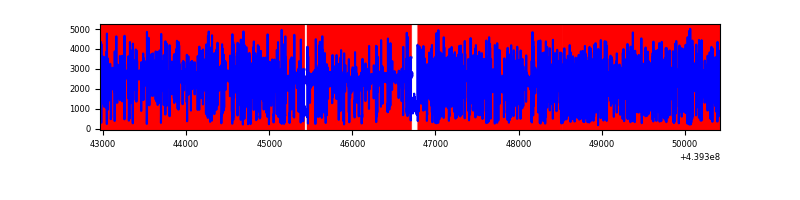 |
| B | 7462 | 7462 | 1 | 1 | 0.01% | 0.01% | 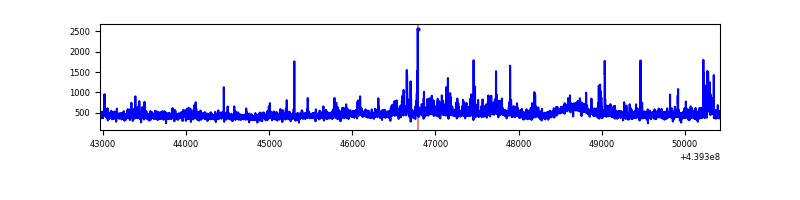 |
| C | 7462 | 7462 | 18 | 18 | 0.24% | 0.24% | 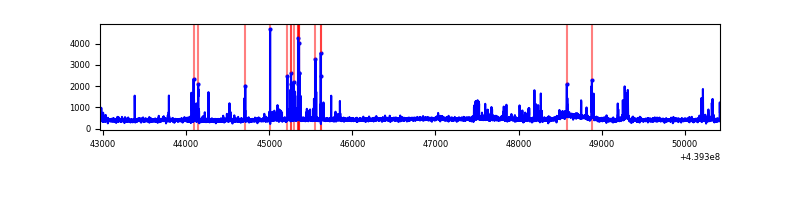 |
| D | 7462 | 7462 | 1146 | 1146 | 15.36% | 15.36% | 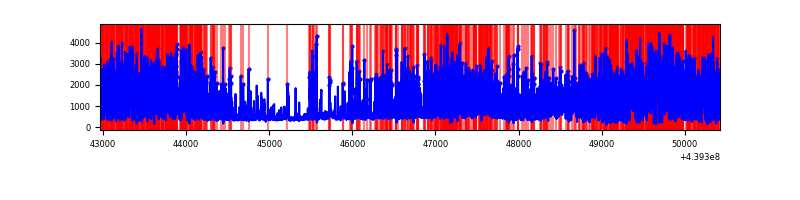 |
Top three noisy pixels from each quadrant. If the there are fewer than three noisy pixels in the level2.evt file, extra rows are filled as -1
| Pixel properties | Quadrant properties | ||||||
|---|---|---|---|---|---|---|---|
| Quadrant | DetID | PixID | Counts | Sigma | Mean | Median | Sigma |
| A | 15 | 223 | 16044273 | 265101.64 | 285 | 279 | 60.5 |
| A | 10 | 83 | 502706 | 8301.81 | 285 | 279 | 60.5 |
| A | 10 | 248 | 27398 | 448.1 | 285 | 279 | 60.5 |
| B | 4 | 173 | 193456 | 1188.88 | 814 | 786 | 162.1 |
| B | 4 | 158 | 81331 | 497.01 | 814 | 786 | 162.1 |
| B | 0 | 155 | 25390 | 151.82 | 814 | 786 | 162.1 |
| C | 14 | 254 | 297092 | 1570.53 | 797 | 800 | 188.7 |
| C | 14 | 220 | 45082 | 234.72 | 797 | 800 | 188.7 |
| C | 3 | 233 | 21099 | 107.6 | 797 | 800 | 188.7 |
| D | 4 | 221 | 4847188 | 28181.99 | 680 | 660 | 172.0 |
| D | 13 | 249 | 640328 | 3719.59 | 680 | 660 | 172.0 |
| D | 5 | 222 | 100796 | 582.28 | 680 | 660 | 172.0 |
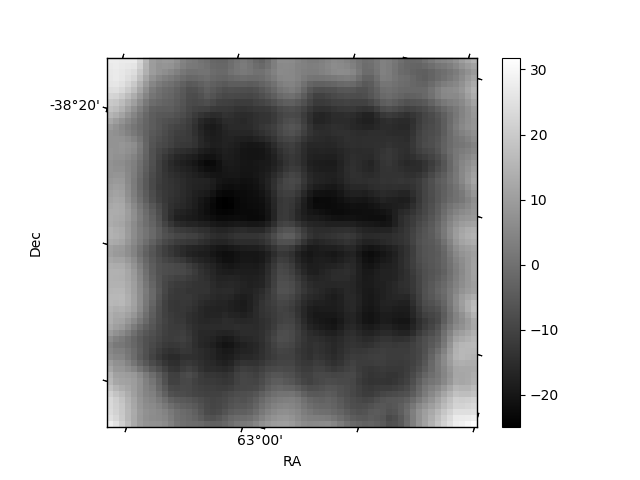
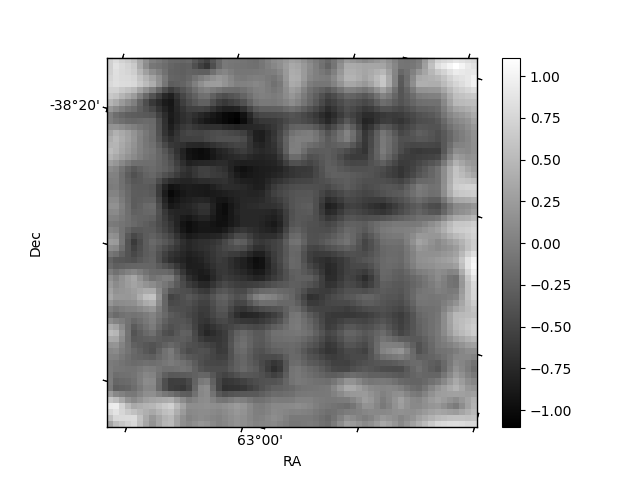
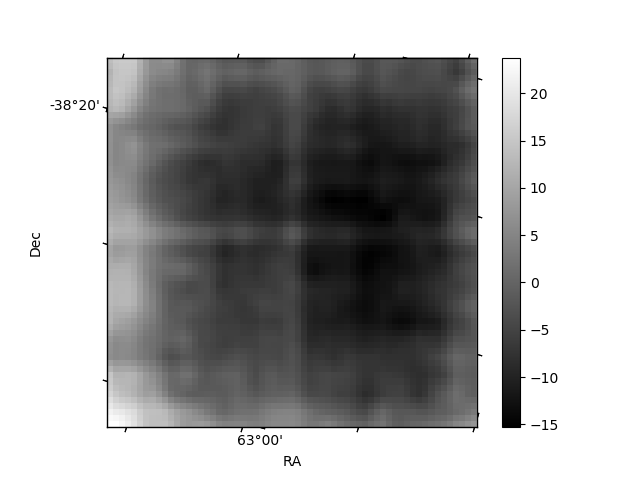
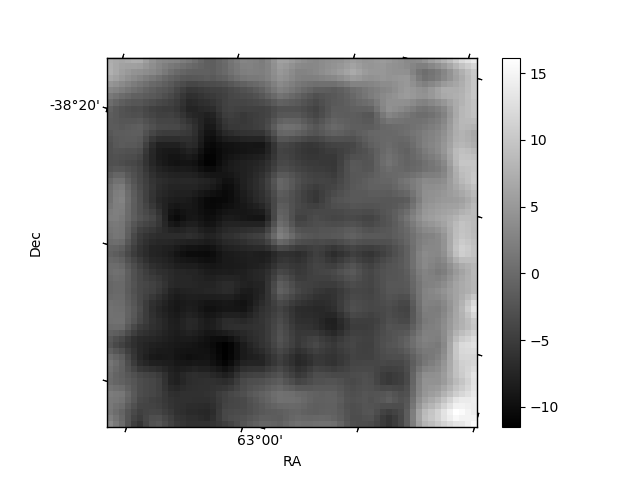
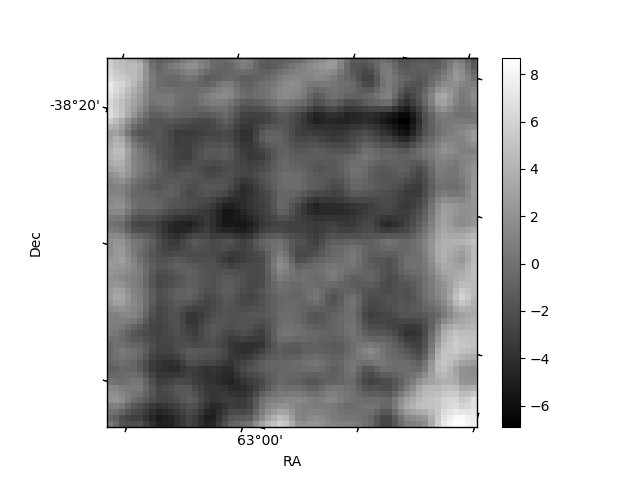
Histogram calculated using DETX and DETY for each event in the final _common_clean file
| Quadrant A | 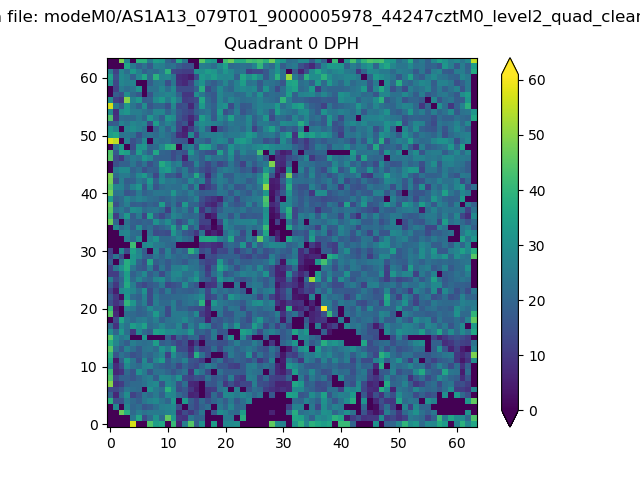 |
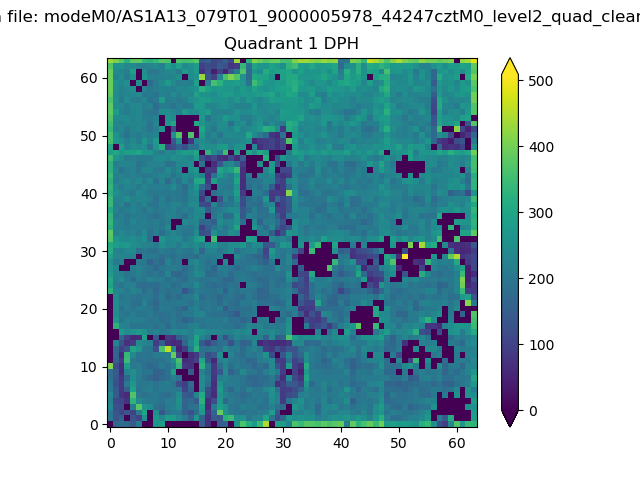 |
Quadrant B |
|---|---|---|---|
| Quadrant D | 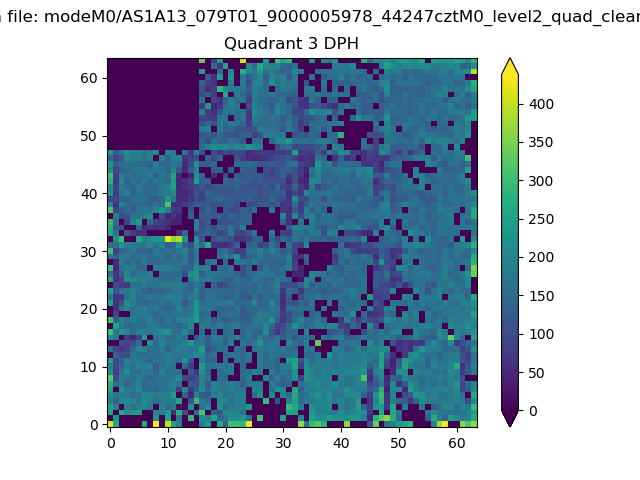 |
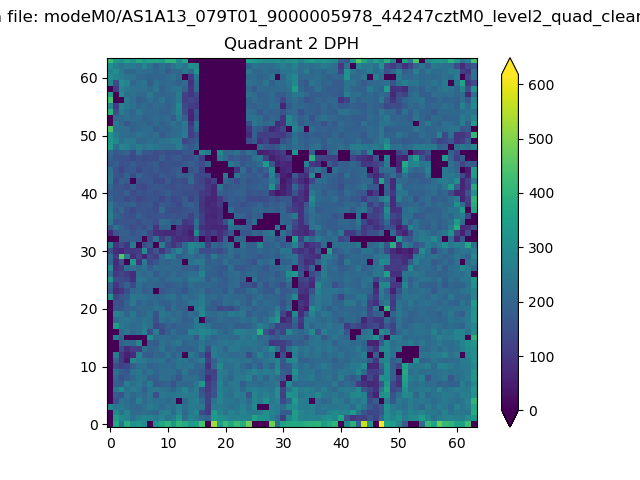 |
Quadrant C |
| Plot type | Count rate plots | Images |
|---|---|---|
| Comparison with Poisson distribution Blue bars denote a histogram of data divided into 1 sec bins. Red curve is a Poisson curve with rate = median count rate of data. |
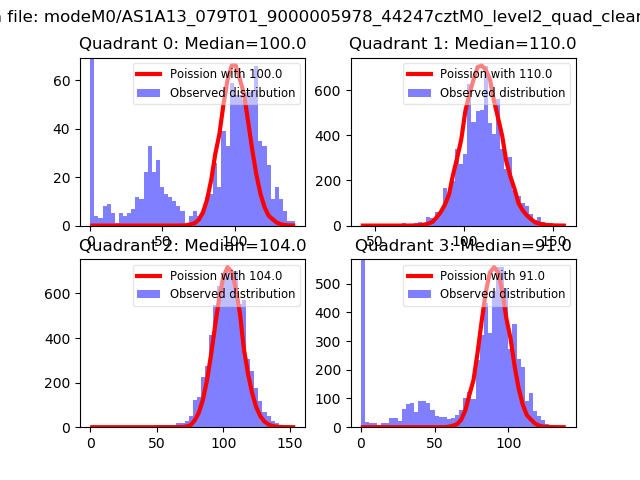 |
 |
| Quadrant-wise count rates Data is divided into 100 sec bins |
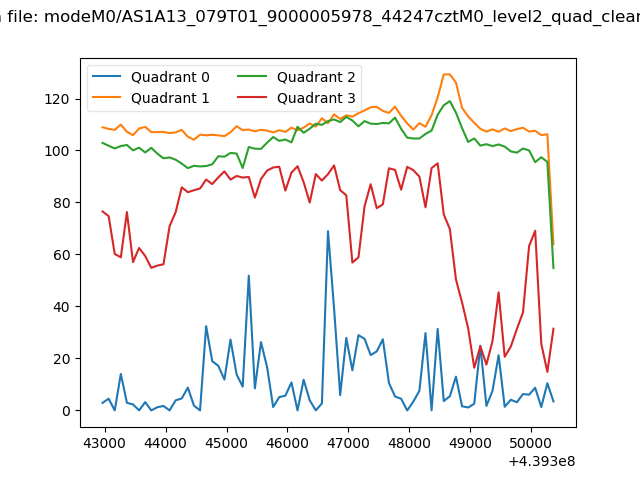 |
|
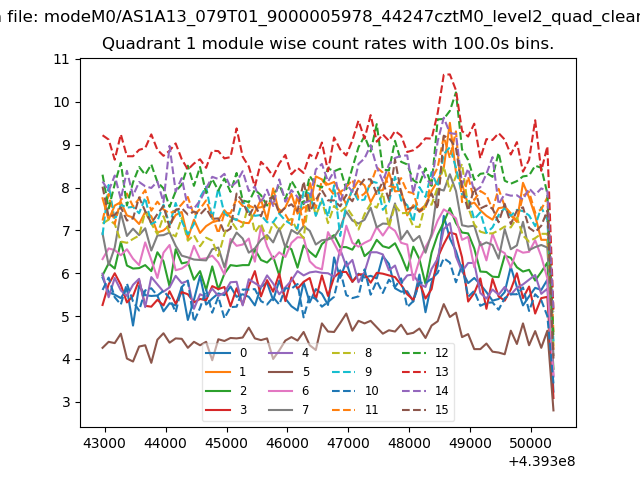
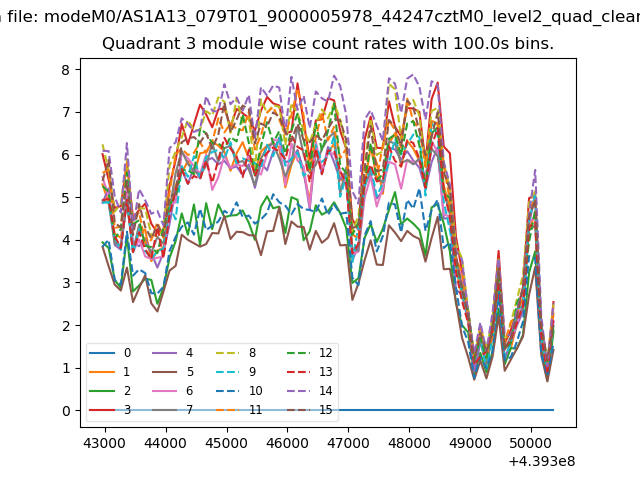
| Module-wise count rates for Quadrant A Data is divided into 100 sec bins |
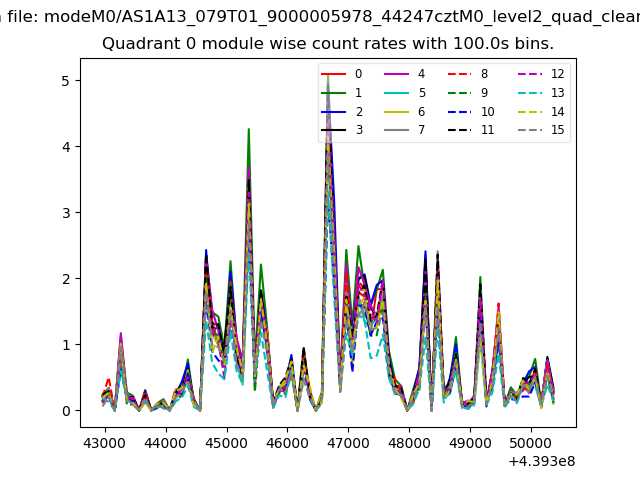 |
 |
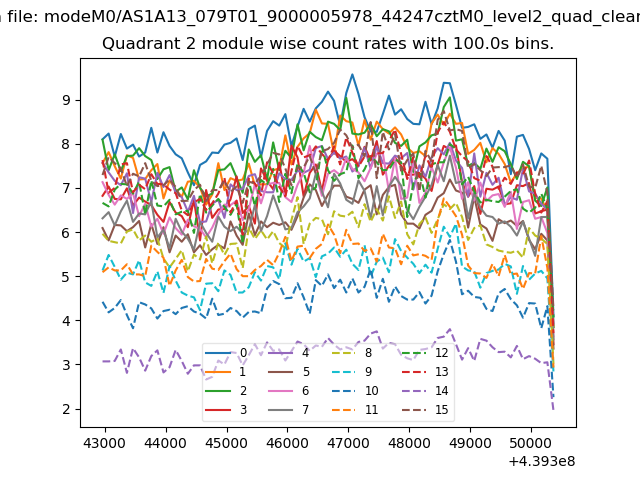
| Module-wise count rates for Quadrant B Data is divided into 100 sec bins |
 |
 |
| Module-wise count rates for Quadrant C Data is divided into 100 sec bins |
 |
 |
| Module-wise count rates for Quadrant D Data is divided into 100 sec bins |
 |
 |
| Parameter | Plot |
|---|---|
| CZT HV Monitor | 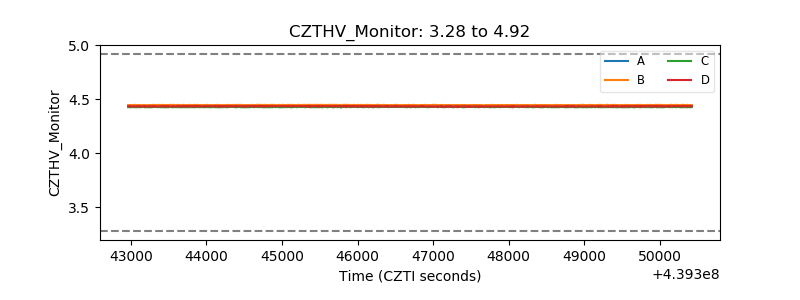 |
| D_VDD | 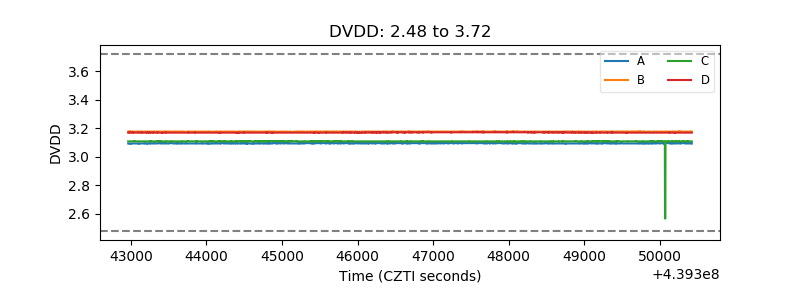 |
| Temperature 1 | 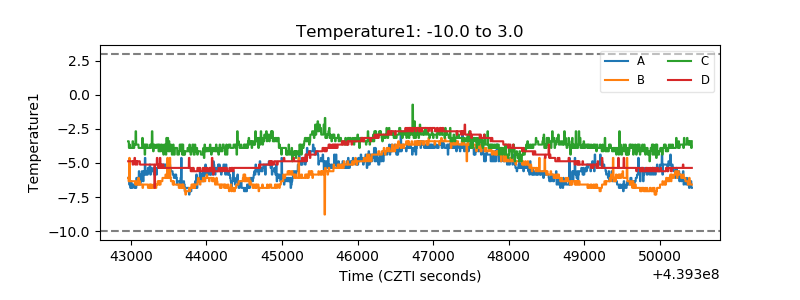 |
| Veto HV Monitor | 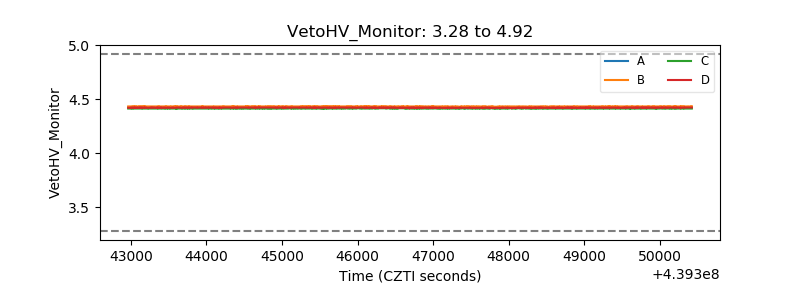 |
| Veto LLD | 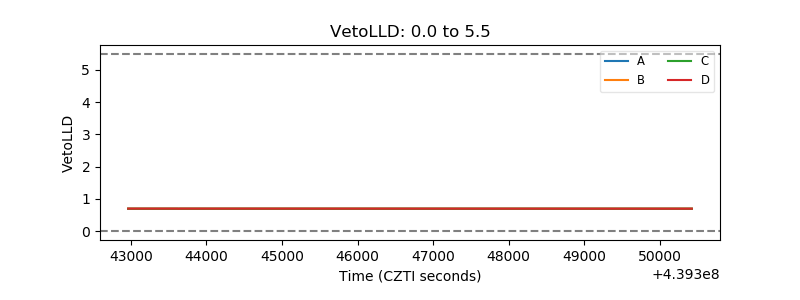 |
| Alpha Counter | 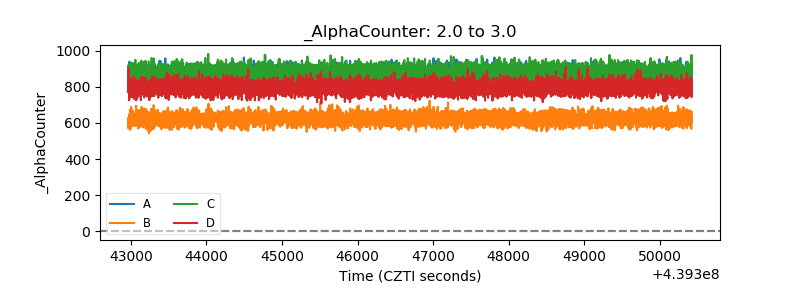 |
| _CPM_Rate | 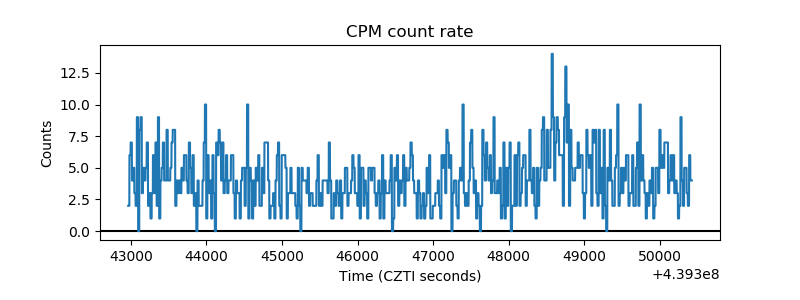 |
| CZT Counter | 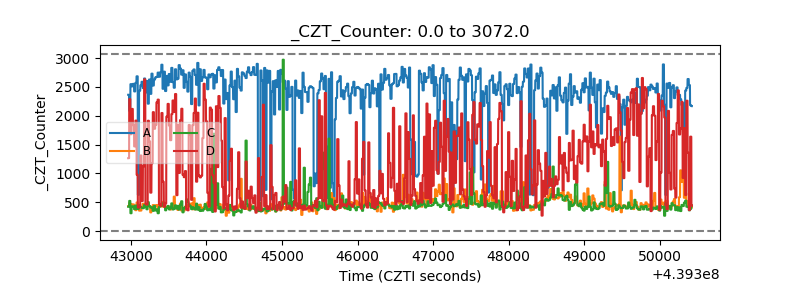 |
| +2.5 Volts monitor | 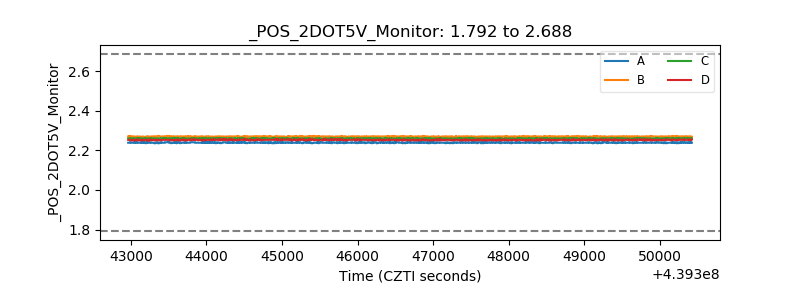 |
| +5 Volts monitor | 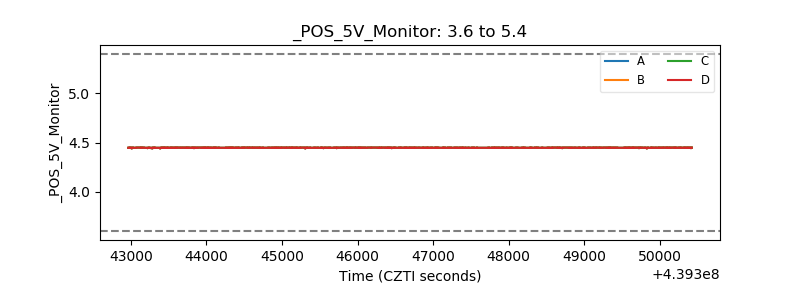 |
| _ROLL_ROT | 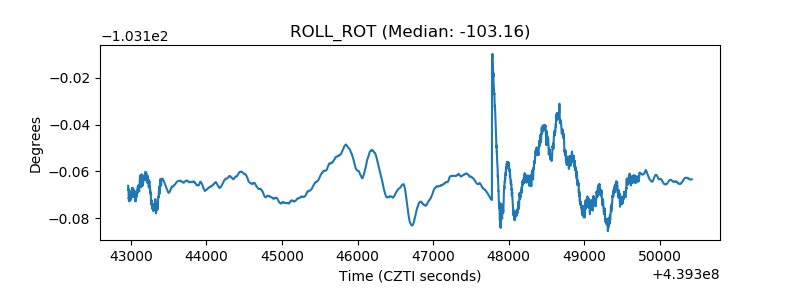 |
| _Roll_DEC | 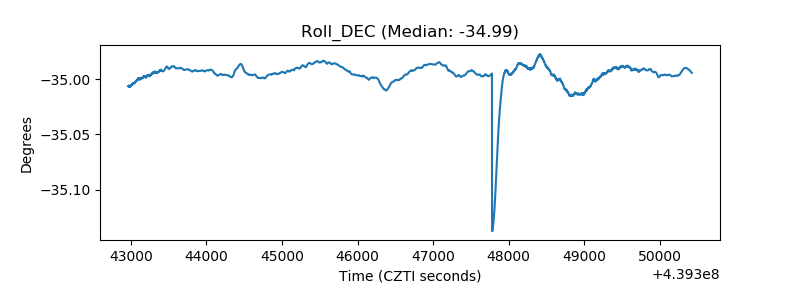 |
| _Roll_RA | 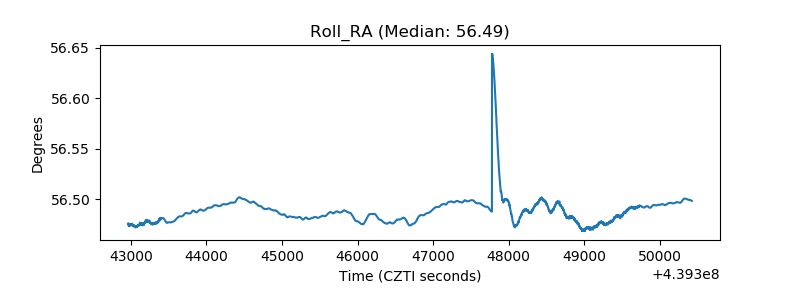 |
| Veto Counter | 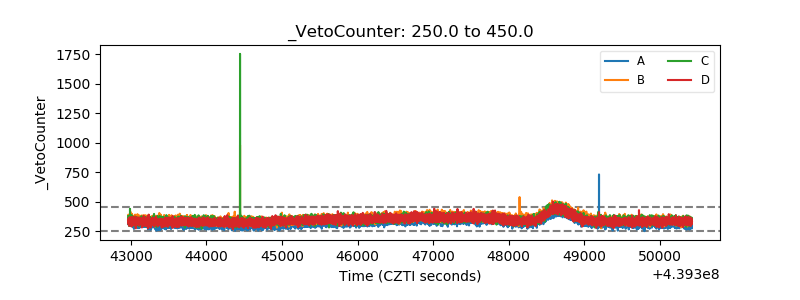 |