| Param | Original file | Final file |
|---|---|---|
| Filename | modeM0/AS1A13_079T01_9000005978_44251cztM0_level2.fits | modeM0/AS1A13_079T01_9000005978_44251cztM0_level2_quad_clean.evt |
| Size (bytes) | 727,462,080 | 87,022,080 |
| Size | 693.8 MB | 83.0 MB |
| Events in quadrant A | 13,503,654 | 194,390 |
| Events in quadrant B | 3,425,044 | 734,801 |
| Events in quadrant C | 3,232,922 | 708,348 |
| Events in quadrant D | 6,242,918 | 527,323 |
| Mode M0 | |||
|---|---|---|---|
| Quadrant | BADHDUFLAG | Total packets | Discarded packets |
| A | 0 | 48292 | 3743 |
| B | 0 | 15371 | 590 |
| C | 0 | 15144 | 604 |
| D | 0 | 24257 | 1177 |
| Mode SS | |||
|---|---|---|---|
| Quadrant | BADHDUFLAG | Total packets | Discarded packets |
| A | 0 | 144 | 4 |
| B | 0 | 144 | 2 |
| C | 0 | 144 | 4 |
| D | 0 | 144 | 8 |
| Mode M9 | |||
|---|---|---|---|
| Quadrant | BADHDUFLAG | Total packets | Discarded packets |
| A | 0 | 7 | 0 |
| B | 0 | 7 | 0 |
| C | 0 | 7 | 0 |
| D | 0 | 7 | 1 |
| Quadrant | Total seconds | Saturated seconds | Saturation percentage |
|---|---|---|---|
| A | 6527 | 5086 | 77.922476% |
| B | 6813 | 159 | 2.333774% |
| C | 6817 | 99 | 1.452252% |
| D | 6753 | 1410 | 20.879609% |
Noise dominated data is calculated using 1-second bins in cleaned event files. If a bin has >2000 counts, and if more than 50% of those come from <1% of pixels, then it is considered to be noise-dominated and hence unusable.
| Quadrant | # 1 sec bins | Bins with >0 counts | Bins with >2000 counts | High rate bins dominated by noise | Noise dominated (total time) | Noise dominated (detector-on time) | Marked lightcurve |
|---|---|---|---|---|---|---|---|
| A | 7782 | 6738 | 3622 | 3622 | 46.54% | 53.75% | 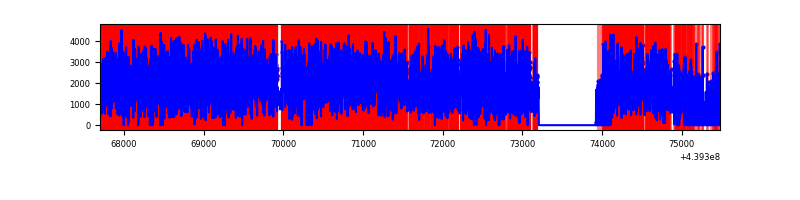 |
| B | 7782 | 6984 | 46 | 46 | 0.59% | 0.66% | 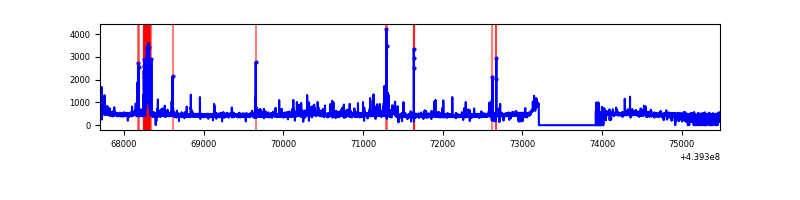 |
| C | 7782 | 6995 | 22 | 22 | 0.28% | 0.31% | 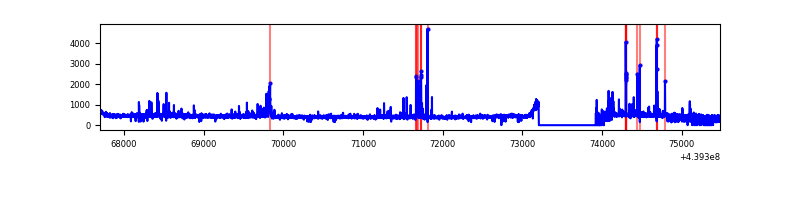 |
| D | 7783 | 6958 | 731 | 731 | 9.39% | 10.51% | 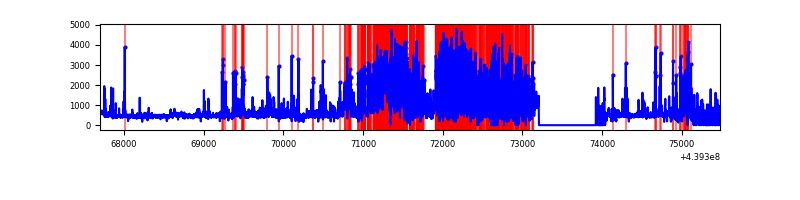 |
Top three noisy pixels from each quadrant. If the there are fewer than three noisy pixels in the level2.evt file, extra rows are filled as -1
| Pixel properties | Quadrant properties | ||||||
|---|---|---|---|---|---|---|---|
| Quadrant | DetID | PixID | Counts | Sigma | Mean | Median | Sigma |
| A | 15 | 223 | 10742977 | 111037.56 | 460 | 447 | 96.7 |
| A | 10 | 83 | 856634 | 8849.77 | 460 | 447 | 96.7 |
| A | 7 | 3 | 87694 | 901.81 | 460 | 447 | 96.7 |
| B | 4 | 158 | 208260 | 1384.31 | 756 | 732 | 149.9 |
| B | 4 | 170 | 66166 | 436.48 | 756 | 732 | 149.9 |
| B | 4 | 173 | 43647 | 286.26 | 756 | 732 | 149.9 |
| C | 14 | 254 | 261792 | 1451.67 | 755 | 759 | 179.8 |
| C | 3 | 233 | 14497 | 76.4 | 755 | 759 | 179.8 |
| C | 2 | 14 | 8624 | 43.74 | 755 | 759 | 179.8 |
| D | 4 | 221 | 1662627 | 9781.62 | 675 | 655 | 169.9 |
| D | 5 | 222 | 868201 | 5105.99 | 675 | 655 | 169.9 |
| D | 13 | 249 | 611435 | 3594.78 | 675 | 655 | 169.9 |
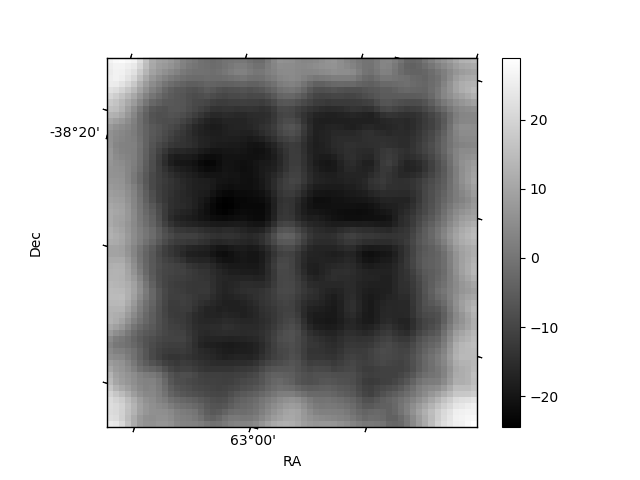
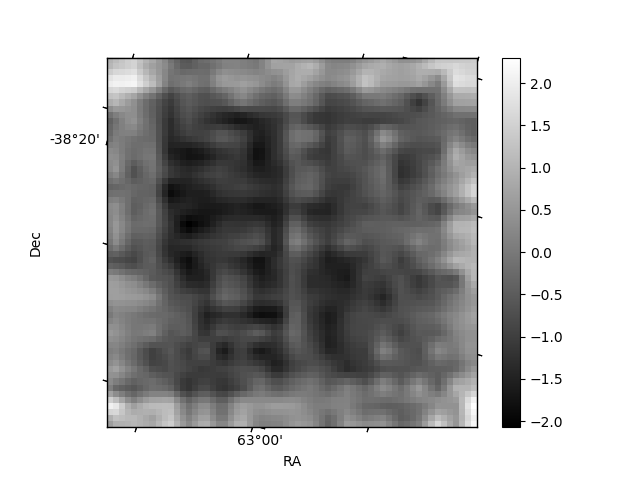
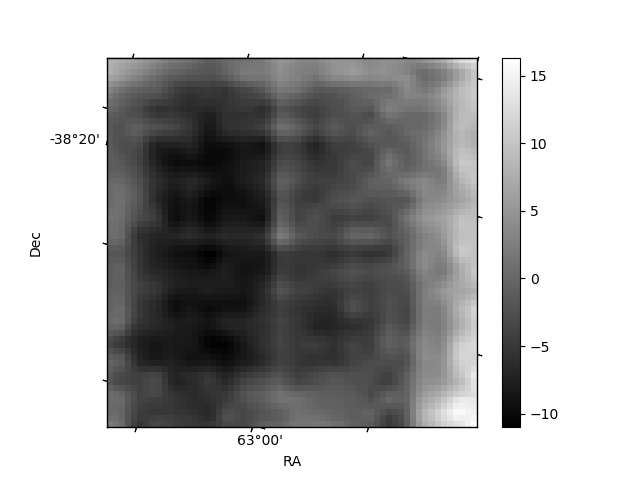
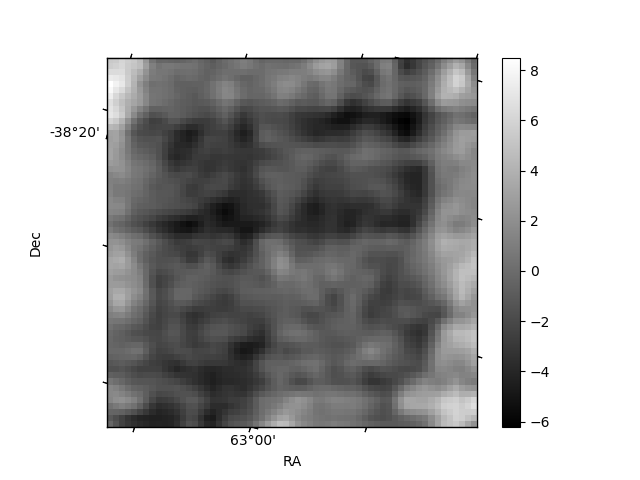
Histogram calculated using DETX and DETY for each event in the final _common_clean file
| Quadrant A | 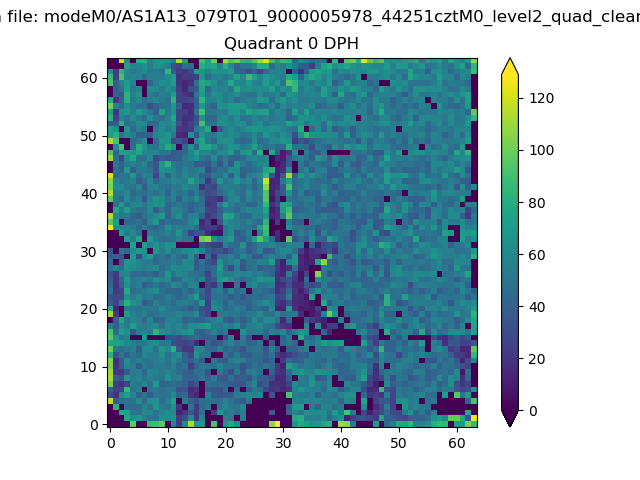 |
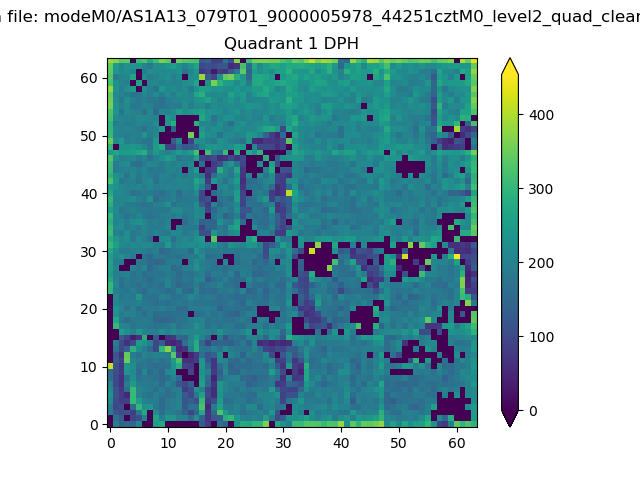 |
Quadrant B |
|---|---|---|---|
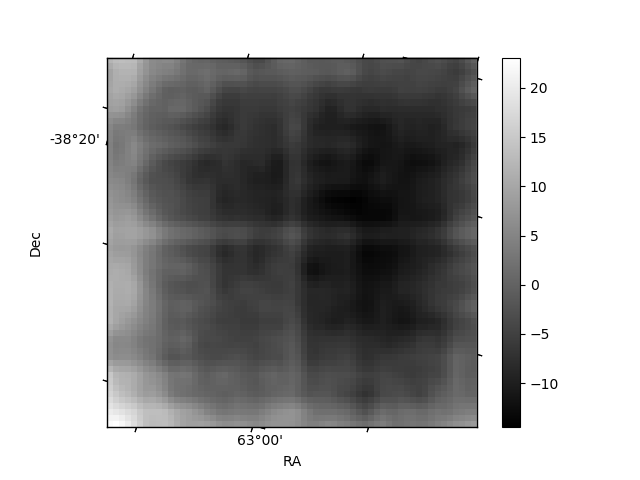
| Quadrant D | 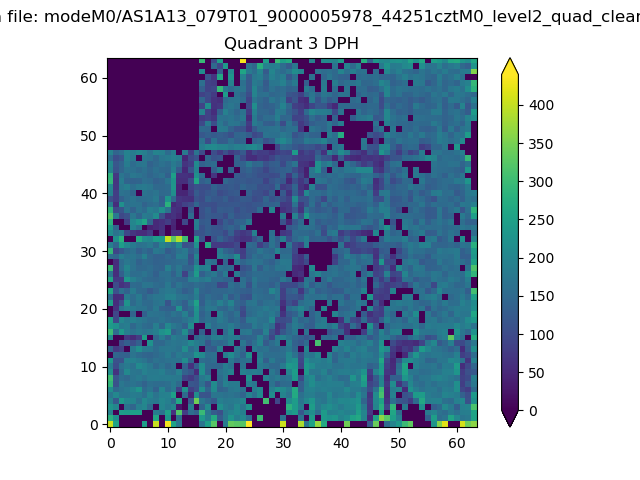 |
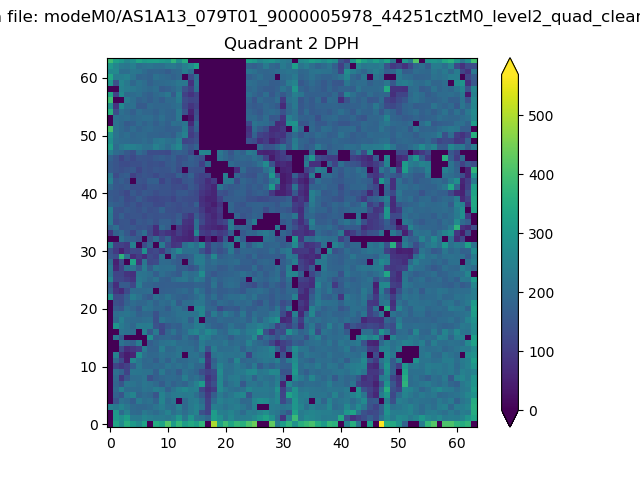 |
Quadrant C |
| Plot type | Count rate plots | Images |
|---|---|---|
| Comparison with Poisson distribution Blue bars denote a histogram of data divided into 1 sec bins. Red curve is a Poisson curve with rate = median count rate of data. |
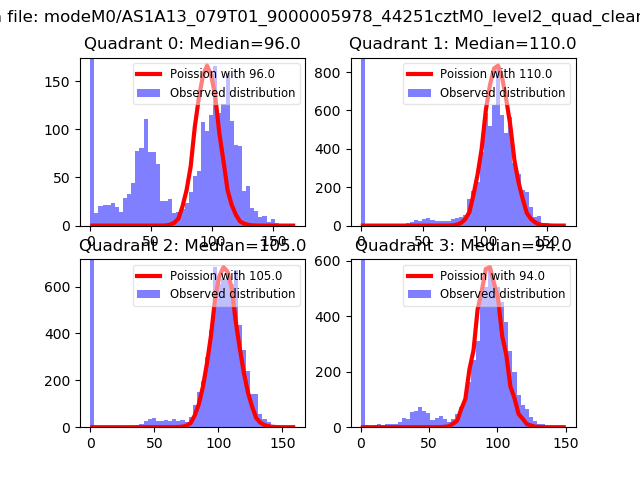 |
 |
| Quadrant-wise count rates Data is divided into 100 sec bins |
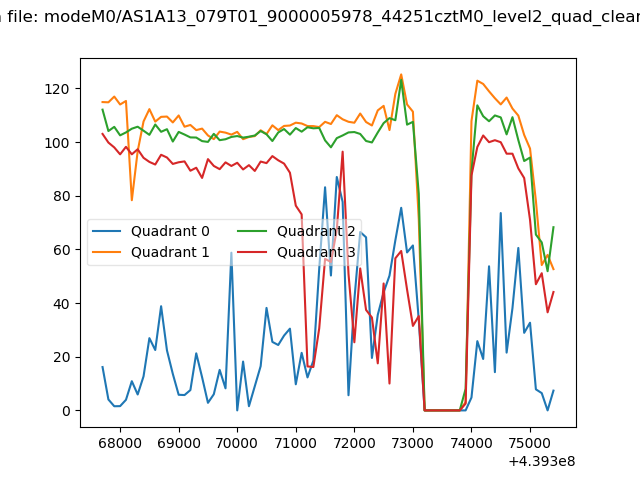 |
|
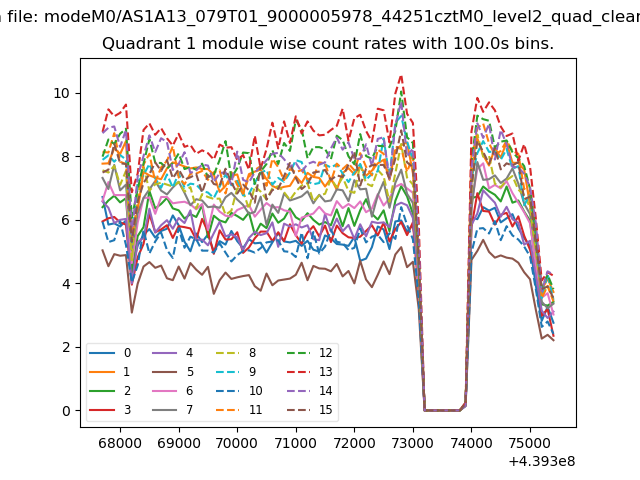
| Module-wise count rates for Quadrant A Data is divided into 100 sec bins |
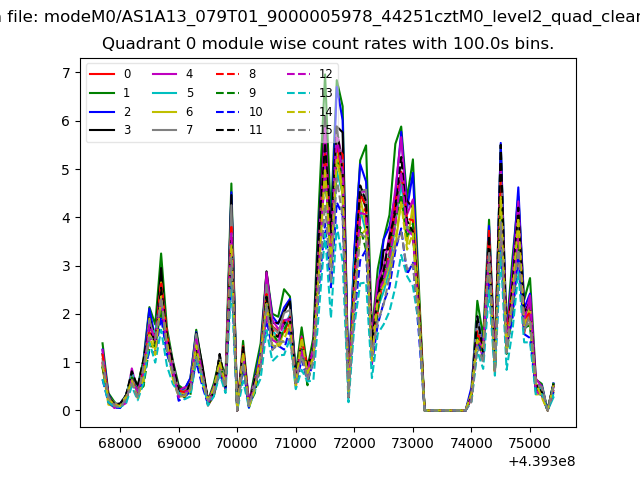 |
 |
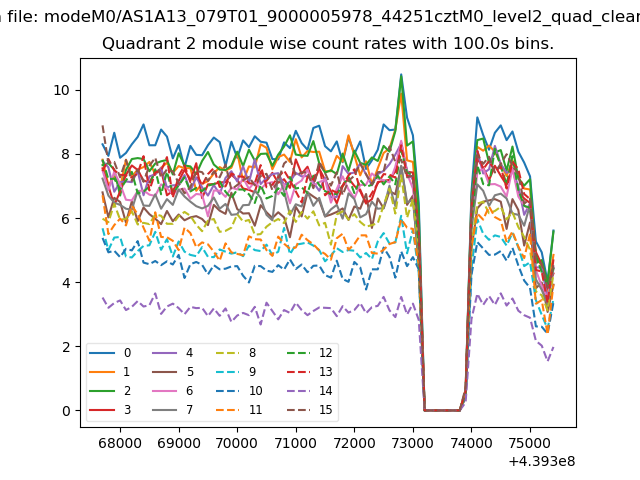
| Module-wise count rates for Quadrant B Data is divided into 100 sec bins |
 |
 |
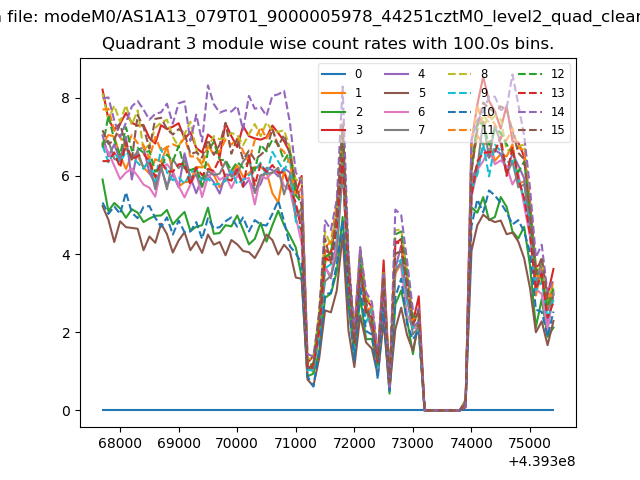
| Module-wise count rates for Quadrant C Data is divided into 100 sec bins |
 |
 |
| Module-wise count rates for Quadrant D Data is divided into 100 sec bins |
 |
 |
| Parameter | Plot |
|---|---|
| CZT HV Monitor | 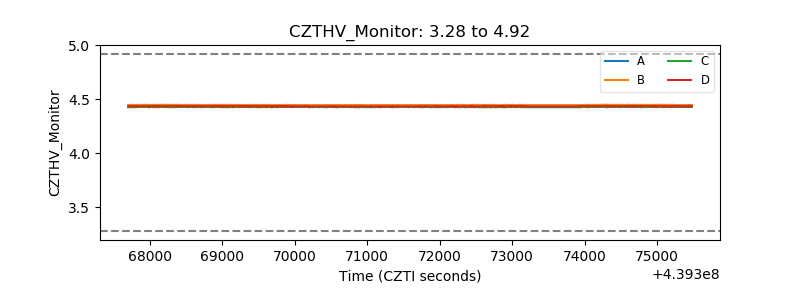 |
| D_VDD | 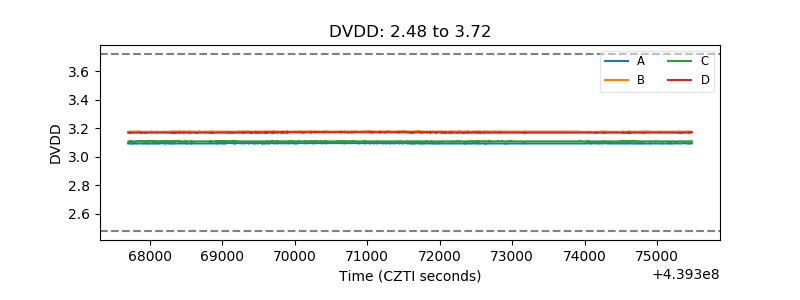 |
| Temperature 1 | 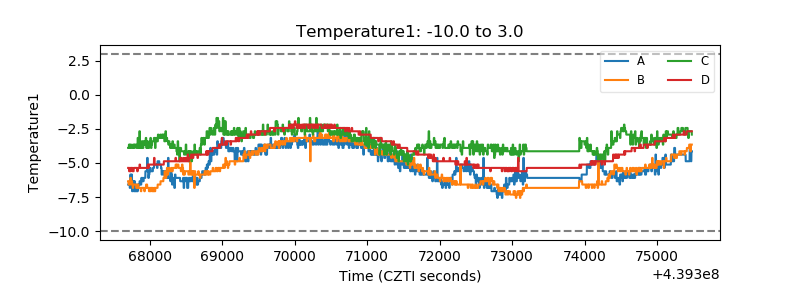 |
| Veto HV Monitor | 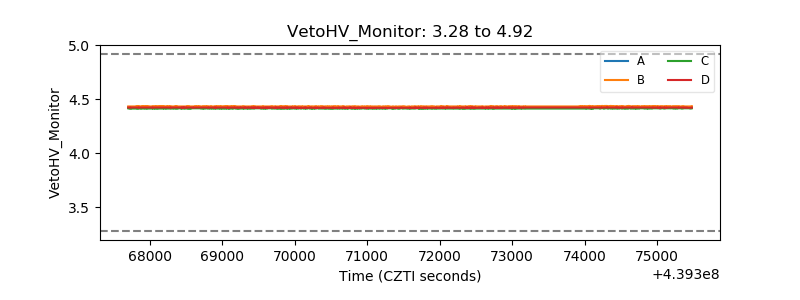 |
| Veto LLD | 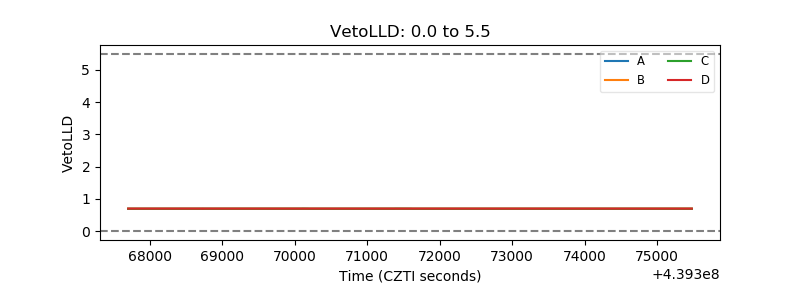 |
| Alpha Counter | 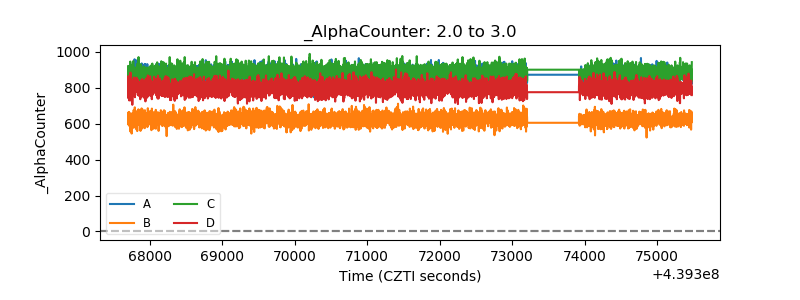 |
| _CPM_Rate | 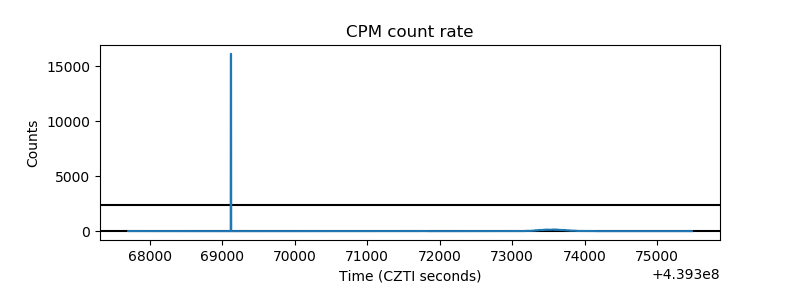 |
| CZT Counter | 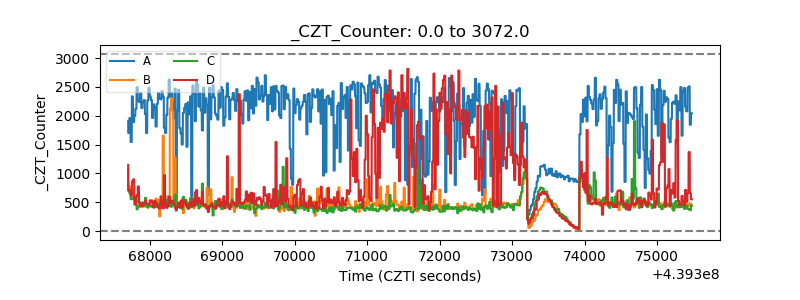 |
| +2.5 Volts monitor | 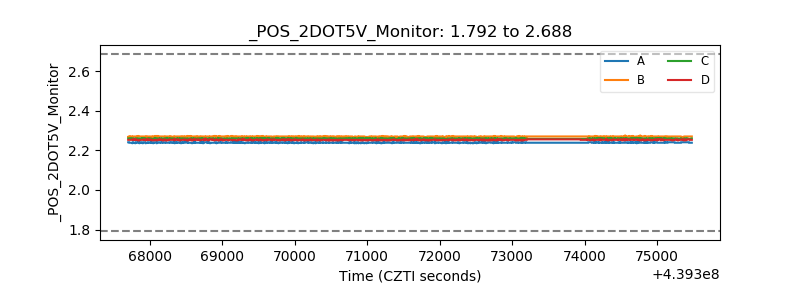 |
| +5 Volts monitor | 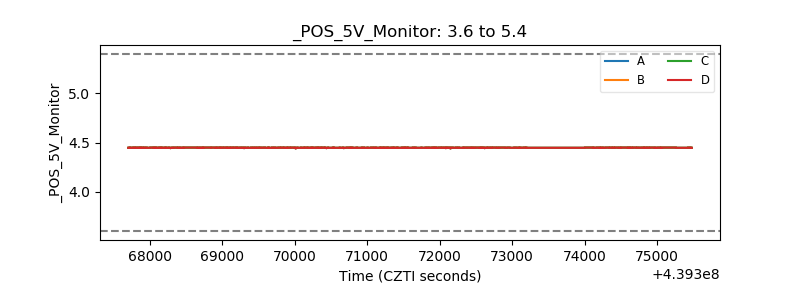 |
| _ROLL_ROT | 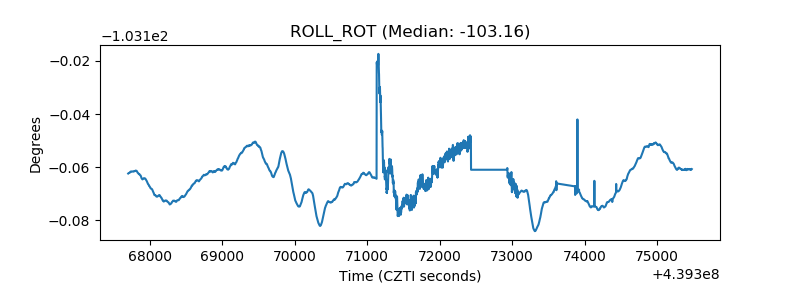 |
| _Roll_DEC | 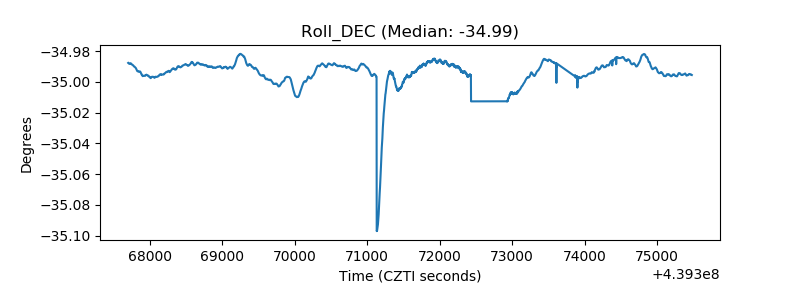 |
| _Roll_RA | 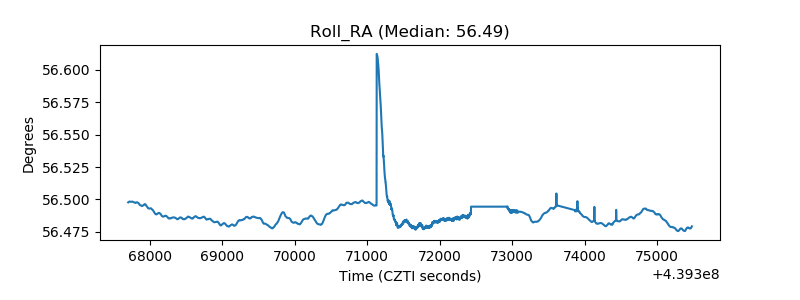 |
| Veto Counter | 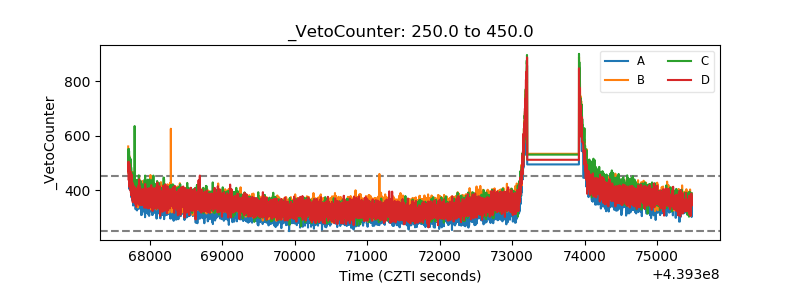 |