| Param | Original file | Final file |
|---|---|---|
| Filename | modeM0/AS1A13_079T01_9000005978_44252cztM0_level2.fits | modeM0/AS1A13_079T01_9000005978_44252cztM0_level2_quad_clean.evt |
| Size (bytes) | 790,208,640 | 65,871,360 |
| Size | 753.6 MB | 62.8 MB |
| Events in quadrant A | 13,416,303 | 140,254 |
| Events in quadrant B | 3,548,711 | 521,541 |
| Events in quadrant C | 3,597,023 | 500,809 |
| Events in quadrant D | 8,150,639 | 348,373 |
| Mode M0 | |||
|---|---|---|---|
| Quadrant | BADHDUFLAG | Total packets | Discarded packets |
| A | 0 | 47733 | 3112 |
| B | 0 | 15755 | 510 |
| C | 0 | 16272 | 564 |
| D | 0 | 30035 | 1093 |
| Mode SS | |||
|---|---|---|---|
| Quadrant | BADHDUFLAG | Total packets | Discarded packets |
| A | 0 | 148 | 2 |
| B | 0 | 148 | 4 |
| C | 0 | 148 | 0 |
| D | 0 | 148 | 0 |
| Mode M9 | |||
|---|---|---|---|
| Quadrant | BADHDUFLAG | Total packets | Discarded packets |
| A | 0 | 15 | 3 |
| B | 0 | 14 | 2 |
| C | 0 | 15 | 3 |
| D | 0 | 16 | 4 |
| Quadrant | Total seconds | Saturated seconds | Saturation percentage |
|---|---|---|---|
| A | 6750 | 4828 | 71.525926% |
| B | 7001 | 199 | 2.842451% |
| C | 6994 | 196 | 2.802402% |
| D | 6937 | 2502 | 36.067464% |
Noise dominated data is calculated using 1-second bins in cleaned event files. If a bin has >2000 counts, and if more than 50% of those come from <1% of pixels, then it is considered to be noise-dominated and hence unusable.
| Quadrant | # 1 sec bins | Bins with >0 counts | Bins with >2000 counts | High rate bins dominated by noise | Noise dominated (total time) | Noise dominated (detector-on time) | Marked lightcurve |
|---|---|---|---|---|---|---|---|
| A | 11875 | 6921 | 3752 | 3752 | 31.60% | 54.21% | 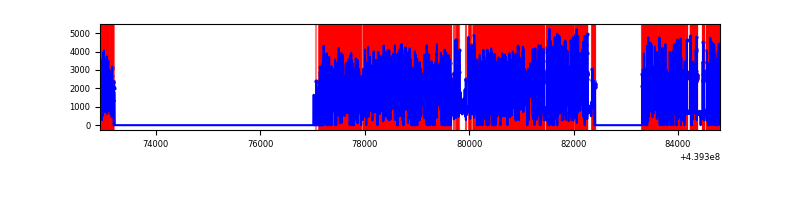 |
| B | 11875 | 7102 | 14 | 14 | 0.12% | 0.20% | 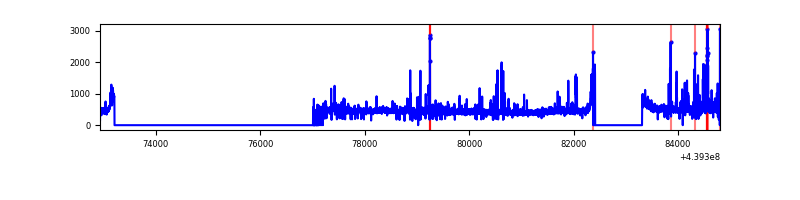 |
| C | 11876 | 7105 | 33 | 33 | 0.28% | 0.46% | 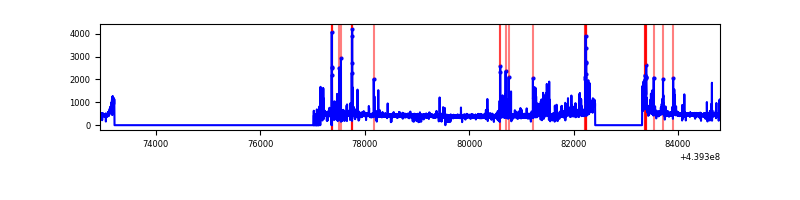 |
| D | 11876 | 7067 | 1298 | 1298 | 10.93% | 18.37% | 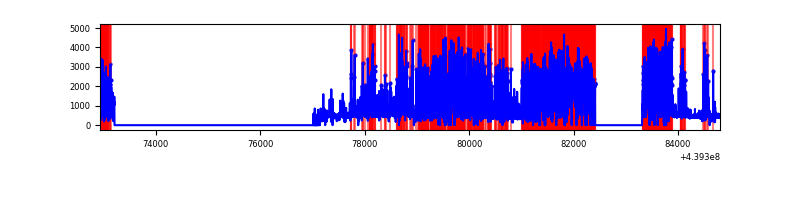 |
Top three noisy pixels from each quadrant. If the there are fewer than three noisy pixels in the level2.evt file, extra rows are filled as -1
| Pixel properties | Quadrant properties | ||||||
|---|---|---|---|---|---|---|---|
| Quadrant | DetID | PixID | Counts | Sigma | Mean | Median | Sigma |
| A | 15 | 223 | 10697752 | 113737.4 | 453 | 444 | 94.1 |
| A | 10 | 83 | 839280 | 8918.79 | 453 | 444 | 94.1 |
| A | 7 | 3 | 93596 | 990.42 | 453 | 444 | 94.1 |
| B | 4 | 158 | 129480 | 822.85 | 794 | 771 | 156.4 |
| B | 5 | 255 | 81530 | 516.3 | 794 | 771 | 156.4 |
| B | 4 | 170 | 61766 | 389.95 | 794 | 771 | 156.4 |
| C | 2 | 14 | 304615 | 1619.24 | 794 | 799 | 187.6 |
| C | 14 | 254 | 184975 | 981.6 | 794 | 799 | 187.6 |
| C | 3 | 233 | 7063 | 33.39 | 794 | 799 | 187.6 |
| D | 4 | 221 | 2871664 | 18368.59 | 615 | 597 | 156.3 |
| D | 12 | 2 | 1880084 | 12024.63 | 615 | 597 | 156.3 |
| D | 1 | 52 | 370093 | 2363.97 | 615 | 597 | 156.3 |
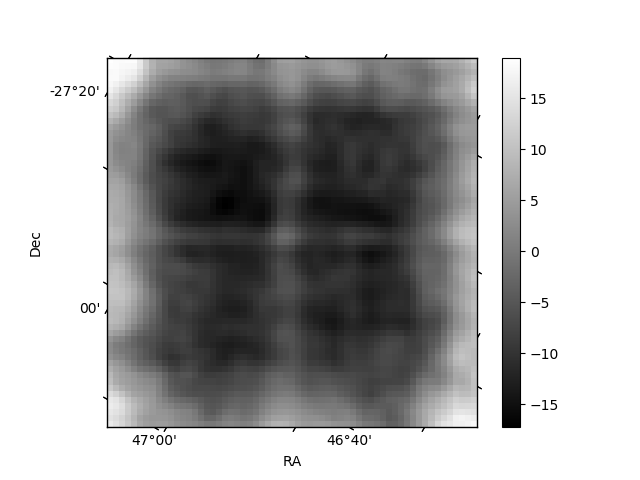
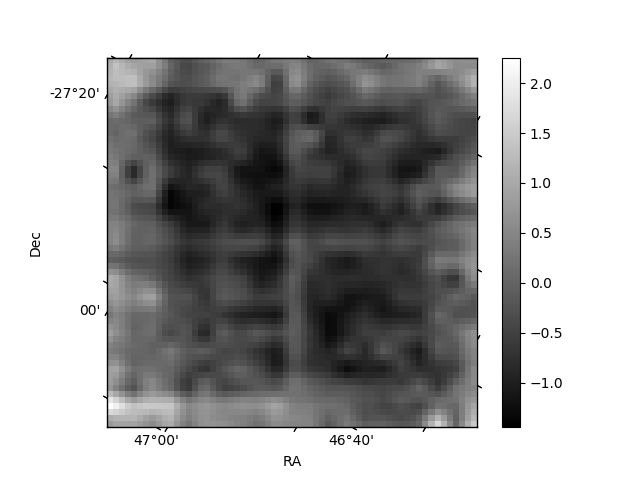
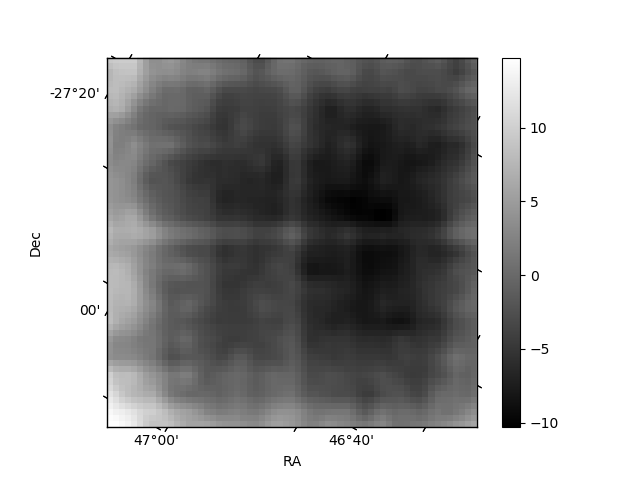
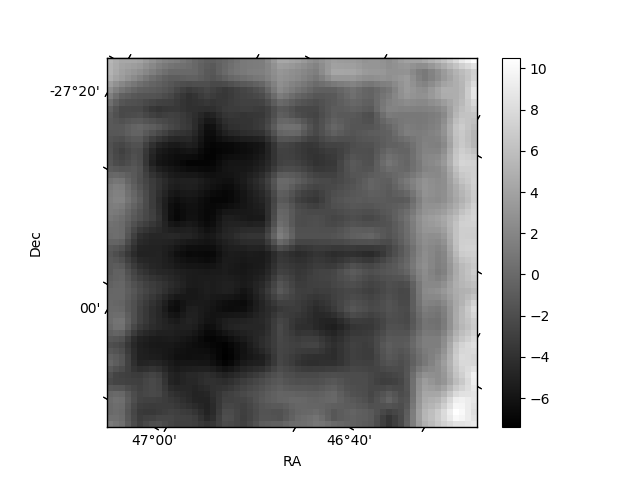
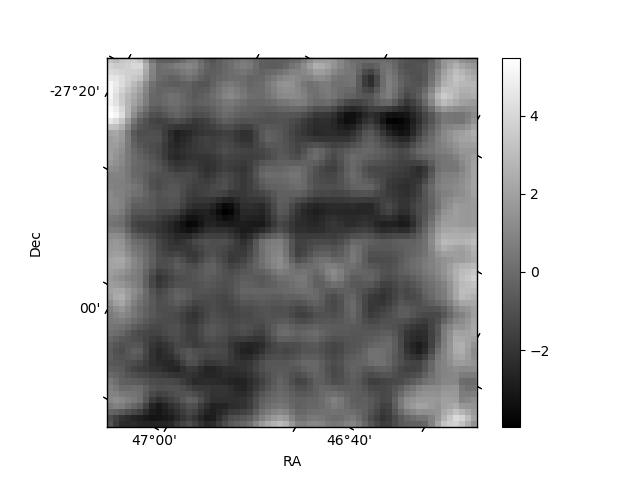
Histogram calculated using DETX and DETY for each event in the final _common_clean file
| Quadrant A | 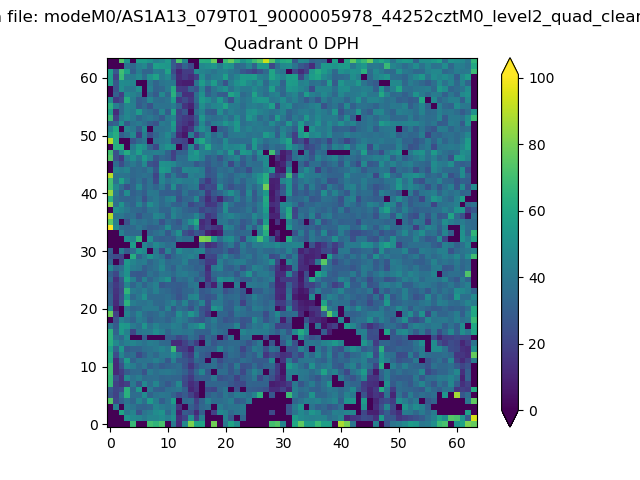 |
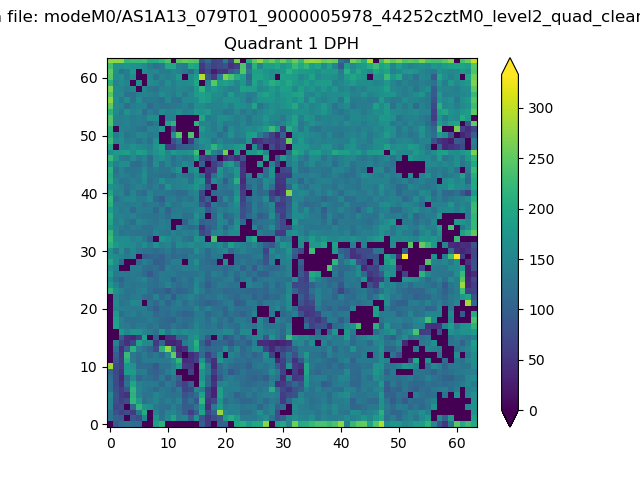 |
Quadrant B |
|---|---|---|---|
| Quadrant D | 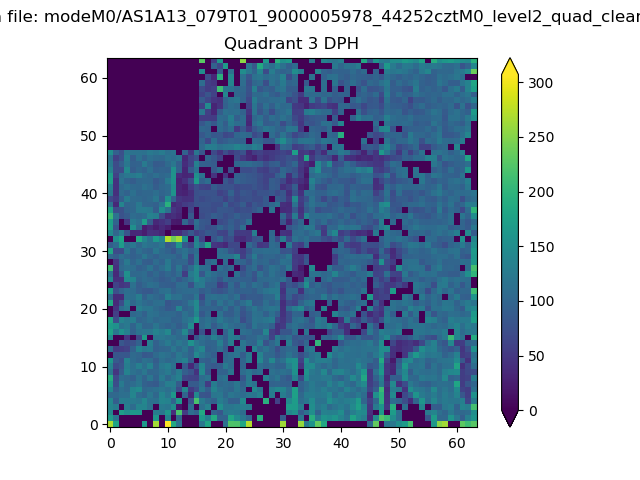 |
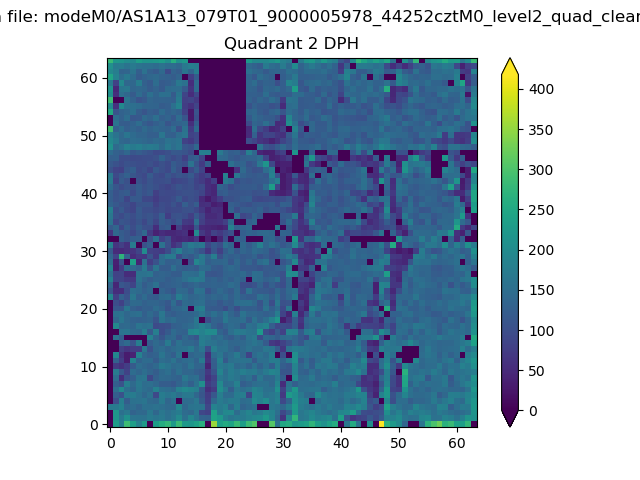 |
Quadrant C |
| Plot type | Count rate plots | Images |
|---|---|---|
| Comparison with Poisson distribution Blue bars denote a histogram of data divided into 1 sec bins. Red curve is a Poisson curve with rate = median count rate of data. |
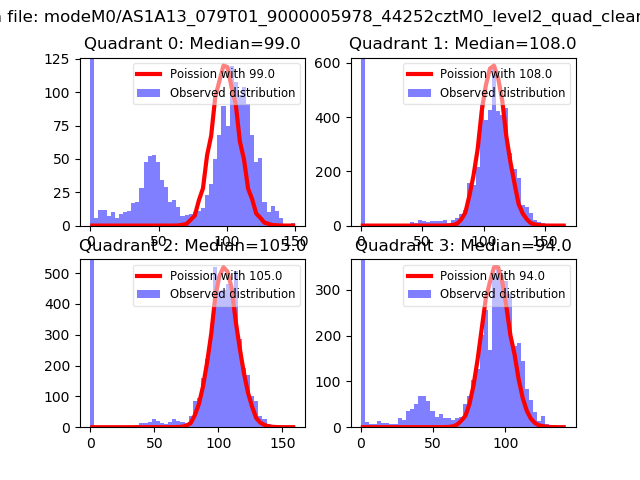 |
 |
| Quadrant-wise count rates Data is divided into 100 sec bins |
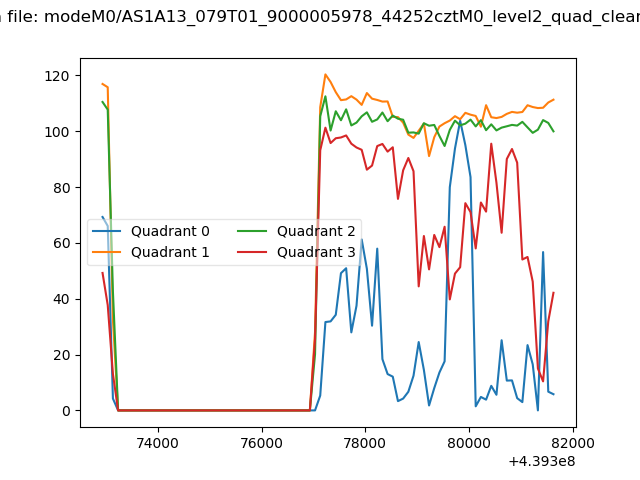 |
|
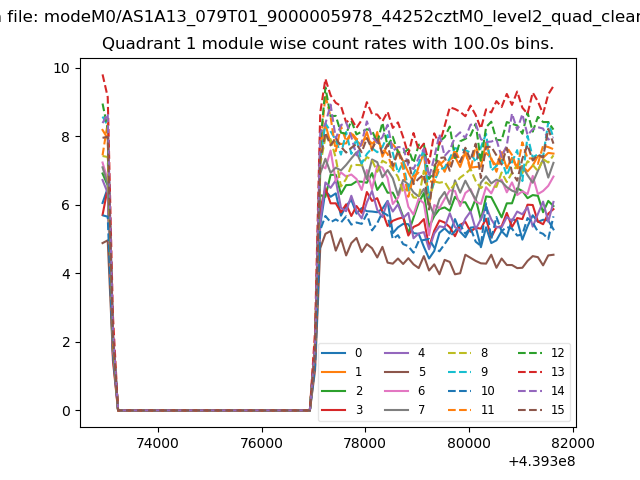
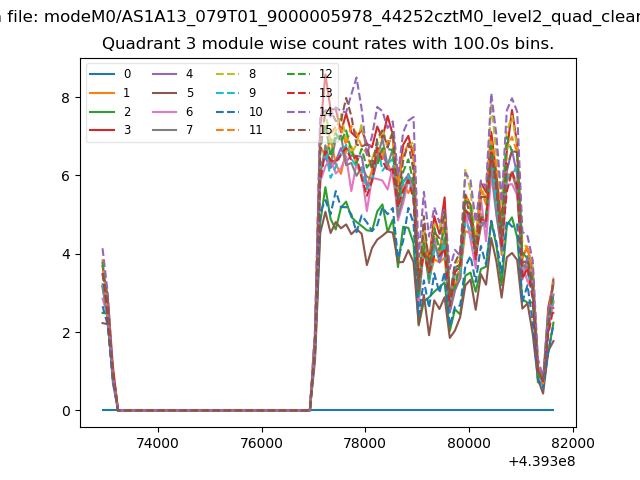
| Module-wise count rates for Quadrant A Data is divided into 100 sec bins |
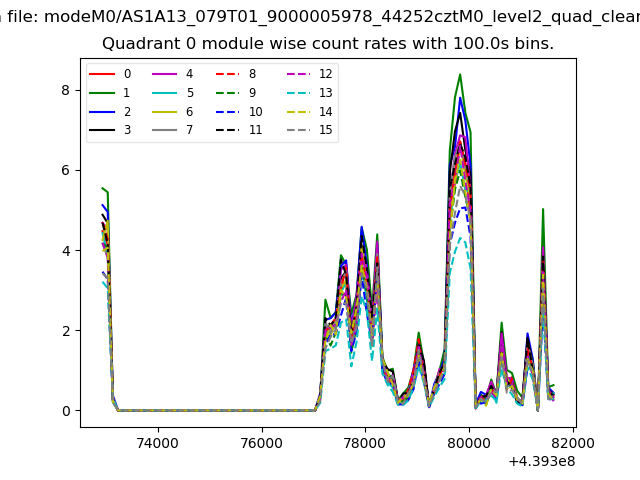 |
 |
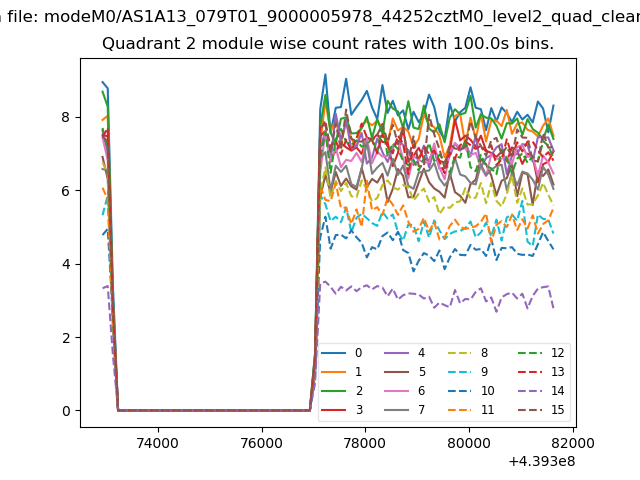
| Module-wise count rates for Quadrant B Data is divided into 100 sec bins |
 |
 |
| Module-wise count rates for Quadrant C Data is divided into 100 sec bins |
 |
 |
| Module-wise count rates for Quadrant D Data is divided into 100 sec bins |
 |
 |
| Parameter | Plot |
|---|---|
| CZT HV Monitor | 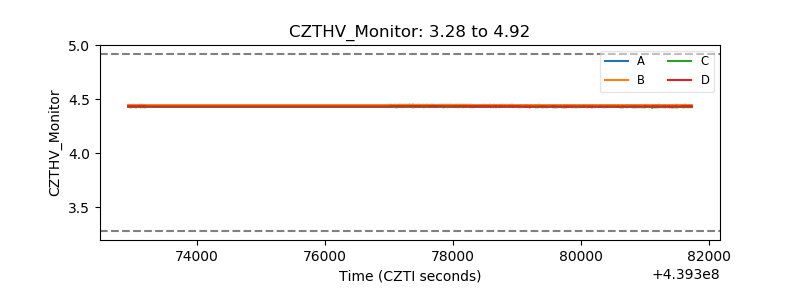 |
| D_VDD | 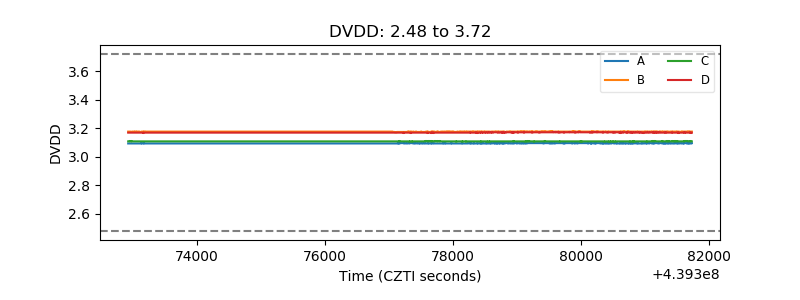 |
| Temperature 1 | 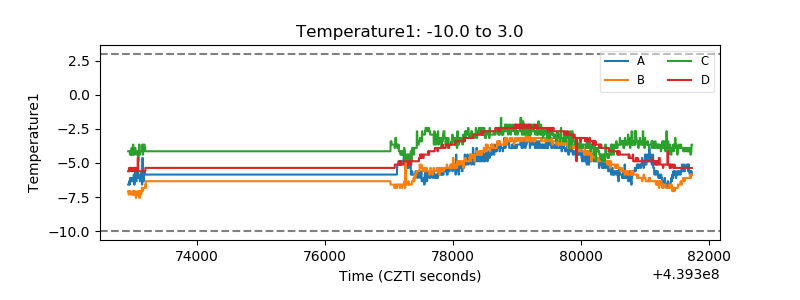 |
| Veto HV Monitor | 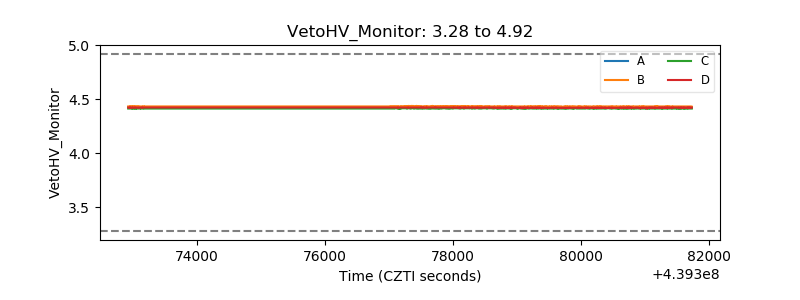 |
| Veto LLD | 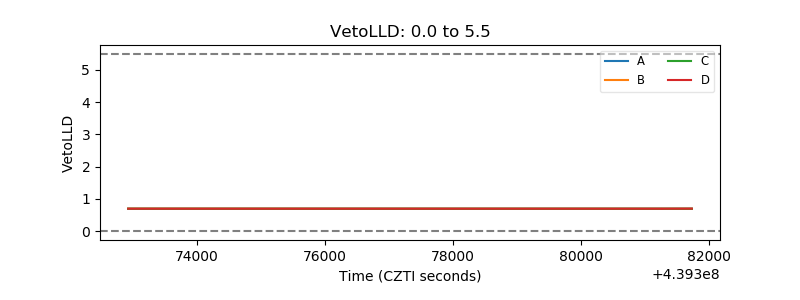 |
| Alpha Counter | 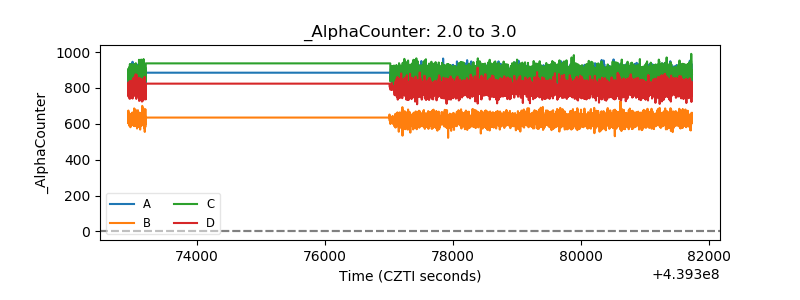 |
| _CPM_Rate | 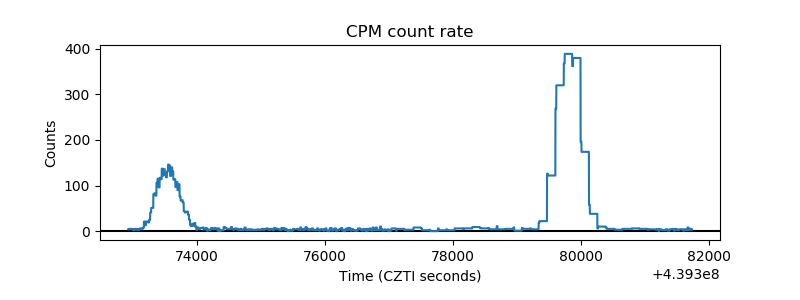 |
| CZT Counter | 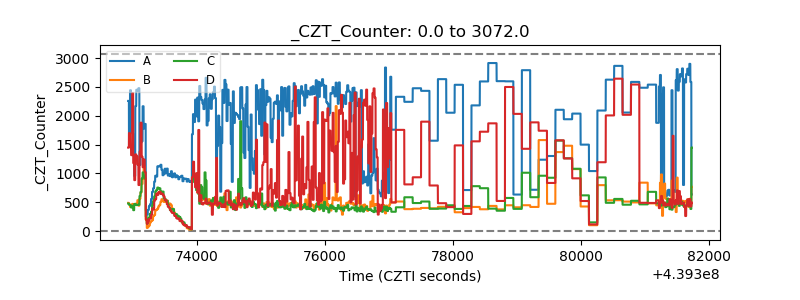 |
| +2.5 Volts monitor | 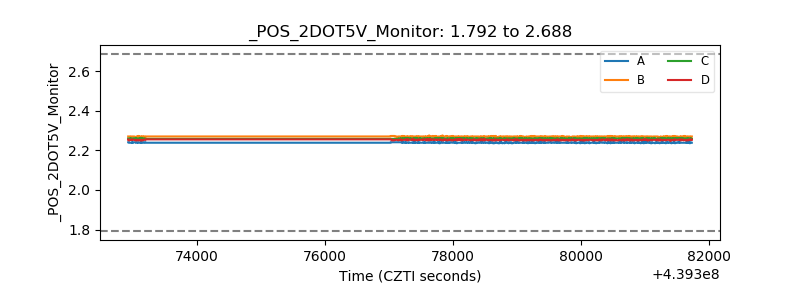 |
| +5 Volts monitor | 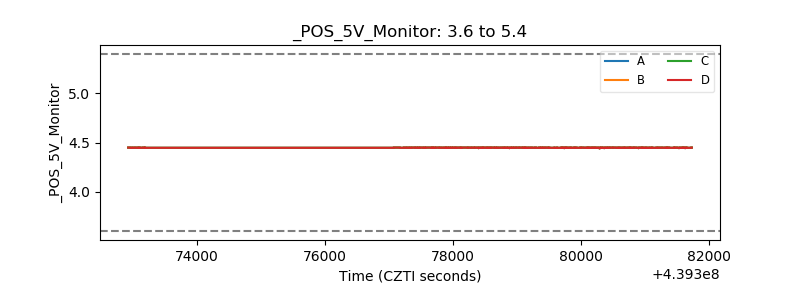 |
| _ROLL_ROT | 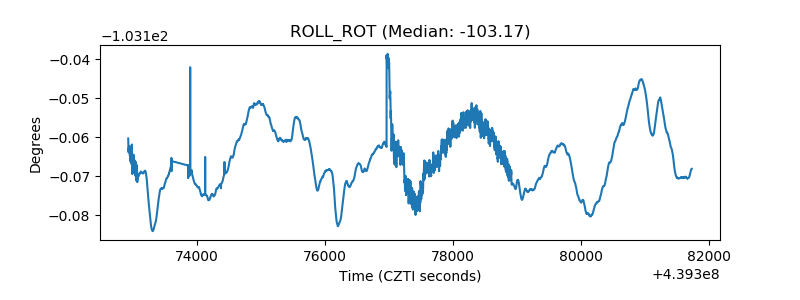 |
| _Roll_DEC | 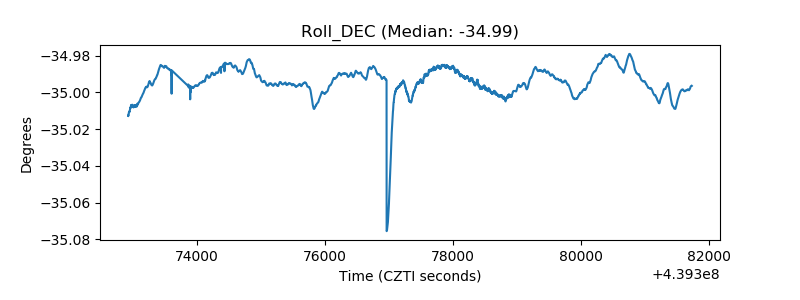 |
| _Roll_RA | 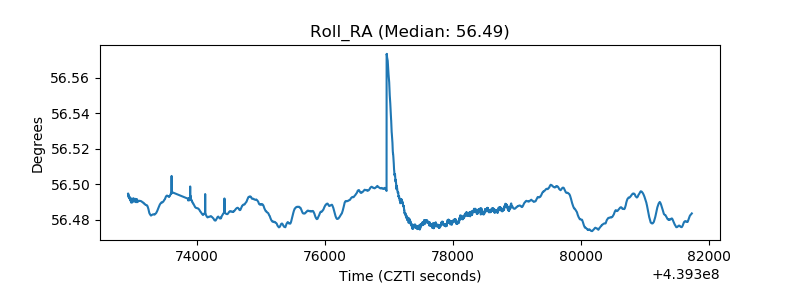 |
| Veto Counter | 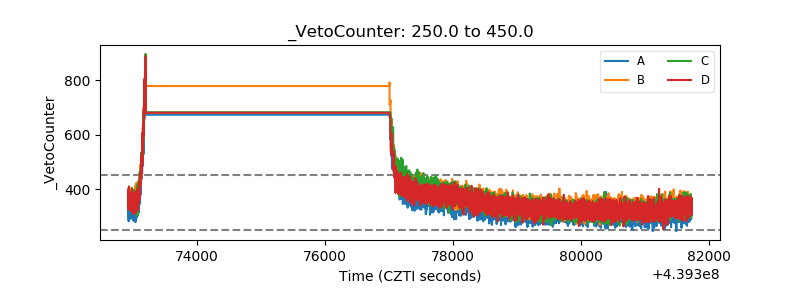 |