| Param | Original file | Final file |
|---|---|---|
| Filename | modeM0/AS1A13_080T05_9000005980_44255cztM0_level2.fits | modeM0/AS1A13_080T05_9000005980_44255cztM0_level2_quad_clean.evt |
| Size (bytes) | 229,979,520 | 56,828,160 |
| Size | 219.3 MB | 54.2 MB |
| Events in quadrant A | 2,371,772 | 383,822 |
| Events in quadrant B | 2,169,561 | 394,205 |
| Events in quadrant C | 1,529,702 | 375,176 |
| Events in quadrant D | 2,191,665 | 340,031 |
| Mode SS | |||
|---|---|---|---|
| Quadrant | BADHDUFLAG | Total packets | Discarded packets |
| A | 0 | 66 | 0 |
| B | 0 | 66 | 0 |
| C | 0 | 66 | 0 |
| D | 0 | 66 | 0 |
| Mode M9 | |||
|---|---|---|---|
| Quadrant | BADHDUFLAG | Total packets | Discarded packets |
| A | 0 | 12 | 0 |
| B | 0 | 12 | 0 |
| C | 0 | 12 | 0 |
| D | 0 | 12 | 0 |
| Mode M0 | |||
|---|---|---|---|
| Quadrant | BADHDUFLAG | Total packets | Discarded packets |
| A | 0 | 9478 | 1 |
| B | 0 | 8670 | 1 |
| C | 0 | 6749 | 1 |
| D | 0 | 8696 | 1 |
| Quadrant | Total seconds | Saturated seconds | Saturation percentage |
|---|---|---|---|
| A | 3203 | 121 | 3.777708% |
| B | 3203 | 147 | 4.589447% |
| C | 3203 | 35 | 1.092726% |
| D | 3203 | 95 | 2.965969% |
Noise dominated data is calculated using 1-second bins in cleaned event files. If a bin has >2000 counts, and if more than 50% of those come from <1% of pixels, then it is considered to be noise-dominated and hence unusable.
| Quadrant | # 1 sec bins | Bins with >0 counts | Bins with >2000 counts | High rate bins dominated by noise | Noise dominated (total time) | Noise dominated (detector-on time) | Marked lightcurve |
|---|---|---|---|---|---|---|---|
| A | 4358 | 3204 | 4 | 4 | 0.09% | 0.12% | 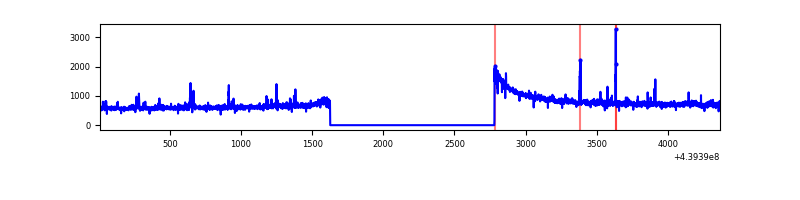 |
| B | 4358 | 3204 | 65 | 65 | 1.49% | 2.03% | 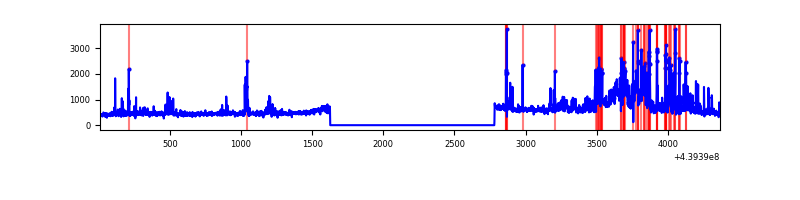 |
| C | 4358 | 3204 | 1 | 1 | 0.02% | 0.03% | 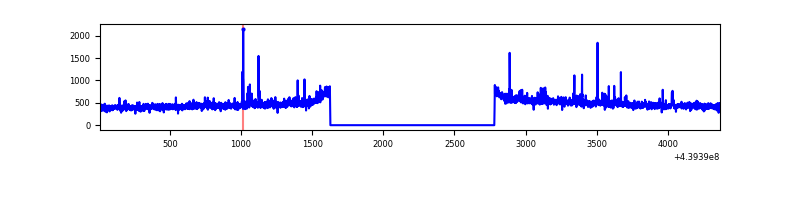 |
| D | 4358 | 3204 | 65 | 65 | 1.49% | 2.03% | 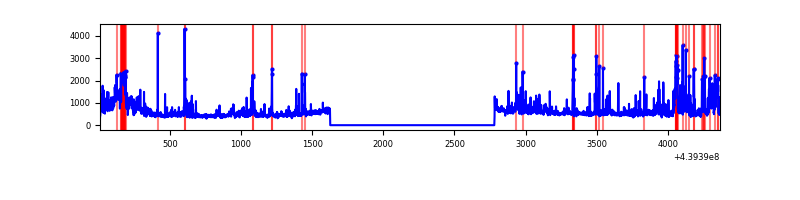 |
Top three noisy pixels from each quadrant. If the there are fewer than three noisy pixels in the level2.evt file, extra rows are filled as -1
| Pixel properties | Quadrant properties | ||||||
|---|---|---|---|---|---|---|---|
| Quadrant | DetID | PixID | Counts | Sigma | Mean | Median | Sigma |
| A | 10 | 83 | 811887 | 9960.25 | 387 | 380 | 81.5 |
| A | 7 | 3 | 29038 | 351.74 | 387 | 380 | 81.5 |
| A | 15 | 223 | 16939 | 203.24 | 387 | 380 | 81.5 |
| B | 15 | 36 | 376408 | 5034.8 | 381 | 371 | 74.7 |
| B | 4 | 158 | 87516 | 1166.79 | 381 | 371 | 74.7 |
| B | 0 | 155 | 56060 | 745.63 | 381 | 371 | 74.7 |
| C | 14 | 254 | 44164 | 493.03 | 375 | 377 | 88.8 |
| C | 3 | 233 | 18068 | 199.2 | 375 | 377 | 88.8 |
| C | 2 | 14 | 3342 | 33.39 | 375 | 377 | 88.8 |
| D | 8 | 128 | 222678 | 2339.11 | 374 | 361 | 95.0 |
| D | 1 | 52 | 125178 | 1313.26 | 374 | 361 | 95.0 |
| D | 5 | 235 | 111686 | 1171.31 | 374 | 361 | 95.0 |
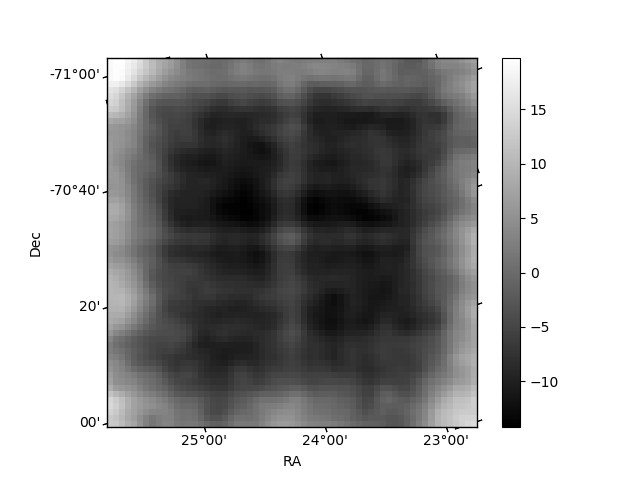
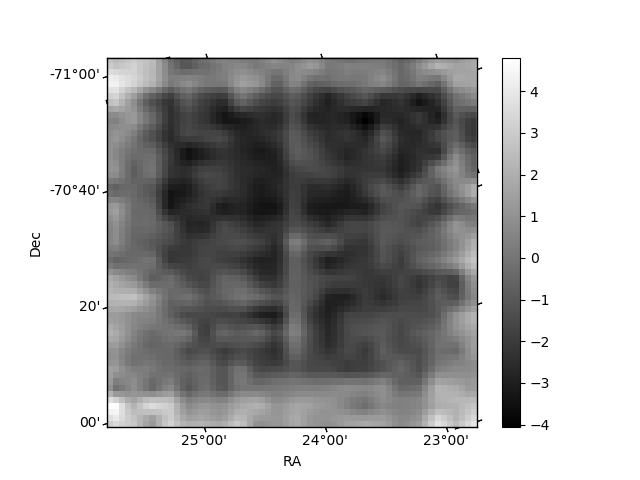
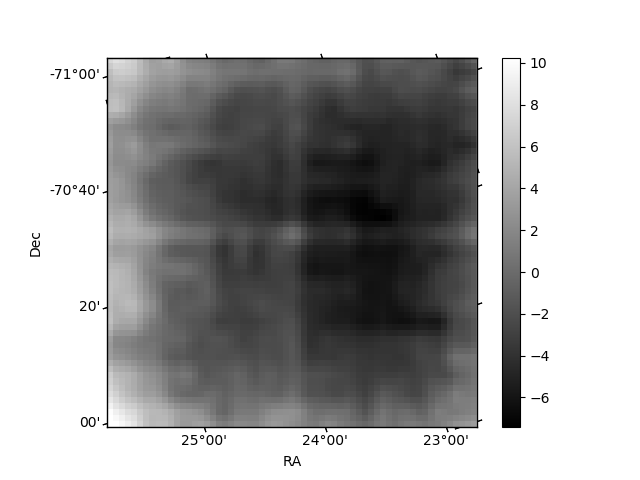
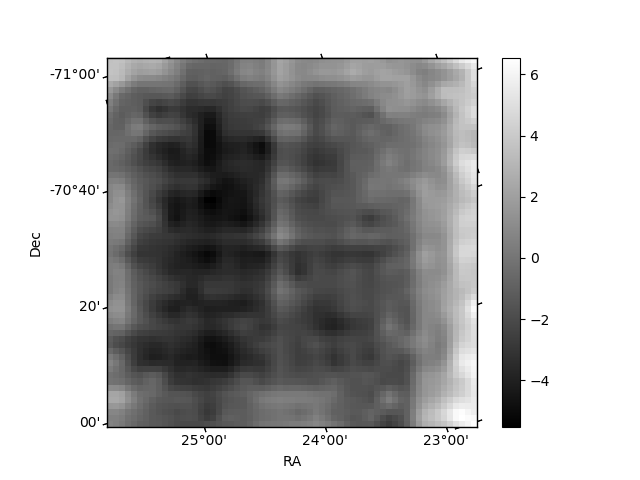
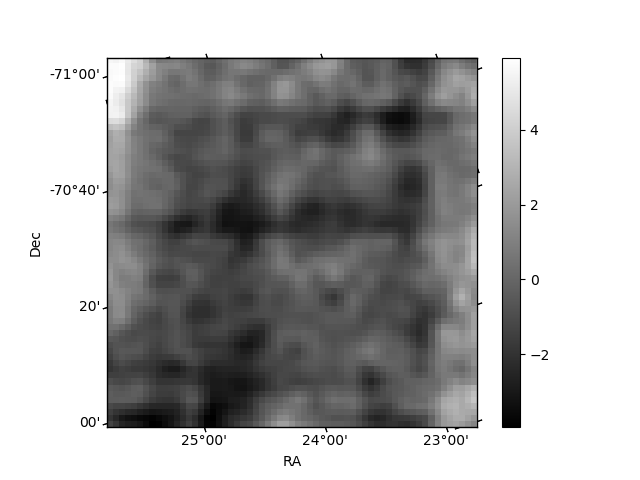
Histogram calculated using DETX and DETY for each event in the final _common_clean file
| Quadrant A | 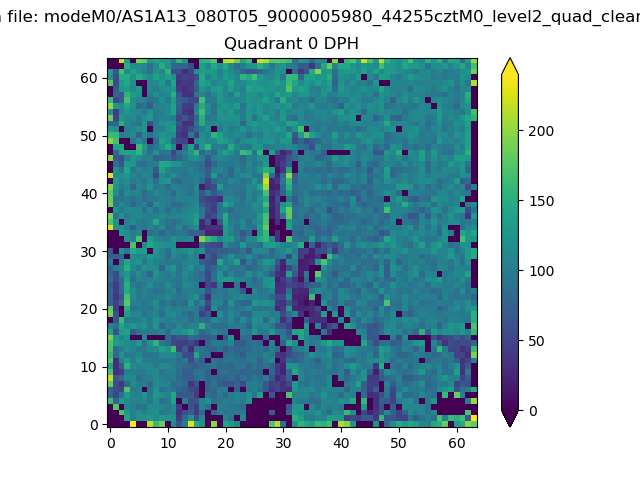 |
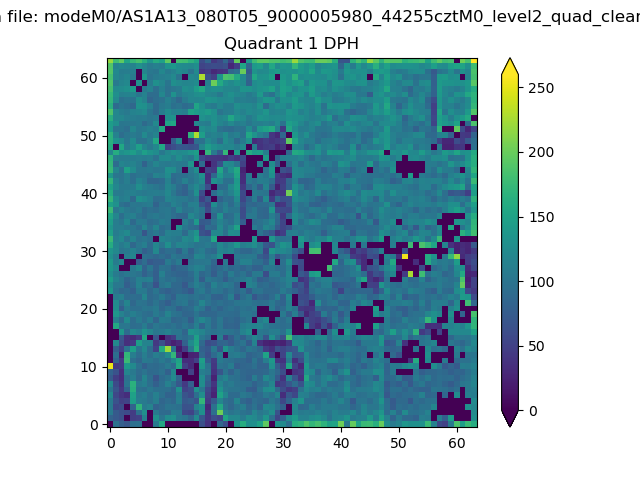 |
Quadrant B |
|---|---|---|---|
| Quadrant D | 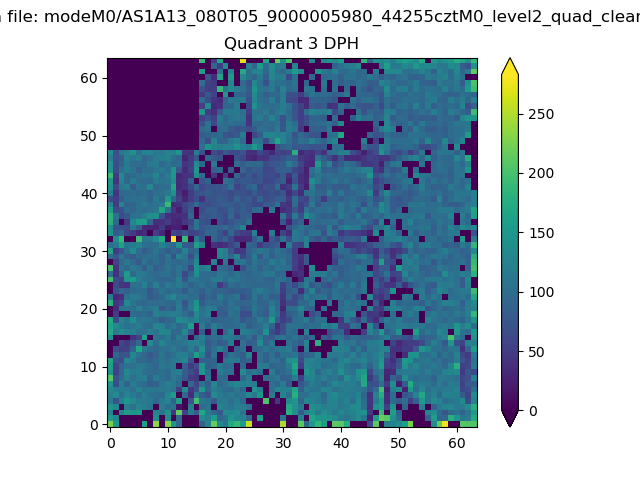 |
 |
Quadrant C |
| Plot type | Count rate plots | Images |
|---|---|---|
| Comparison with Poisson distribution Blue bars denote a histogram of data divided into 1 sec bins. Red curve is a Poisson curve with rate = median count rate of data. |
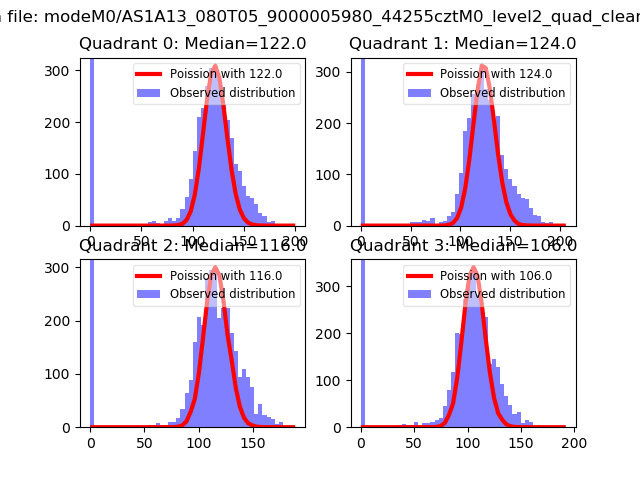 |
 |
| Quadrant-wise count rates Data is divided into 100 sec bins |
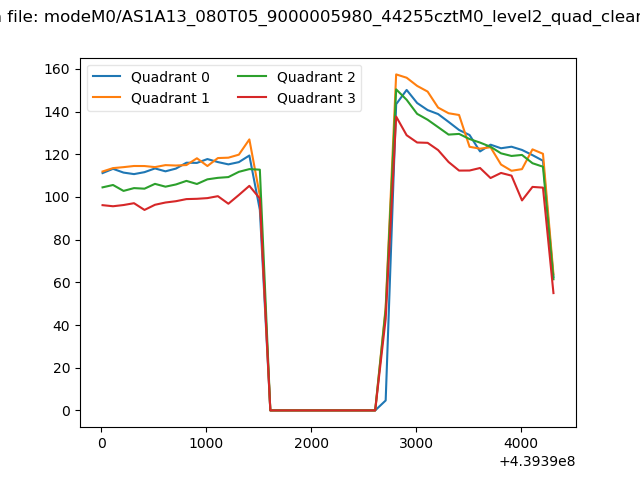 |
|
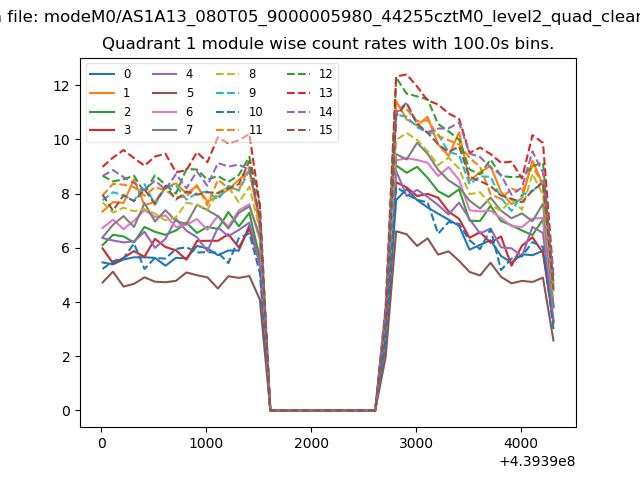
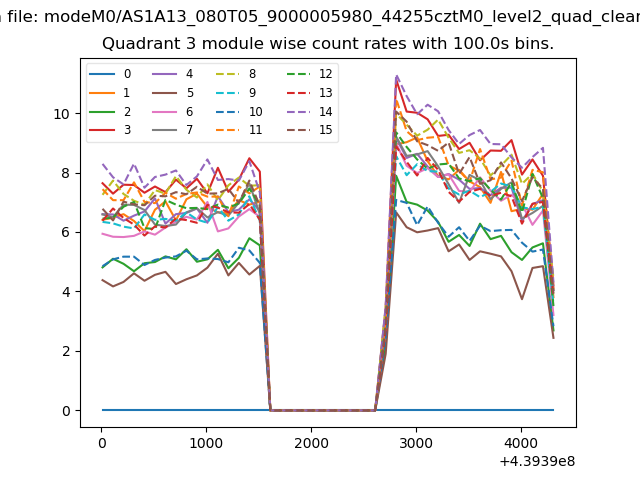
| Module-wise count rates for Quadrant A Data is divided into 100 sec bins |
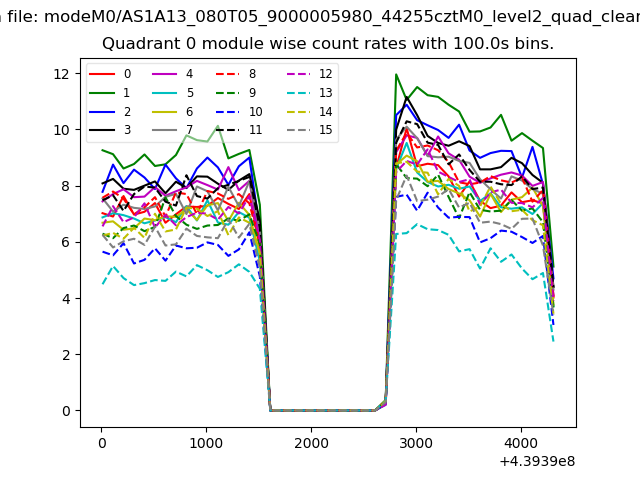 |
 |
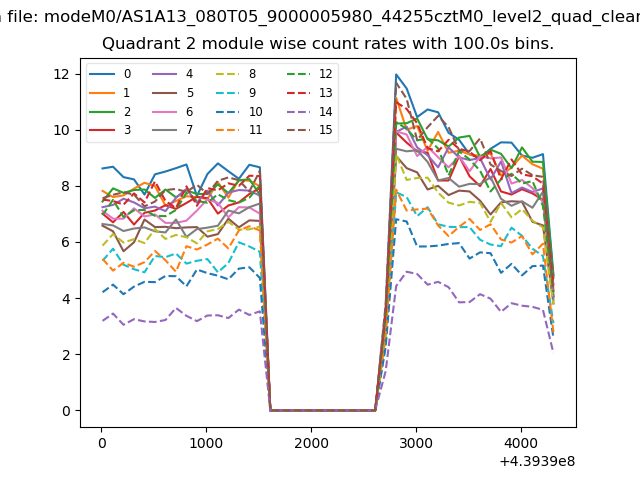
| Module-wise count rates for Quadrant B Data is divided into 100 sec bins |
 |
 |
| Module-wise count rates for Quadrant C Data is divided into 100 sec bins |
 |
 |
| Module-wise count rates for Quadrant D Data is divided into 100 sec bins |
 |
 |
| Parameter | Plot |
|---|---|
| CZT HV Monitor | 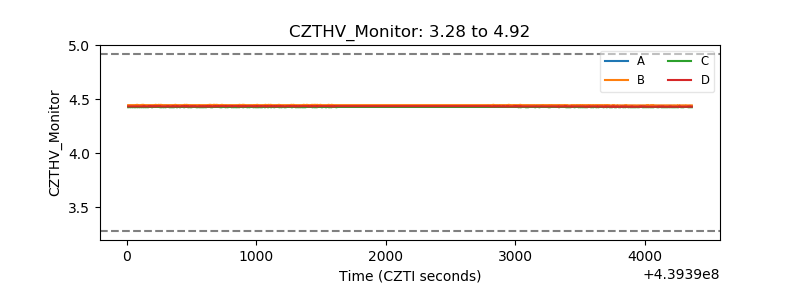 |
| D_VDD | 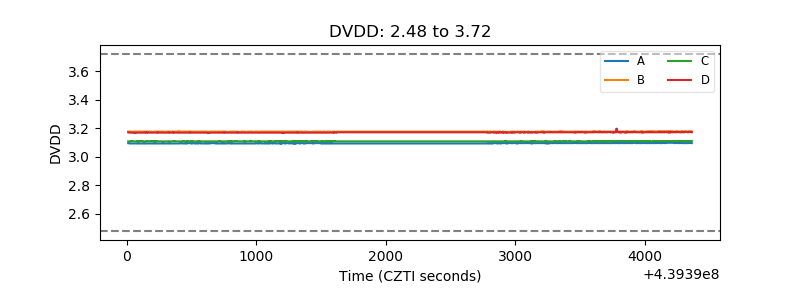 |
| Temperature 1 | 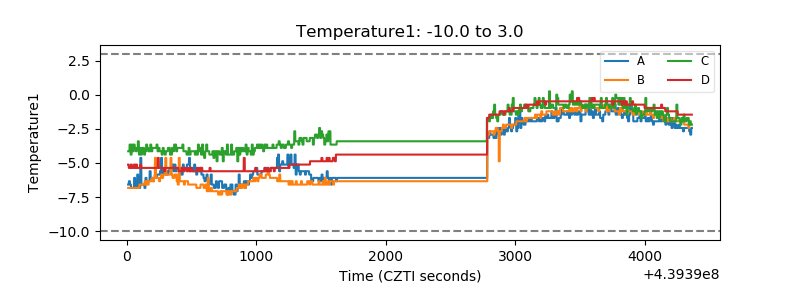 |
| Veto HV Monitor | 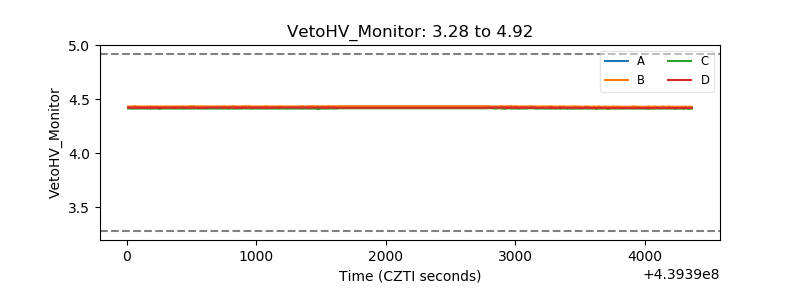 |
| Veto LLD | 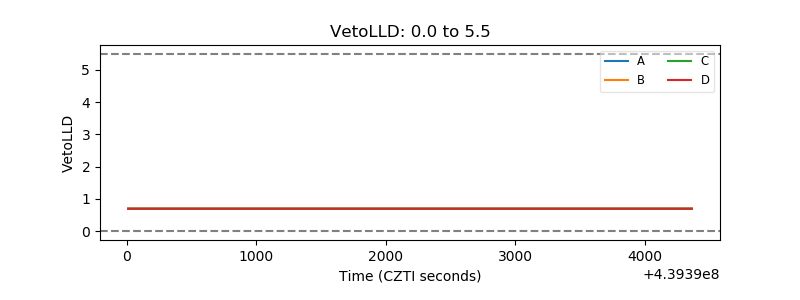 |
| Alpha Counter | 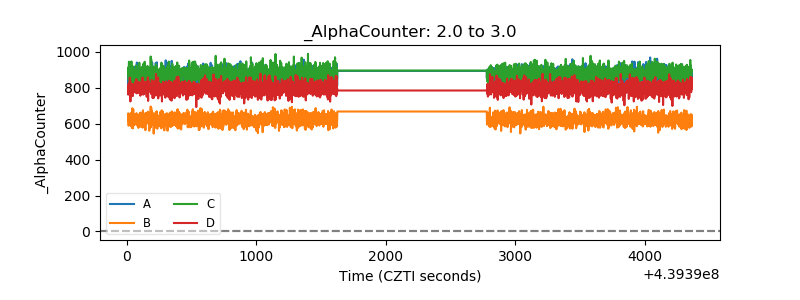 |
| _CPM_Rate | 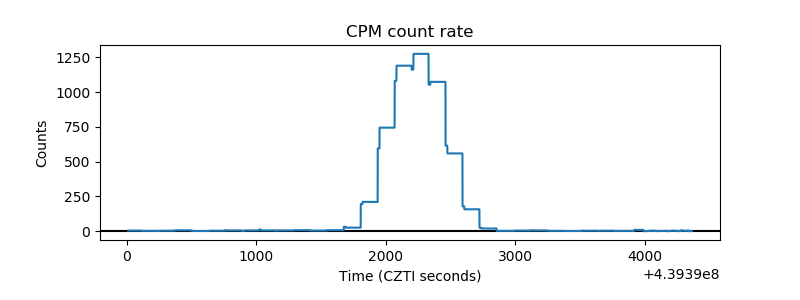 |
| CZT Counter |  |
| +2.5 Volts monitor | 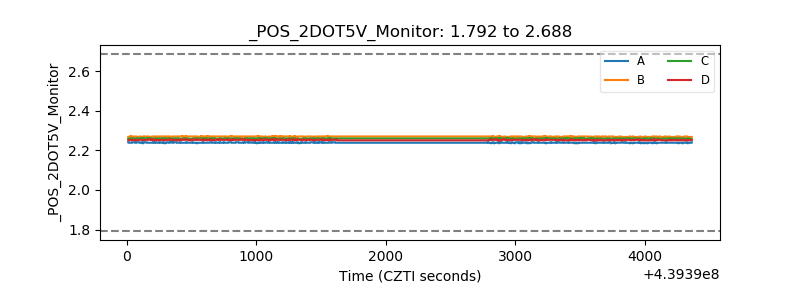 |
| +5 Volts monitor | 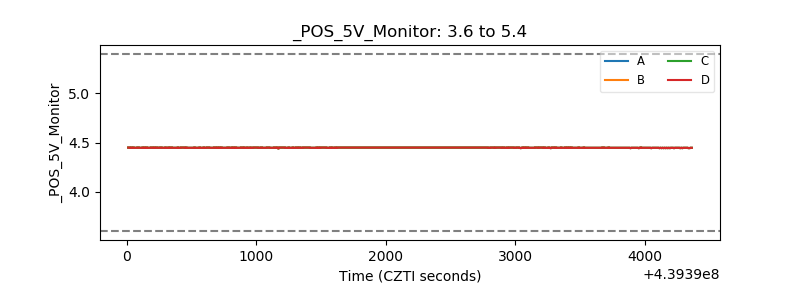 |
| _ROLL_ROT | 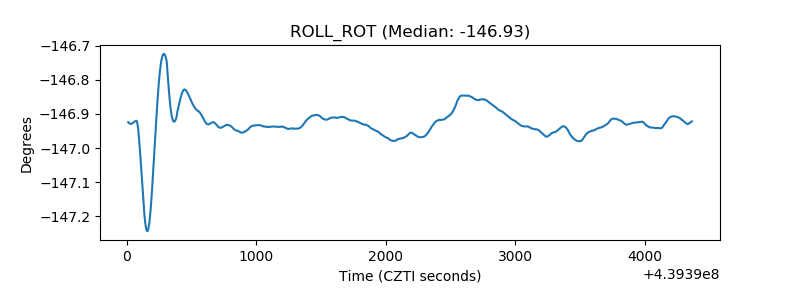 |
| _Roll_DEC | 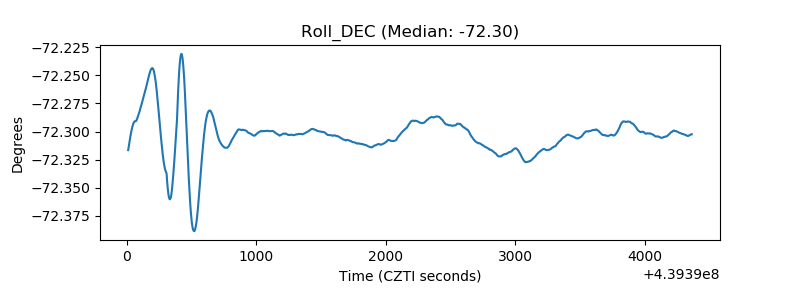 |
| _Roll_RA | 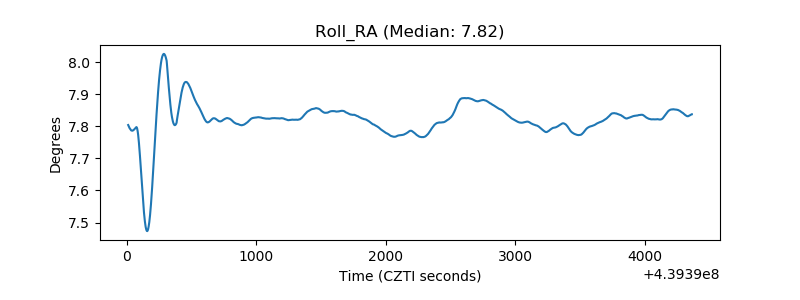 |
| Veto Counter | 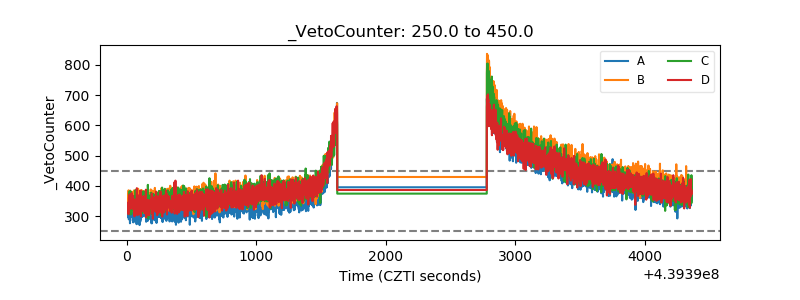 |