| Param | Original file | Final file |
|---|---|---|
| Filename | modeM0/AS1A13_080T05_9000005980_44257cztM0_level2.fits | modeM0/AS1A13_080T05_9000005980_44257cztM0_level2_quad_clean.evt |
| Size (bytes) | 440,913,600 | 98,055,360 |
| Size | 420.5 MB | 93.5 MB |
| Events in quadrant A | 5,752,386 | 667,238 |
| Events in quadrant B | 3,851,955 | 672,116 |
| Events in quadrant C | 2,805,004 | 645,255 |
| Events in quadrant D | 3,466,431 | 583,175 |
| Mode SS | |||
|---|---|---|---|
| Quadrant | BADHDUFLAG | Total packets | Discarded packets |
| A | 0 | 116 | 0 |
| B | 0 | 116 | 0 |
| C | 0 | 116 | 0 |
| D | 0 | 116 | 0 |
| Mode M9 | |||
|---|---|---|---|
| Quadrant | BADHDUFLAG | Total packets | Discarded packets |
| A | 0 | 13 | 0 |
| B | 0 | 13 | 0 |
| C | 0 | 13 | 0 |
| D | 0 | 13 | 0 |
| Mode M0 | |||
|---|---|---|---|
| Quadrant | BADHDUFLAG | Total packets | Discarded packets |
| A | 0 | 21434 | 1 |
| B | 0 | 15381 | 1 |
| C | 0 | 12584 | 1 |
| D | 0 | 14289 | 1 |
| Quadrant | Total seconds | Saturated seconds | Saturation percentage |
|---|---|---|---|
| A | 5740 | 192 | 3.344948% |
| B | 5741 | 262 | 4.563665% |
| C | 5741 | 26 | 0.452883% |
| D | 5741 | 109 | 1.898624% |
Noise dominated data is calculated using 1-second bins in cleaned event files. If a bin has >2000 counts, and if more than 50% of those come from <1% of pixels, then it is considered to be noise-dominated and hence unusable.
| Quadrant | # 1 sec bins | Bins with >0 counts | Bins with >2000 counts | High rate bins dominated by noise | Noise dominated (total time) | Noise dominated (detector-on time) | Marked lightcurve |
|---|---|---|---|---|---|---|---|
| A | 7005 | 5741 | 133 | 133 | 1.90% | 2.32% | 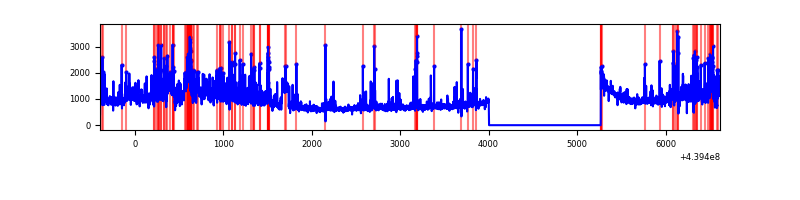 |
| B | 7006 | 5742 | 123 | 123 | 1.76% | 2.14% | 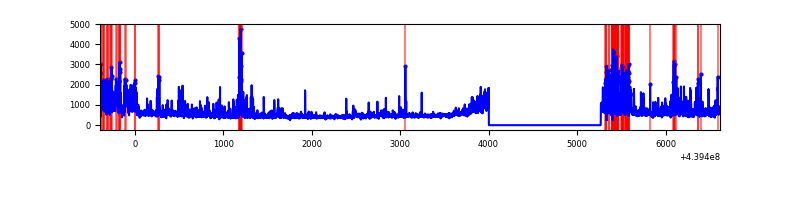 |
| C | 7006 | 5742 | 11 | 11 | 0.16% | 0.19% | 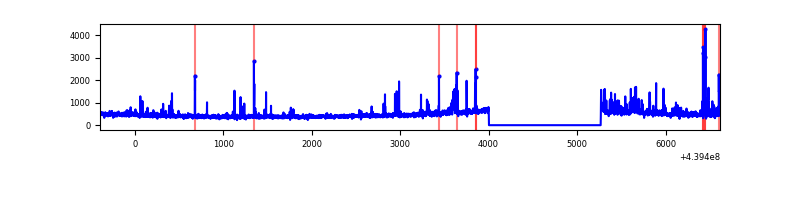 |
| D | 7006 | 5742 | 96 | 96 | 1.37% | 1.67% | 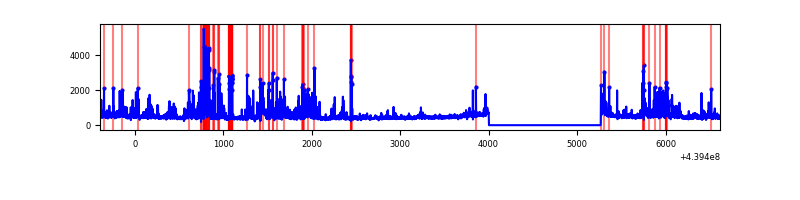 |
Top three noisy pixels from each quadrant. If the there are fewer than three noisy pixels in the level2.evt file, extra rows are filled as -1
| Pixel properties | Quadrant properties | ||||||
|---|---|---|---|---|---|---|---|
| Quadrant | DetID | PixID | Counts | Sigma | Mean | Median | Sigma |
| A | 10 | 83 | 1503409 | 11213.16 | 638 | 625 | 134.0 |
| A | 15 | 223 | 1467518 | 10945.36 | 638 | 625 | 134.0 |
| A | 7 | 3 | 130679 | 970.41 | 638 | 625 | 134.0 |
| B | 15 | 36 | 411128 | 3386.41 | 637 | 620 | 121.2 |
| B | 0 | 219 | 184043 | 1513.11 | 637 | 620 | 121.2 |
| B | 4 | 170 | 163231 | 1341.43 | 637 | 620 | 121.2 |
| C | 3 | 233 | 147725 | 1023.06 | 615 | 619 | 143.8 |
| C | 14 | 254 | 130233 | 901.41 | 615 | 619 | 143.8 |
| C | 4 | 254 | 104496 | 722.42 | 615 | 619 | 143.8 |
| D | 13 | 138 | 249047 | 1596.92 | 613 | 594 | 155.6 |
| D | 5 | 235 | 209306 | 1341.49 | 613 | 594 | 155.6 |
| D | 12 | 233 | 176270 | 1129.15 | 613 | 594 | 155.6 |
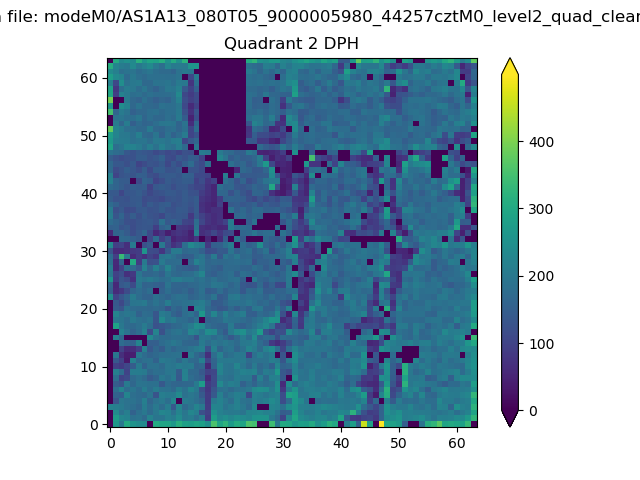
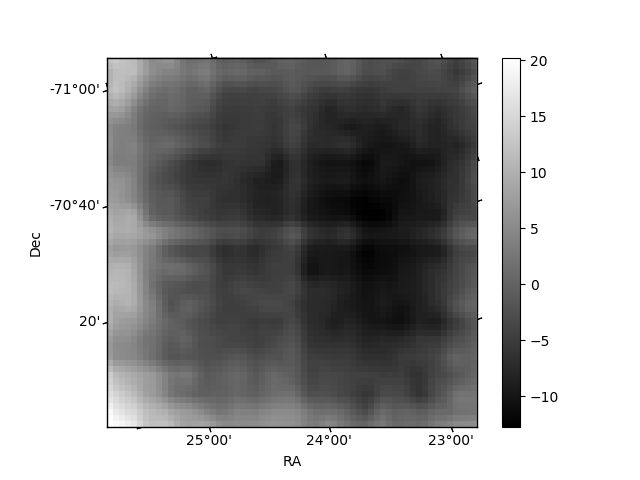
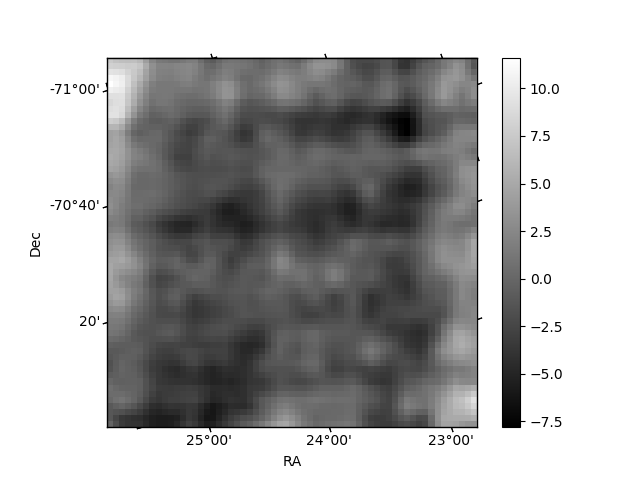
Histogram calculated using DETX and DETY for each event in the final _common_clean file
| Quadrant A | 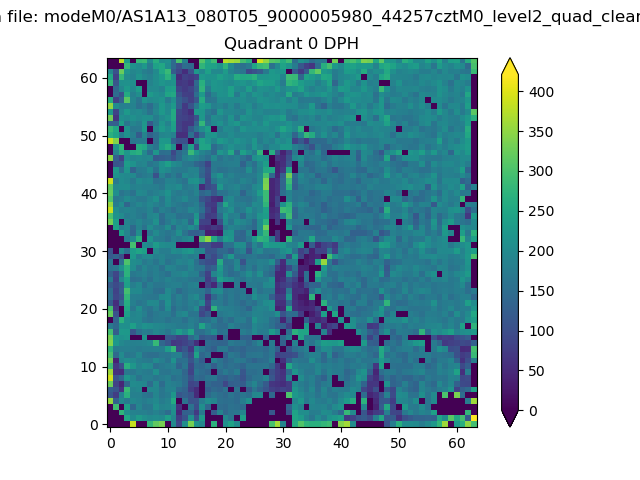 |
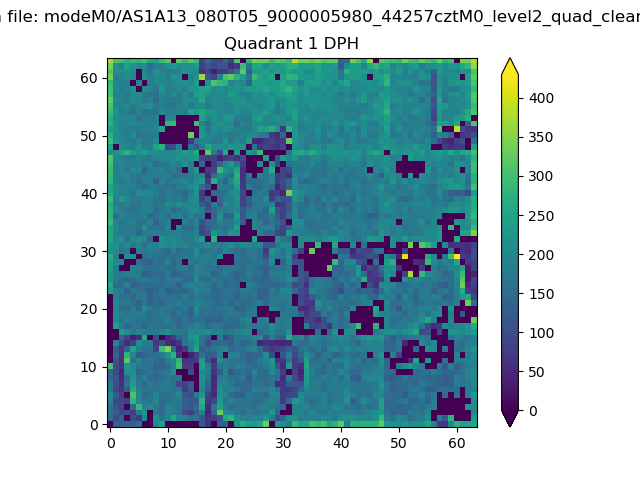 |
Quadrant B |
|---|---|---|---|
| Quadrant D | 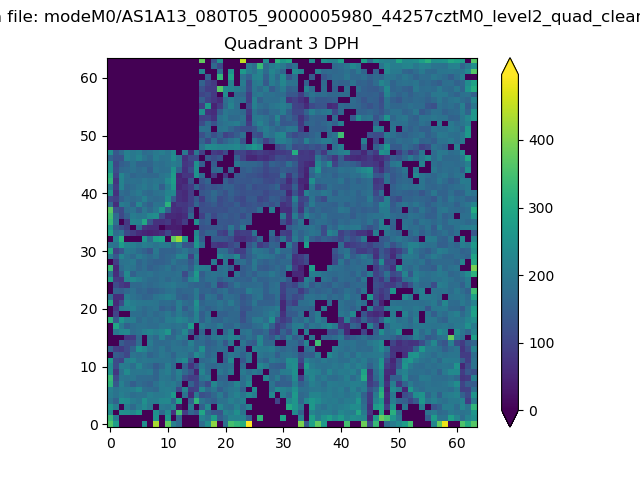 |
 |
Quadrant C |
| Plot type | Count rate plots | Images |
|---|---|---|
| Comparison with Poisson distribution Blue bars denote a histogram of data divided into 1 sec bins. Red curve is a Poisson curve with rate = median count rate of data. |
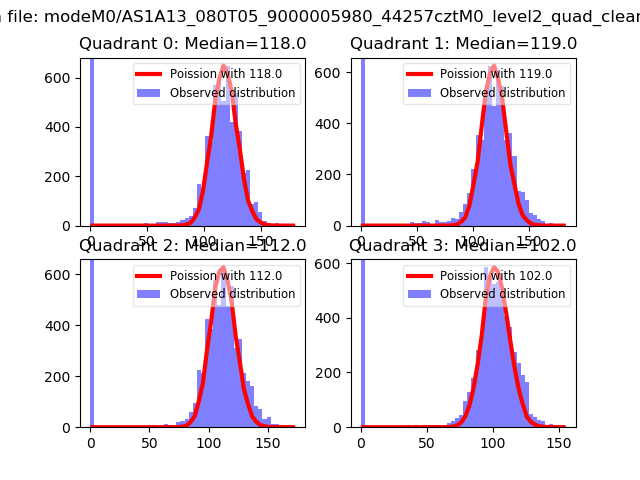 |
 |
| Quadrant-wise count rates Data is divided into 100 sec bins |
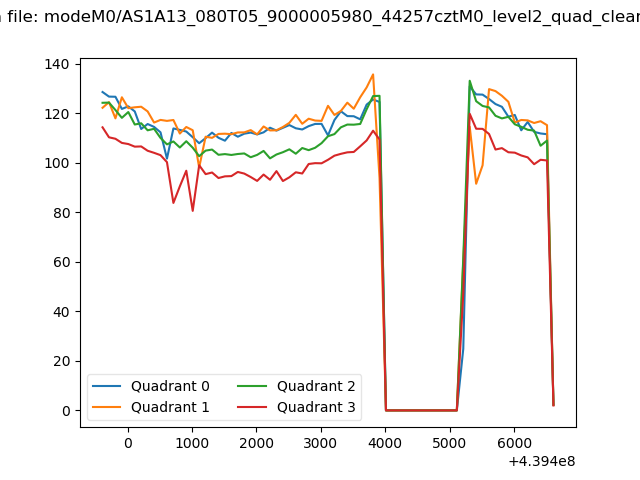 |
|
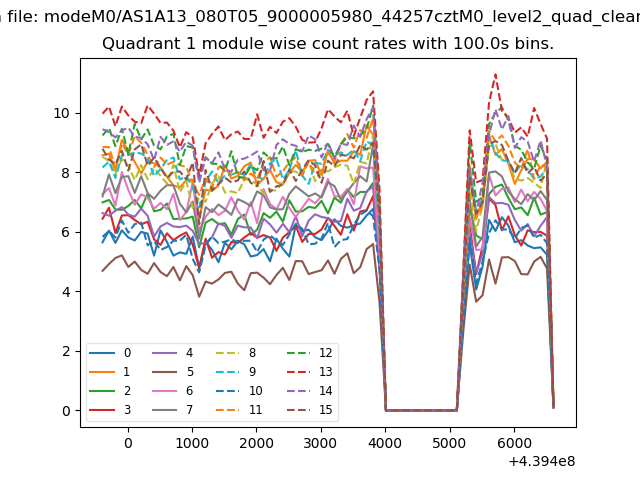
| Module-wise count rates for Quadrant A Data is divided into 100 sec bins |
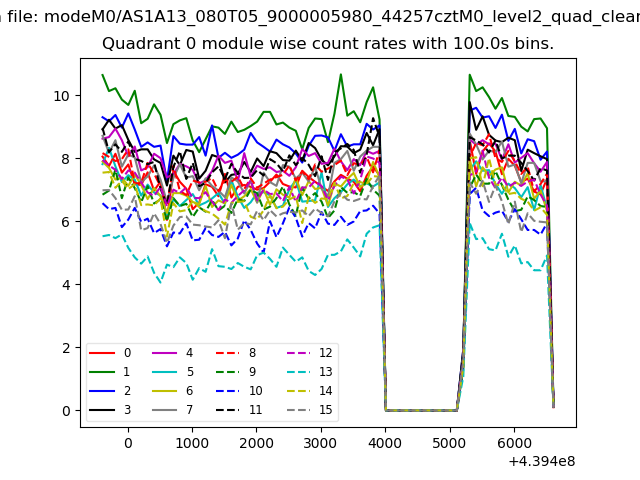 |
 |
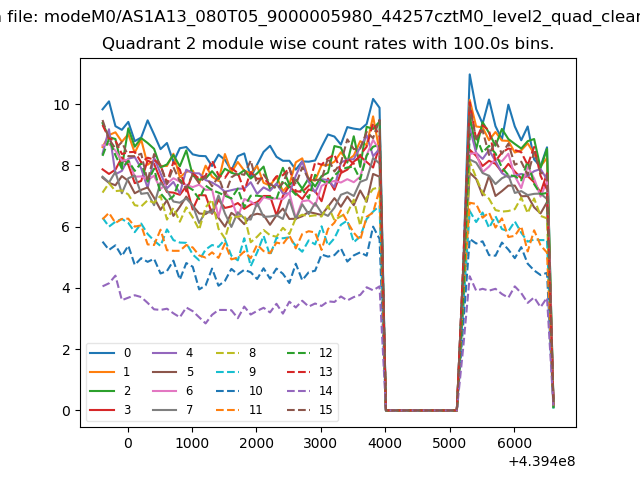
| Module-wise count rates for Quadrant B Data is divided into 100 sec bins |
 |
 |
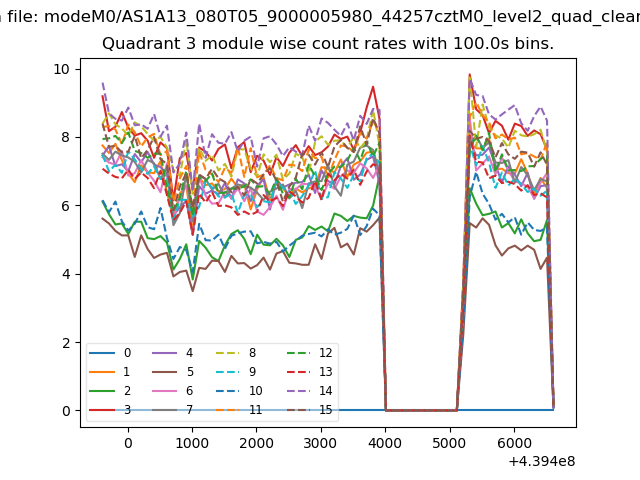
| Module-wise count rates for Quadrant C Data is divided into 100 sec bins |
 |
 |
| Module-wise count rates for Quadrant D Data is divided into 100 sec bins |
 |
 |
| Parameter | Plot |
|---|---|
| CZT HV Monitor | 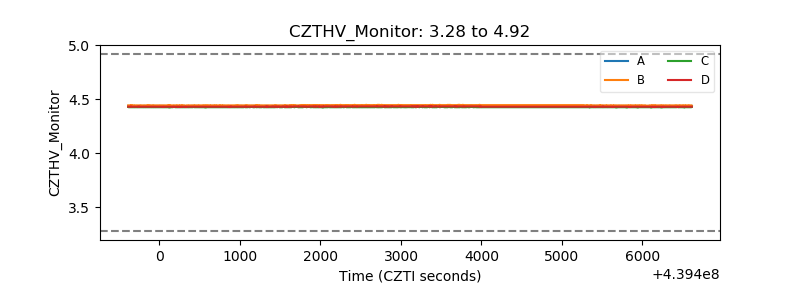 |
| D_VDD | 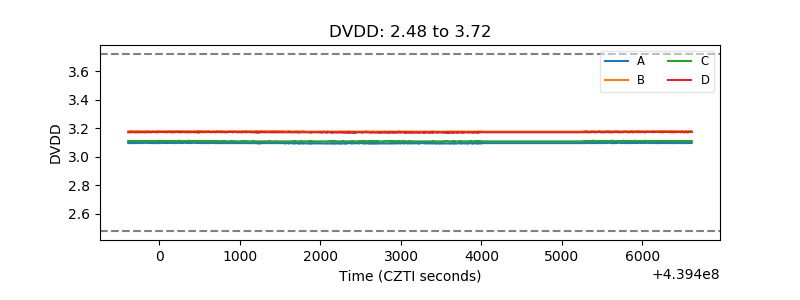 |
| Temperature 1 | 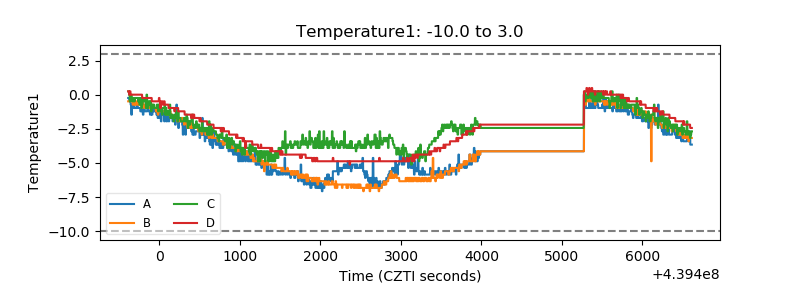 |
| Veto HV Monitor | 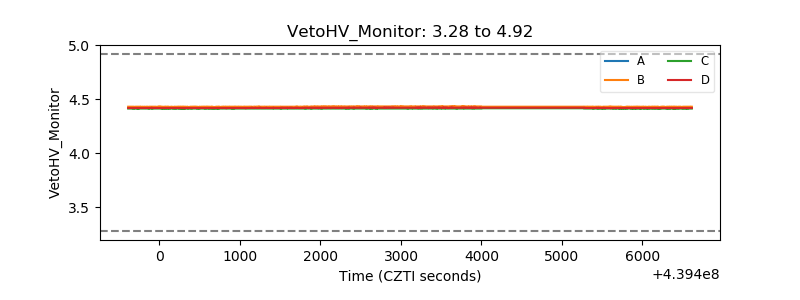 |
| Veto LLD | 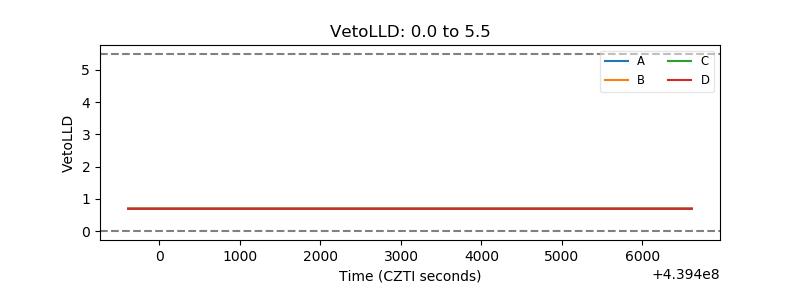 |
| Alpha Counter | 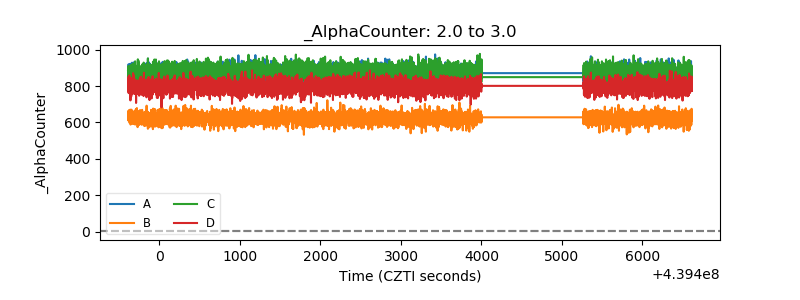 |
| _CPM_Rate | 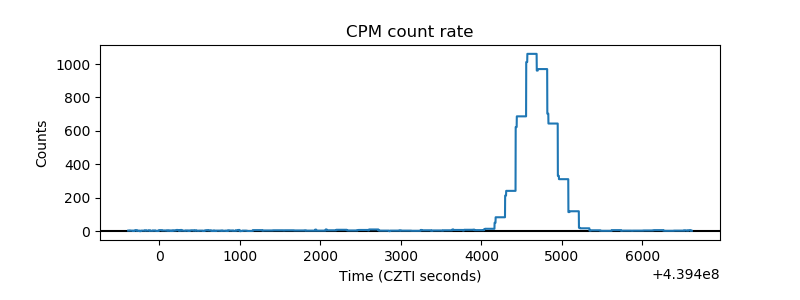 |
| CZT Counter | 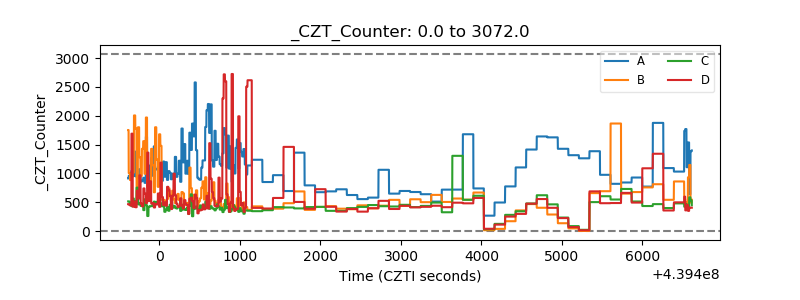 |
| +2.5 Volts monitor | 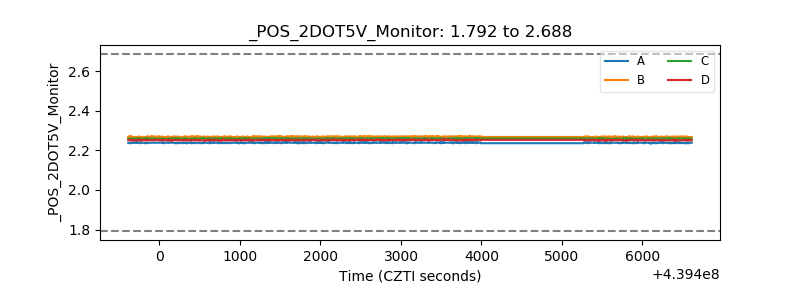 |
| +5 Volts monitor | 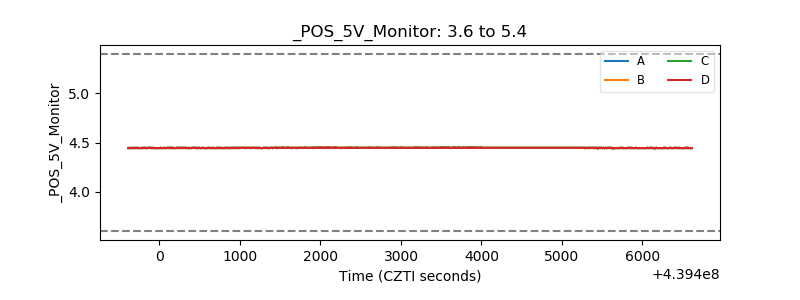 |
| _ROLL_ROT | 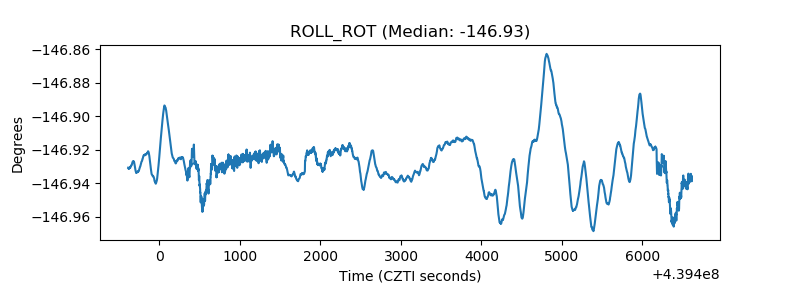 |
| _Roll_DEC | 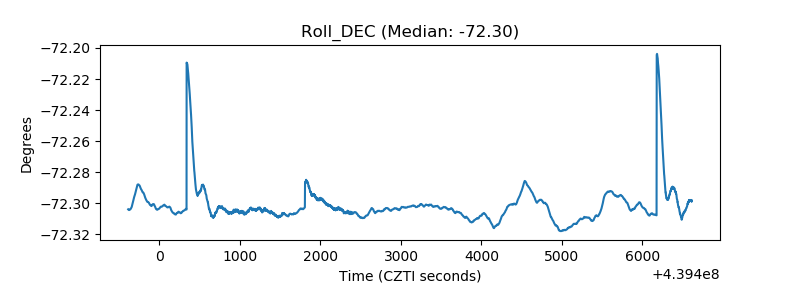 |
| _Roll_RA |  |
| Veto Counter | 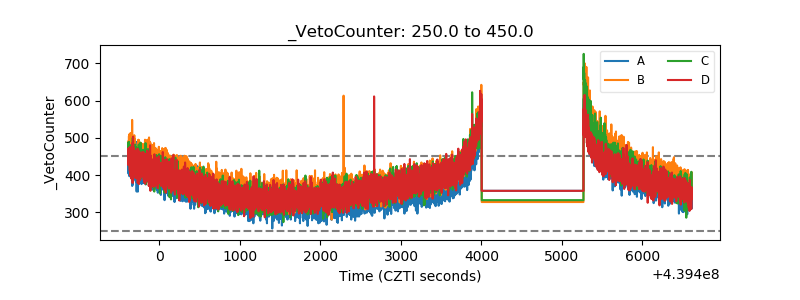 |