| Param | Original file | Final file |
|---|---|---|
| Filename | modeM0/AS1A13_080T05_9000005980_44258cztM0_level2.fits | modeM0/AS1A13_080T05_9000005980_44258cztM0_level2_quad_clean.evt |
| Size (bytes) | 469,290,240 | 104,434,560 |
| Size | 447.6 MB | 99.6 MB |
| Events in quadrant A | 5,503,561 | 704,290 |
| Events in quadrant B | 4,522,618 | 715,468 |
| Events in quadrant C | 3,008,769 | 685,786 |
| Events in quadrant D | 3,850,677 | 619,773 |
| Mode SS | |||
|---|---|---|---|
| Quadrant | BADHDUFLAG | Total packets | Discarded packets |
| A | 0 | 126 | 0 |
| B | 0 | 126 | 0 |
| C | 0 | 126 | 0 |
| D | 0 | 126 | 0 |
| Mode M9 | |||
|---|---|---|---|
| Quadrant | BADHDUFLAG | Total packets | Discarded packets |
| A | 0 | 12 | 0 |
| B | 0 | 12 | 0 |
| C | 0 | 12 | 0 |
| D | 0 | 12 | 0 |
| Mode M0 | |||
|---|---|---|---|
| Quadrant | BADHDUFLAG | Total packets | Discarded packets |
| A | 0 | 21214 | 1 |
| B | 0 | 17705 | 1 |
| C | 0 | 13456 | 1 |
| D | 0 | 15938 | 1 |
| Quadrant | Total seconds | Saturated seconds | Saturation percentage |
|---|---|---|---|
| A | 6263 | 210 | 3.353026% |
| B | 6264 | 253 | 4.038953% |
| C | 6263 | 18 | 0.287402% |
| D | 6263 | 159 | 2.538719% |
Noise dominated data is calculated using 1-second bins in cleaned event files. If a bin has >2000 counts, and if more than 50% of those come from <1% of pixels, then it is considered to be noise-dominated and hence unusable.
| Quadrant | # 1 sec bins | Bins with >0 counts | Bins with >2000 counts | High rate bins dominated by noise | Noise dominated (total time) | Noise dominated (detector-on time) | Marked lightcurve |
|---|---|---|---|---|---|---|---|
| A | 7383 | 6264 | 93 | 93 | 1.26% | 1.48% | 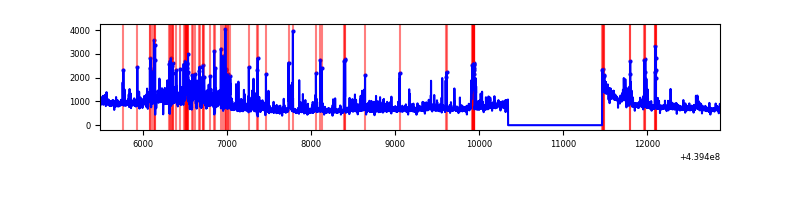 |
| B | 7384 | 6265 | 93 | 93 | 1.26% | 1.48% | 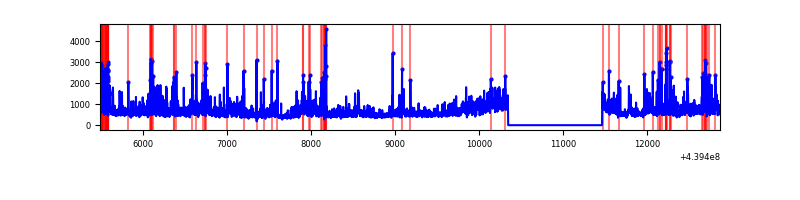 |
| C | 7383 | 6264 | 8 | 8 | 0.11% | 0.13% | 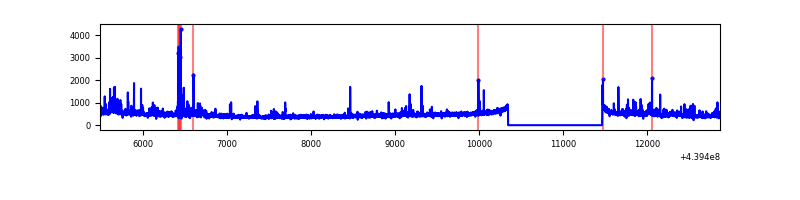 |
| D | 7383 | 6264 | 128 | 128 | 1.73% | 2.04% | 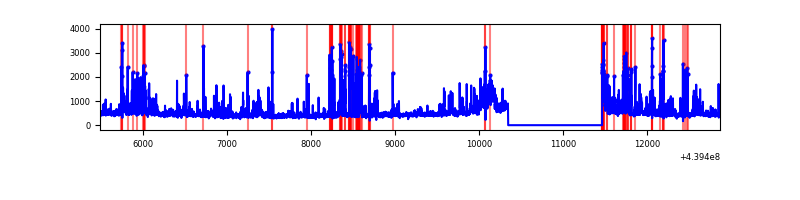 |
Top three noisy pixels from each quadrant. If the there are fewer than three noisy pixels in the level2.evt file, extra rows are filled as -1
| Pixel properties | Quadrant properties | ||||||
|---|---|---|---|---|---|---|---|
| Quadrant | DetID | PixID | Counts | Sigma | Mean | Median | Sigma |
| A | 10 | 83 | 1648662 | 11442.07 | 691 | 677 | 144.0 |
| A | 15 | 223 | 848350 | 5885.45 | 691 | 677 | 144.0 |
| A | 10 | 248 | 146300 | 1011.07 | 691 | 677 | 144.0 |
| B | 0 | 200 | 853428 | 6482.19 | 689 | 671 | 131.6 |
| B | 4 | 170 | 188983 | 1431.44 | 689 | 671 | 131.6 |
| B | 4 | 173 | 120037 | 907.35 | 689 | 671 | 131.6 |
| C | 3 | 233 | 181363 | 1147.94 | 668 | 669 | 157.4 |
| C | 4 | 254 | 143423 | 906.91 | 668 | 669 | 157.4 |
| C | 14 | 254 | 72772 | 458.07 | 668 | 669 | 157.4 |
| D | 13 | 171 | 225840 | 1337.43 | 662 | 640 | 168.4 |
| D | 5 | 235 | 216678 | 1283.02 | 662 | 640 | 168.4 |
| D | 1 | 52 | 204982 | 1213.55 | 662 | 640 | 168.4 |
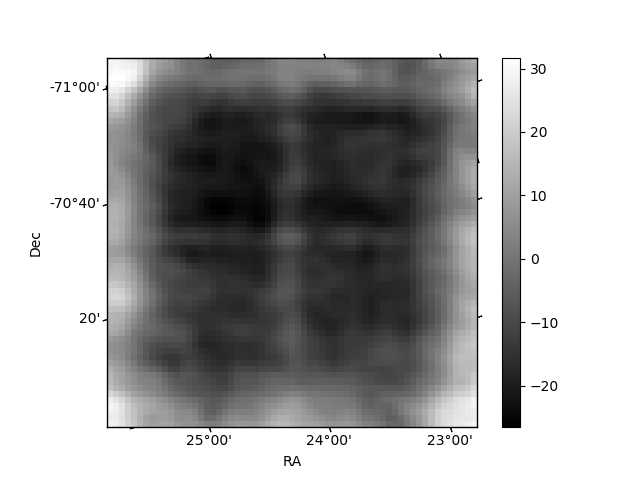
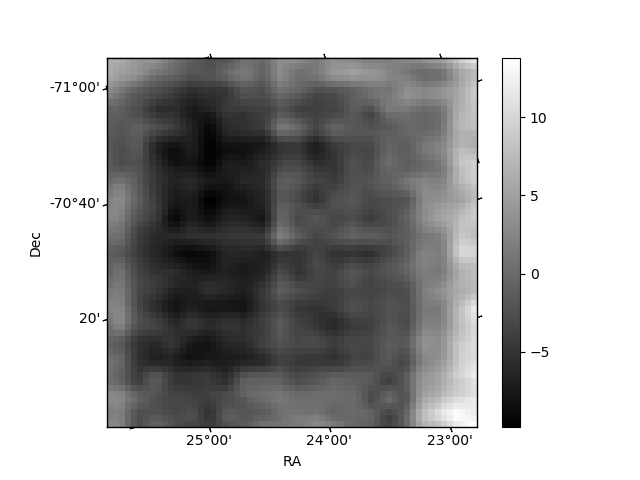
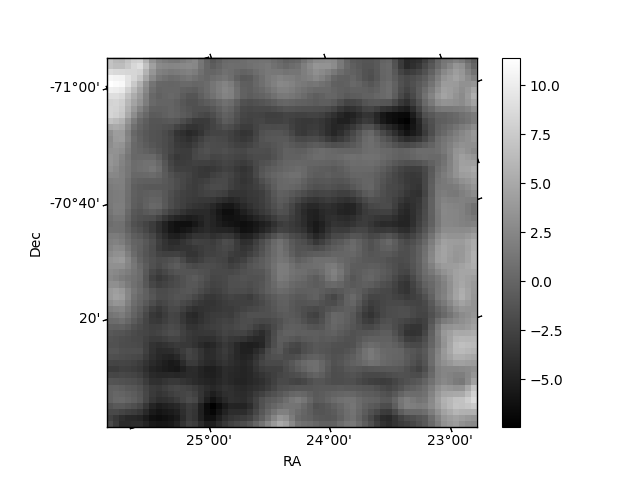
Histogram calculated using DETX and DETY for each event in the final _common_clean file
| Quadrant A | 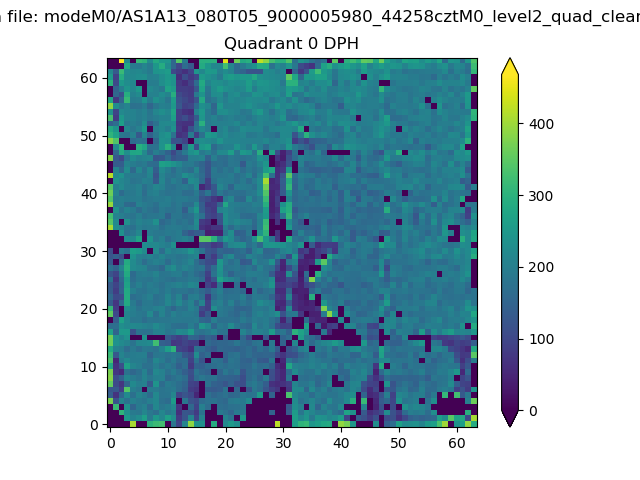 |
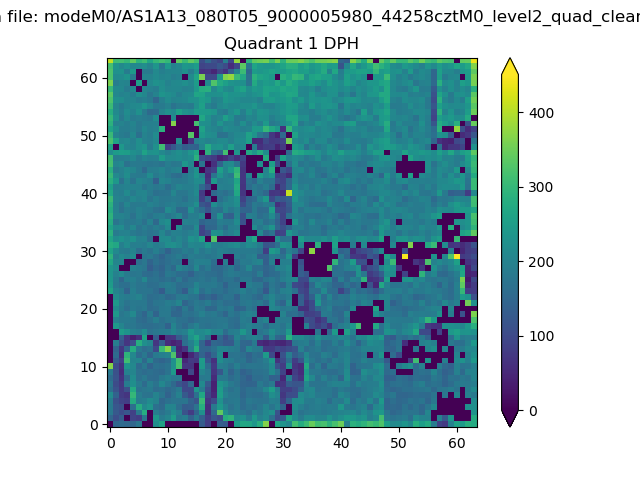 |
Quadrant B |
|---|---|---|---|
| Quadrant D | 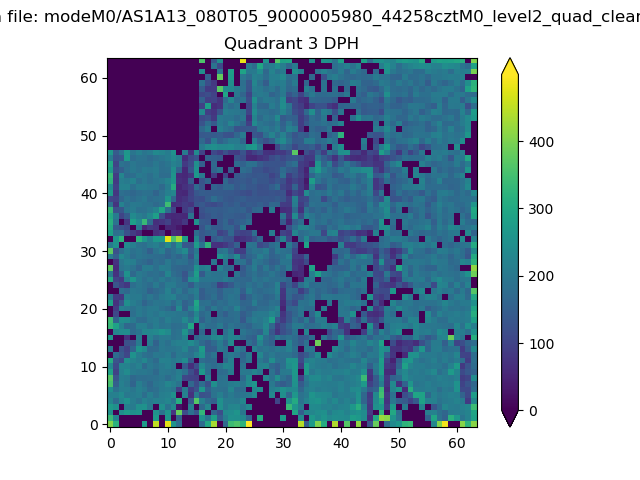 |
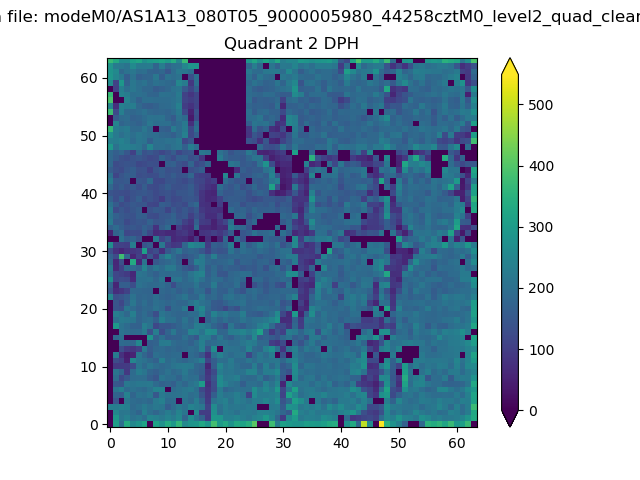 |
Quadrant C |
| Plot type | Count rate plots | Images |
|---|---|---|
| Comparison with Poisson distribution Blue bars denote a histogram of data divided into 1 sec bins. Red curve is a Poisson curve with rate = median count rate of data. |
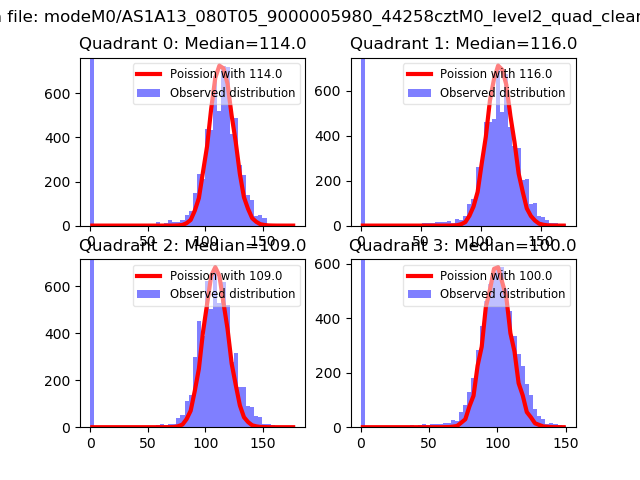 |
 |
| Quadrant-wise count rates Data is divided into 100 sec bins |
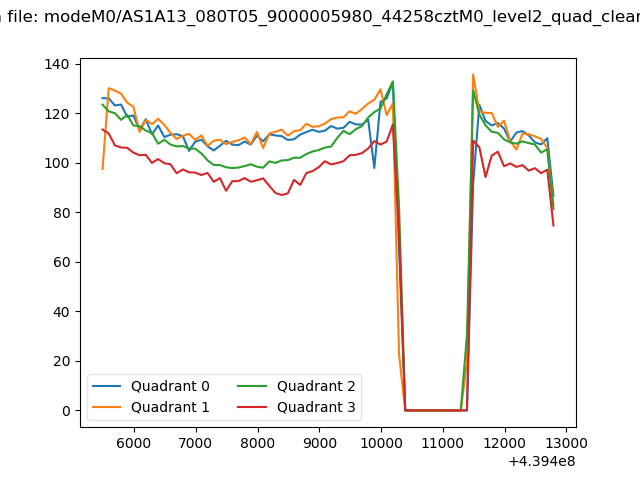 |
|
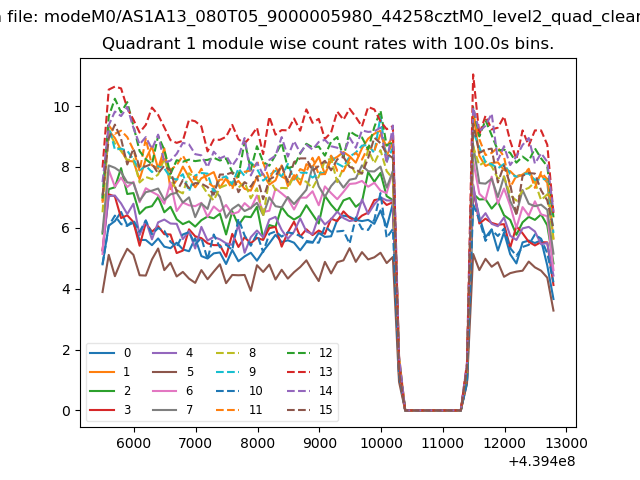
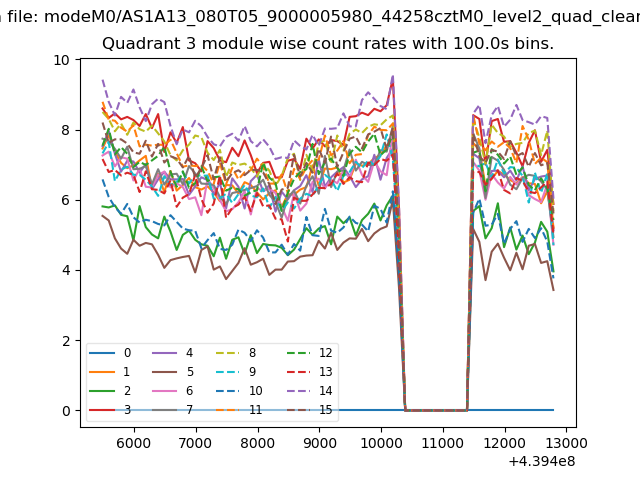
| Module-wise count rates for Quadrant A Data is divided into 100 sec bins |
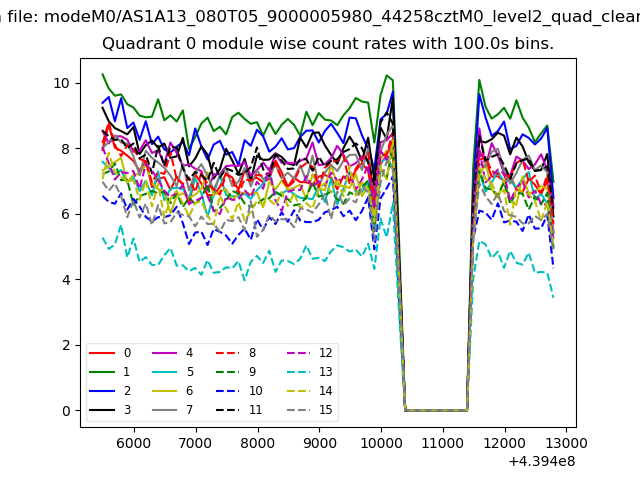 |
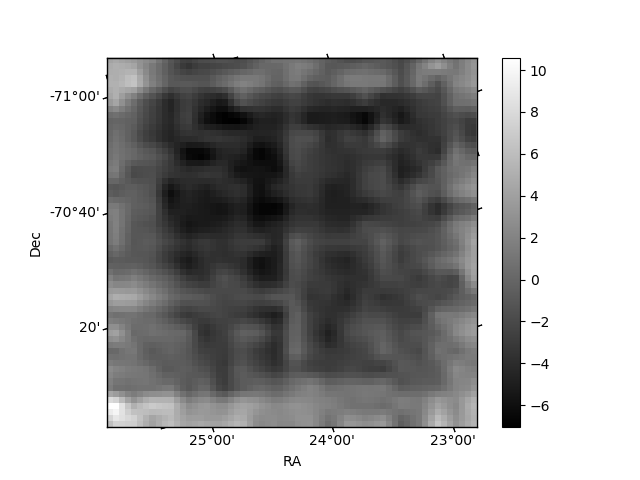 |
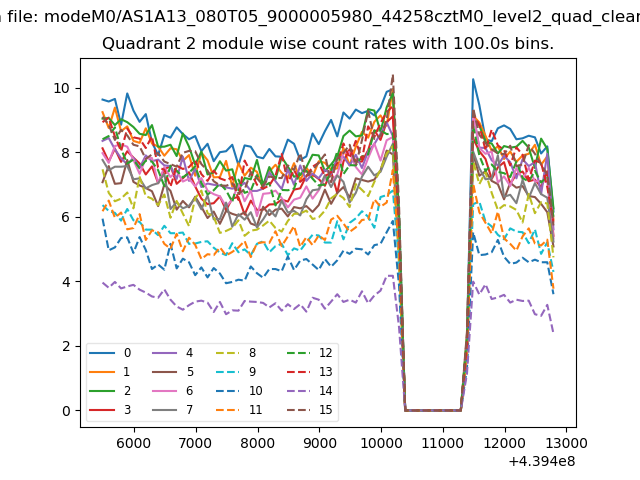
| Module-wise count rates for Quadrant B Data is divided into 100 sec bins |
 |
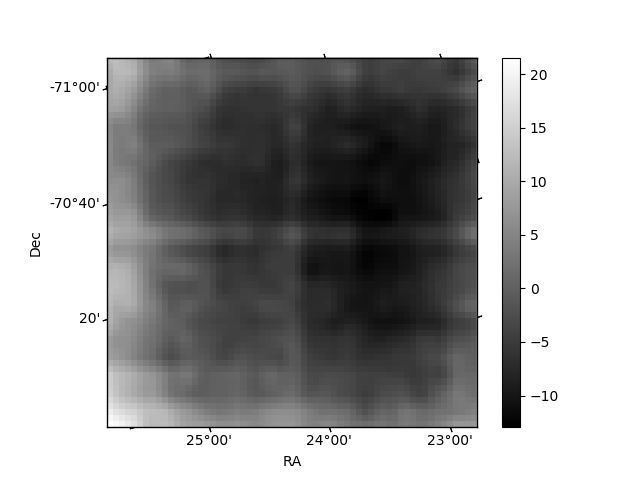 |
| Module-wise count rates for Quadrant C Data is divided into 100 sec bins |
 |
 |
| Module-wise count rates for Quadrant D Data is divided into 100 sec bins |
 |
 |
| Parameter | Plot |
|---|---|
| CZT HV Monitor | 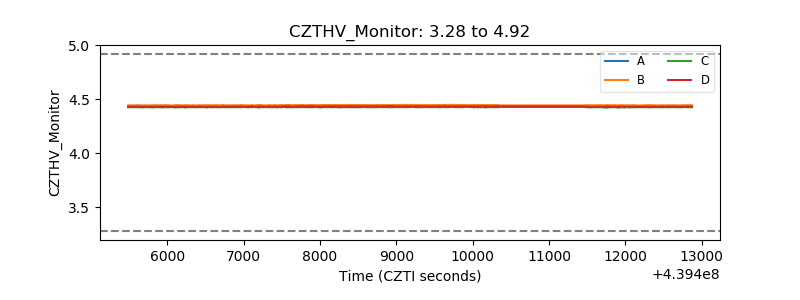 |
| D_VDD | 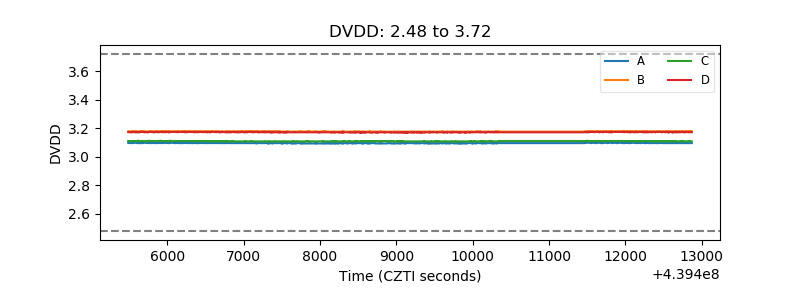 |
| Temperature 1 | 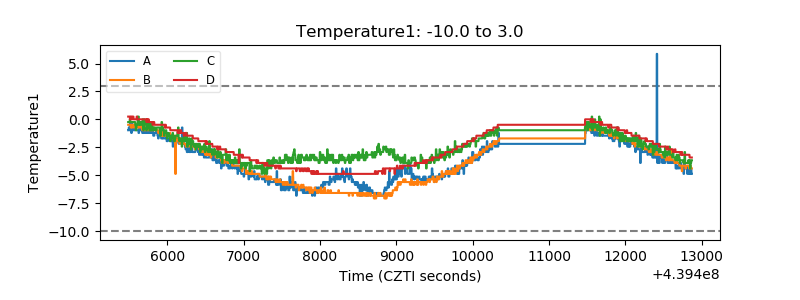 |
| Veto HV Monitor | 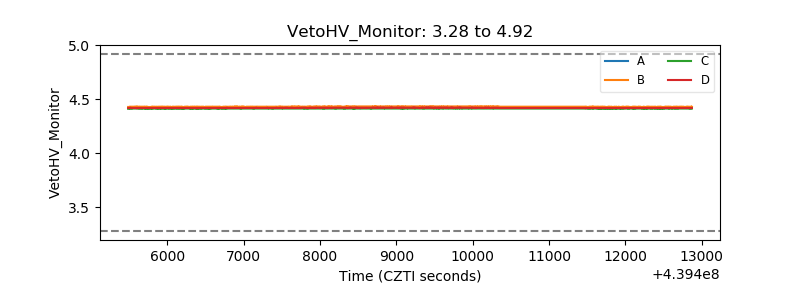 |
| Veto LLD | 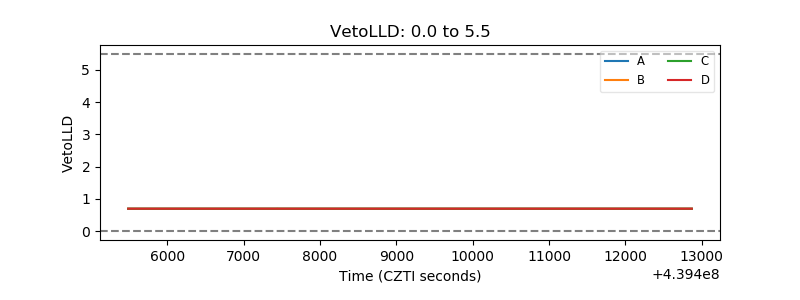 |
| Alpha Counter | 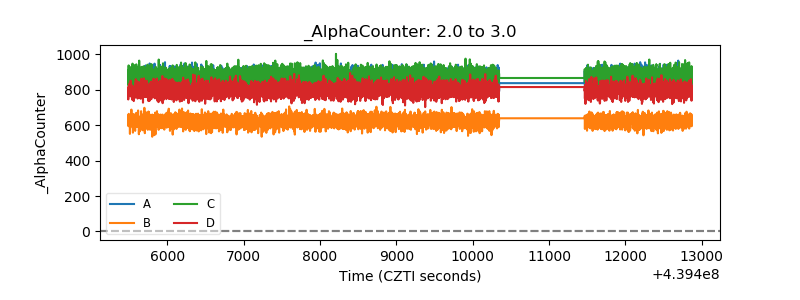 |
| _CPM_Rate |  |
| CZT Counter | 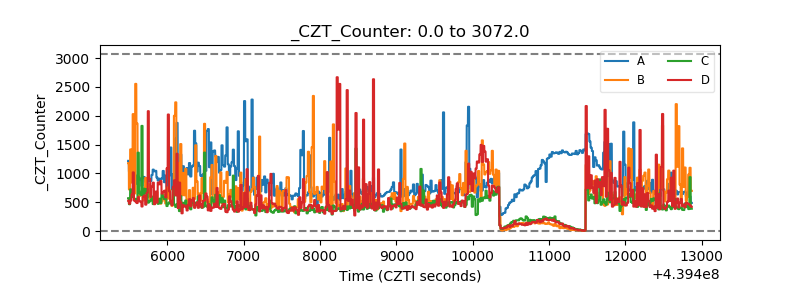 |
| +2.5 Volts monitor | 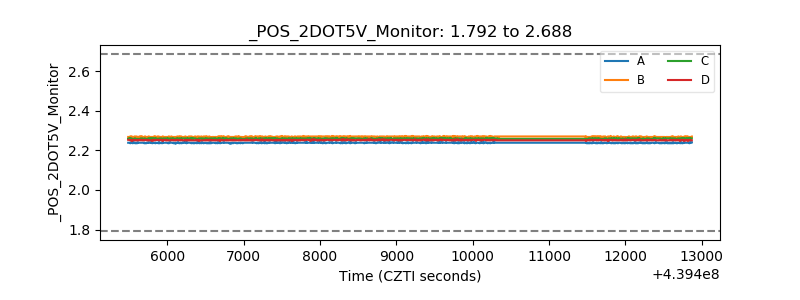 |
| +5 Volts monitor | 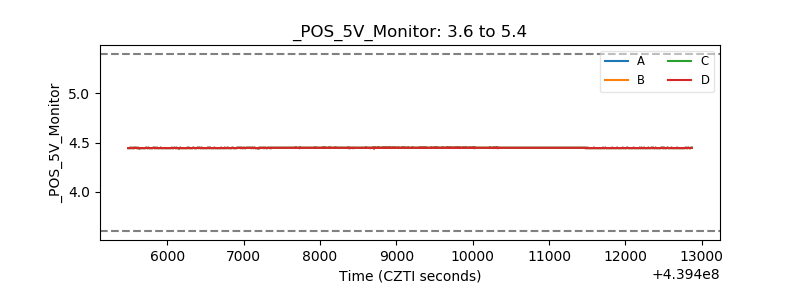 |
| _ROLL_ROT | 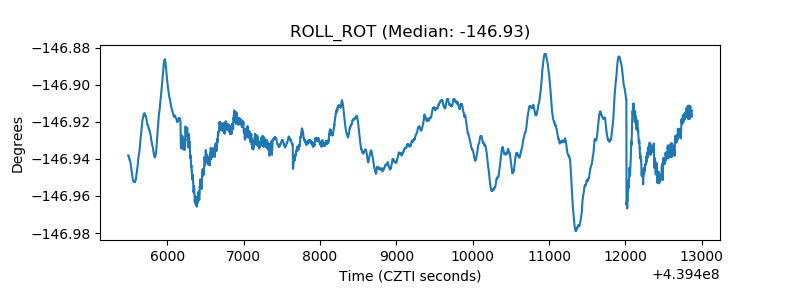 |
| _Roll_DEC | 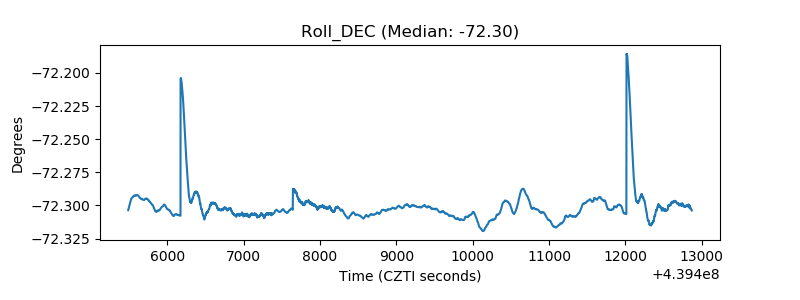 |
| _Roll_RA | 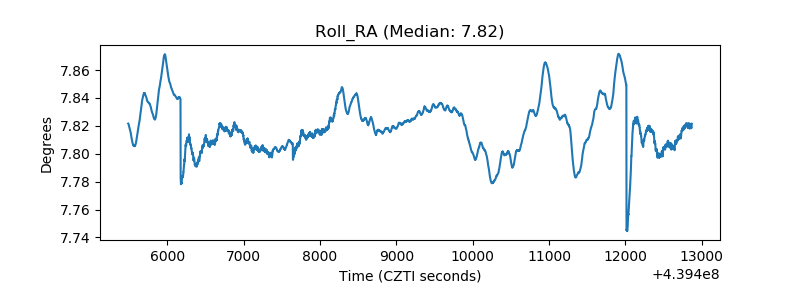 |
| Veto Counter | 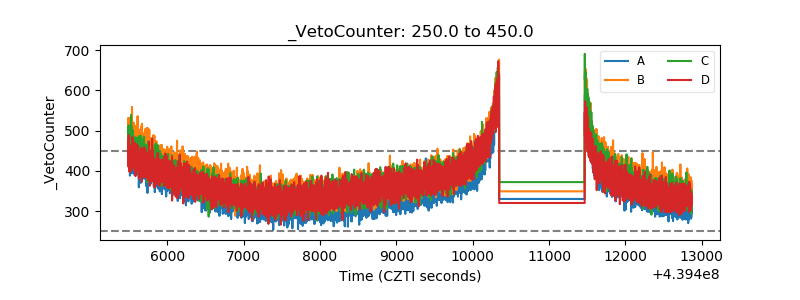 |