| Param | Original file | Final file |
|---|---|---|
| Filename | modeM0/AS1A13_080T05_9000005980_44259cztM0_level2.fits | modeM0/AS1A13_080T05_9000005980_44259cztM0_level2_quad_clean.evt |
| Size (bytes) | 486,789,120 | 108,907,200 |
| Size | 464.2 MB | 103.9 MB |
| Events in quadrant A | 5,458,480 | 724,502 |
| Events in quadrant B | 4,463,595 | 746,875 |
| Events in quadrant C | 3,167,385 | 716,758 |
| Events in quadrant D | 4,408,980 | 641,523 |
| Mode SS | |||
|---|---|---|---|
| Quadrant | BADHDUFLAG | Total packets | Discarded packets |
| A | 0 | 136 | 0 |
| B | 0 | 136 | 0 |
| C | 0 | 136 | 0 |
| D | 0 | 136 | 0 |
| Mode M9 | |||
|---|---|---|---|
| Quadrant | BADHDUFLAG | Total packets | Discarded packets |
| A | 0 | 10 | 0 |
| B | 0 | 11 | 0 |
| C | 0 | 11 | 0 |
| D | 0 | 11 | 0 |
| Mode M0 | |||
|---|---|---|---|
| Quadrant | BADHDUFLAG | Total packets | Discarded packets |
| A | 0 | 21305 | 2 |
| B | 0 | 18025 | 2 |
| C | 0 | 14372 | 2 |
| D | 0 | 17770 | 2 |
| Quadrant | Total seconds | Saturated seconds | Saturation percentage |
|---|---|---|---|
| A | 6712 | 264 | 3.933254% |
| B | 6712 | 189 | 2.815852% |
| C | 6712 | 34 | 0.506555% |
| D | 6712 | 203 | 3.024434% |
Noise dominated data is calculated using 1-second bins in cleaned event files. If a bin has >2000 counts, and if more than 50% of those come from <1% of pixels, then it is considered to be noise-dominated and hence unusable.
| Quadrant | # 1 sec bins | Bins with >0 counts | Bins with >2000 counts | High rate bins dominated by noise | Noise dominated (total time) | Noise dominated (detector-on time) | Marked lightcurve |
|---|---|---|---|---|---|---|---|
| A | 7612 | 6713 | 107 | 107 | 1.41% | 1.59% | 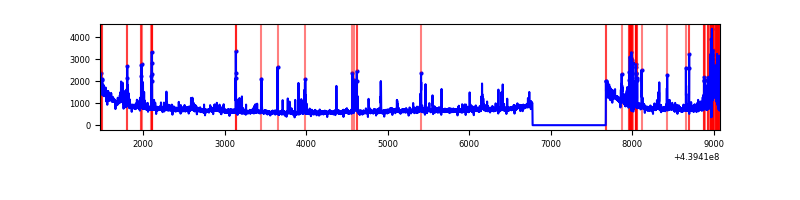 |
| B | 7612 | 6713 | 60 | 60 | 0.79% | 0.89% | 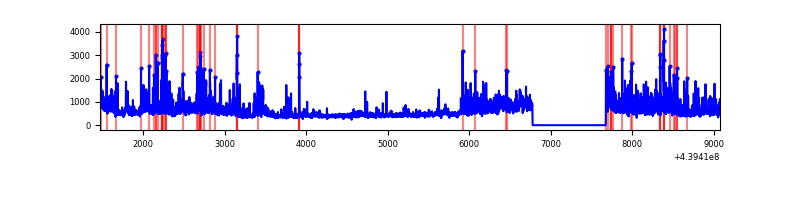 |
| C | 7612 | 6713 | 24 | 24 | 0.32% | 0.36% | 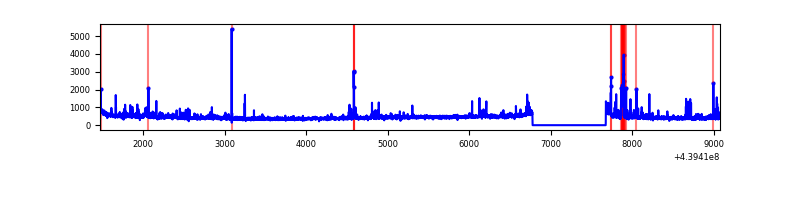 |
| D | 7612 | 6713 | 161 | 161 | 2.12% | 2.40% | 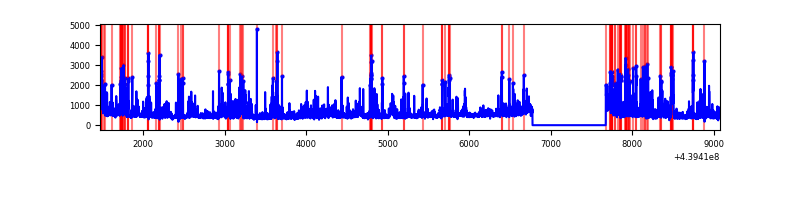 |
Top three noisy pixels from each quadrant. If the there are fewer than three noisy pixels in the level2.evt file, extra rows are filled as -1
| Pixel properties | Quadrant properties | ||||||
|---|---|---|---|---|---|---|---|
| Quadrant | DetID | PixID | Counts | Sigma | Mean | Median | Sigma |
| A | 10 | 83 | 1852676 | 12251.47 | 726 | 712 | 151.2 |
| A | 15 | 223 | 550372 | 3636.22 | 726 | 712 | 151.2 |
| A | 10 | 248 | 88754 | 582.43 | 726 | 712 | 151.2 |
| B | 0 | 200 | 522851 | 3690.07 | 732 | 712 | 141.5 |
| B | 4 | 173 | 239777 | 1689.53 | 732 | 712 | 141.5 |
| B | 0 | 230 | 211750 | 1491.45 | 732 | 712 | 141.5 |
| C | 4 | 254 | 158048 | 936.63 | 709 | 712 | 168.0 |
| C | 3 | 233 | 129648 | 767.56 | 709 | 712 | 168.0 |
| C | 14 | 254 | 106114 | 627.46 | 709 | 712 | 168.0 |
| D | 5 | 235 | 456090 | 2584.15 | 698 | 675 | 176.2 |
| D | 13 | 171 | 298159 | 1688.01 | 698 | 675 | 176.2 |
| D | 12 | 233 | 192829 | 1090.34 | 698 | 675 | 176.2 |
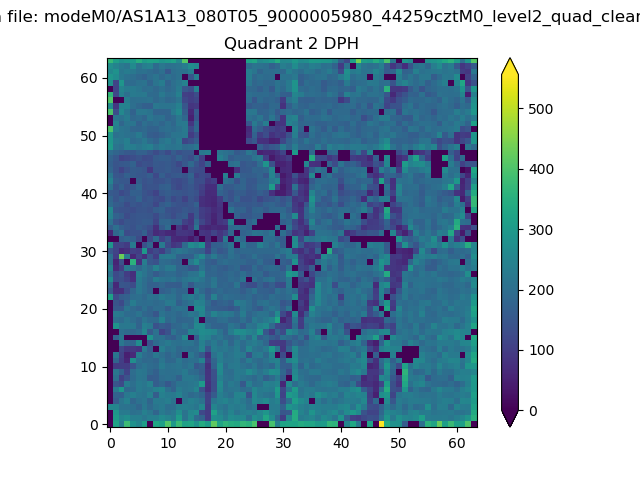
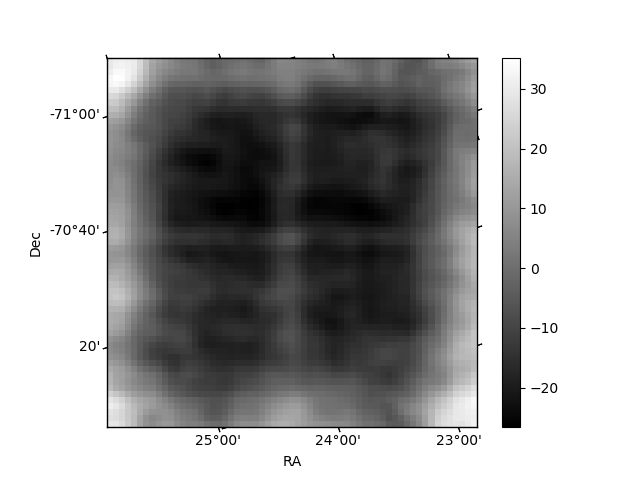
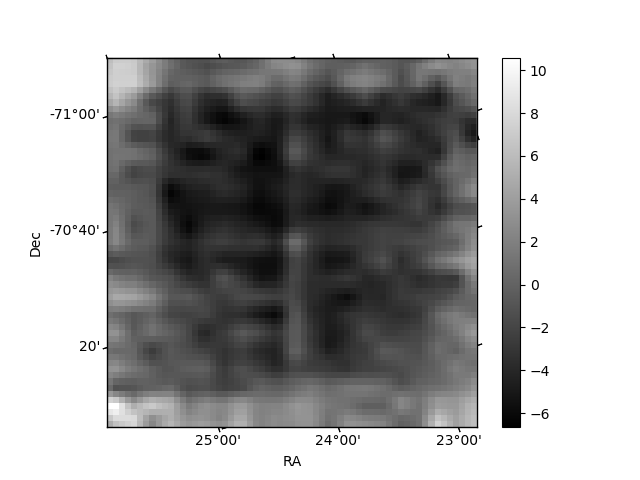
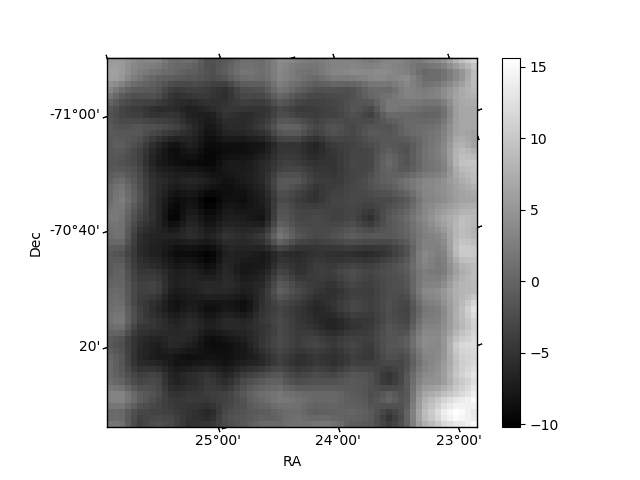
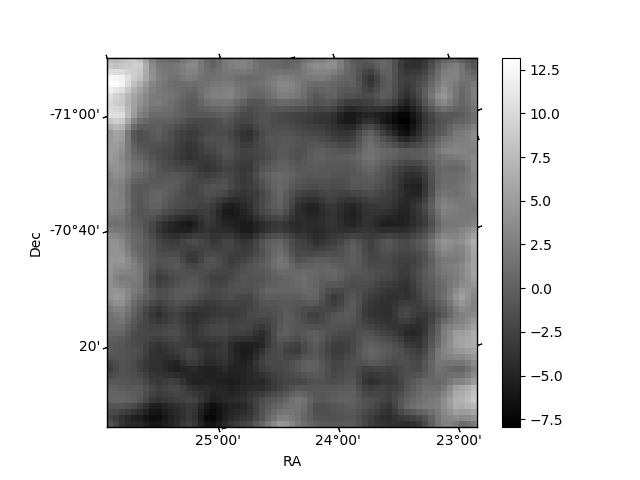
Histogram calculated using DETX and DETY for each event in the final _common_clean file
| Quadrant A | 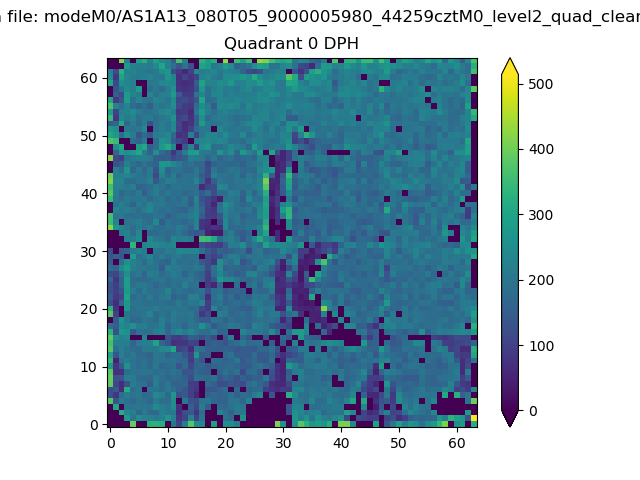 |
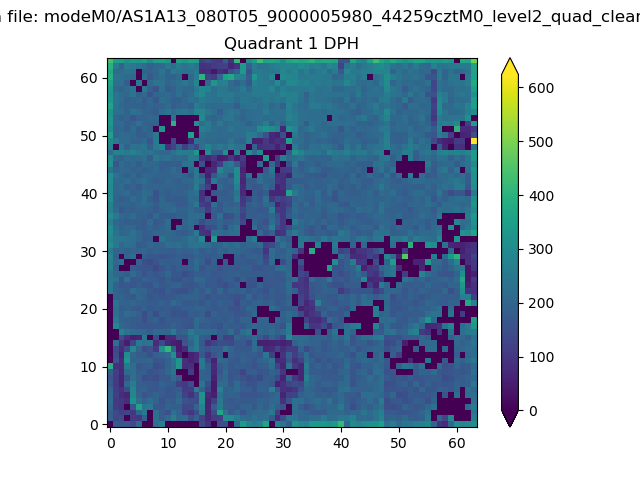 |
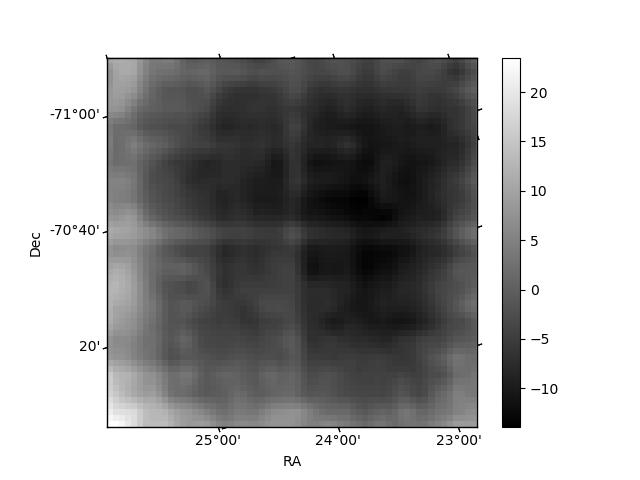
Quadrant B |
|---|---|---|---|
| Quadrant D | 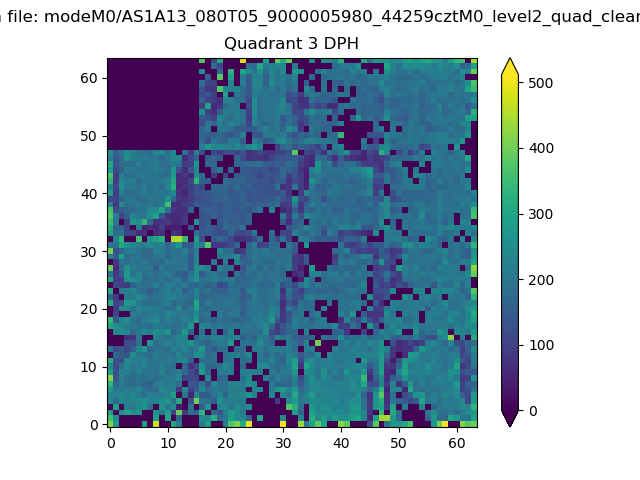 |
 |
Quadrant C |
| Plot type | Count rate plots | Images |
|---|---|---|
| Comparison with Poisson distribution Blue bars denote a histogram of data divided into 1 sec bins. Red curve is a Poisson curve with rate = median count rate of data. |
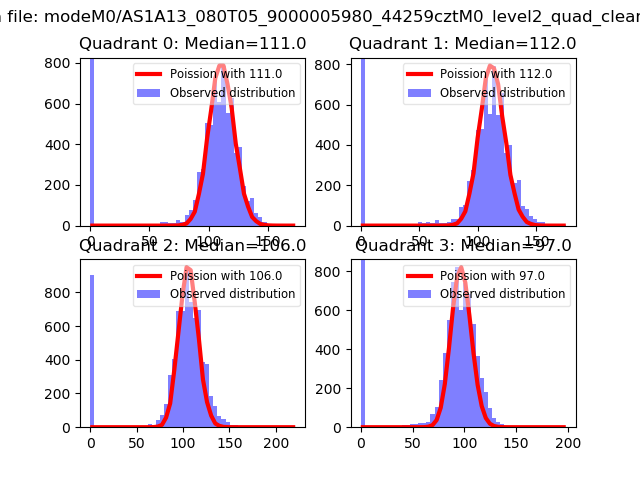 |
 |
| Quadrant-wise count rates Data is divided into 100 sec bins |
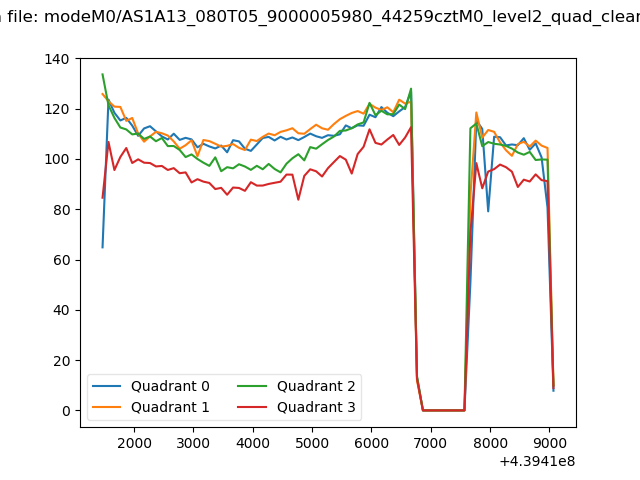 |
|
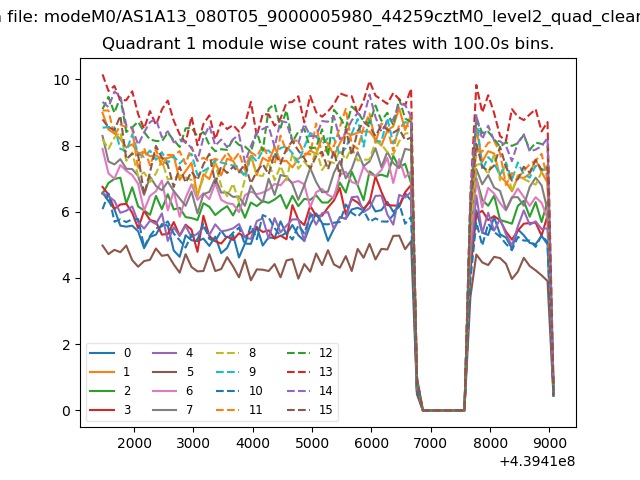
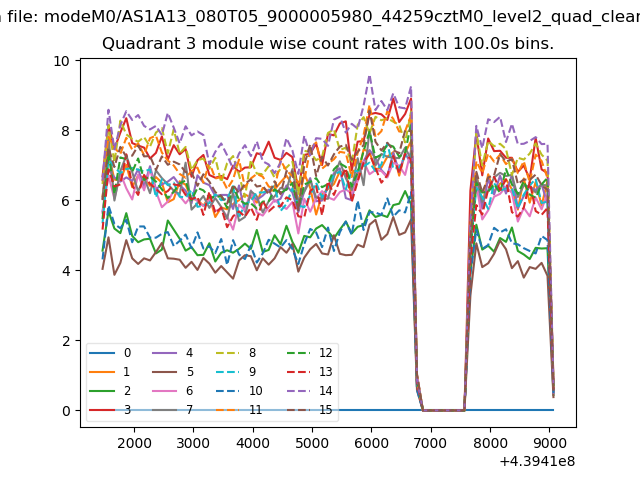
| Module-wise count rates for Quadrant A Data is divided into 100 sec bins |
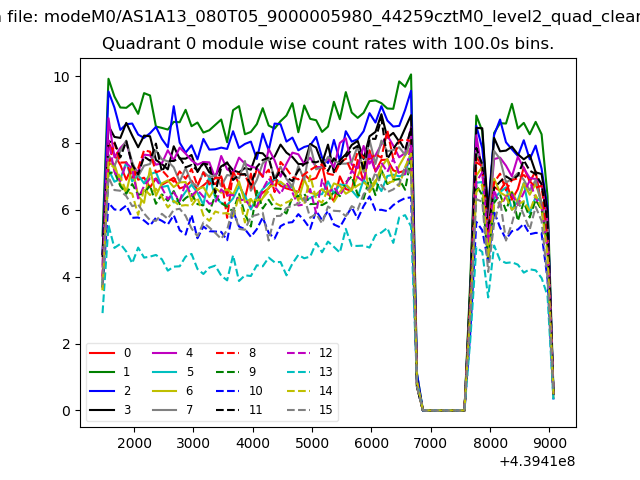 |
 |
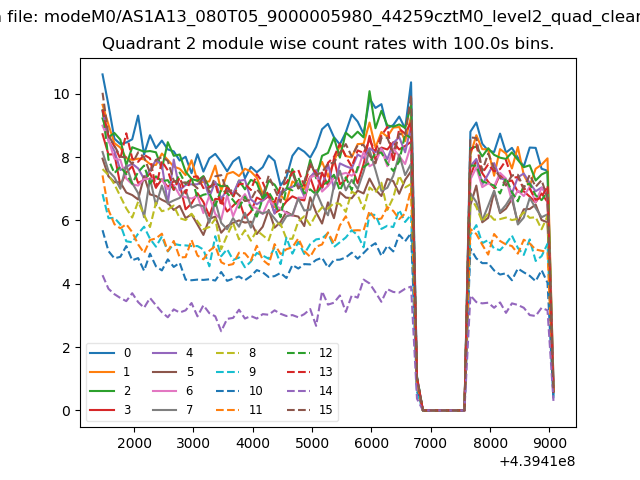
| Module-wise count rates for Quadrant B Data is divided into 100 sec bins |
 |
 |
| Module-wise count rates for Quadrant C Data is divided into 100 sec bins |
 |
 |
| Module-wise count rates for Quadrant D Data is divided into 100 sec bins |
 |
 |
| Parameter | Plot |
|---|---|
| CZT HV Monitor | 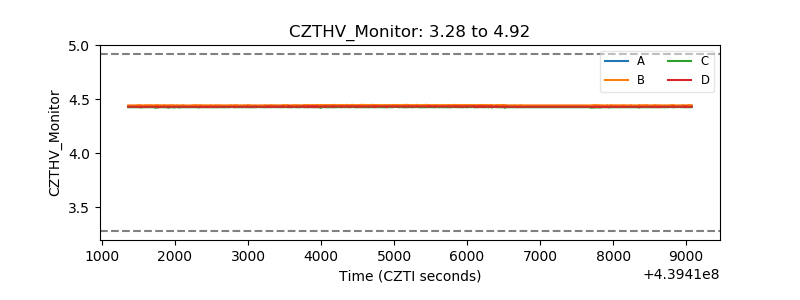 |
| D_VDD | 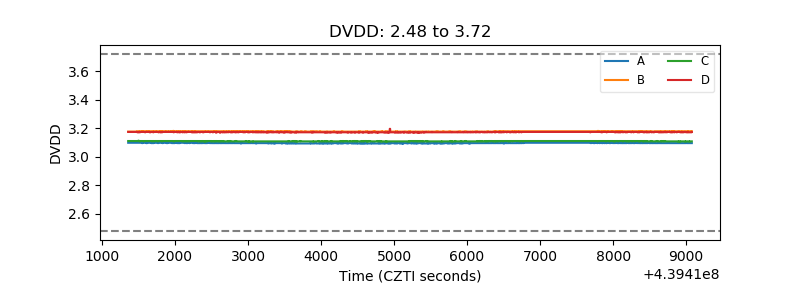 |
| Temperature 1 | 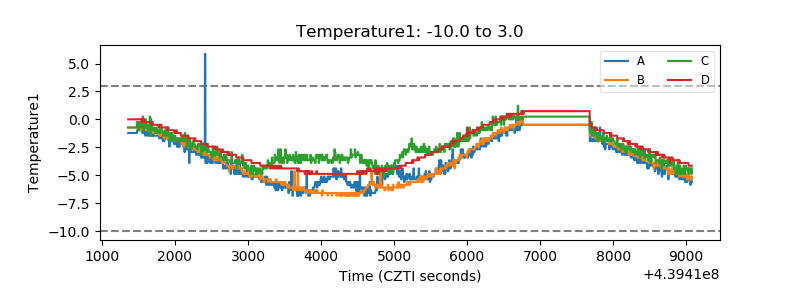 |
| Veto HV Monitor | 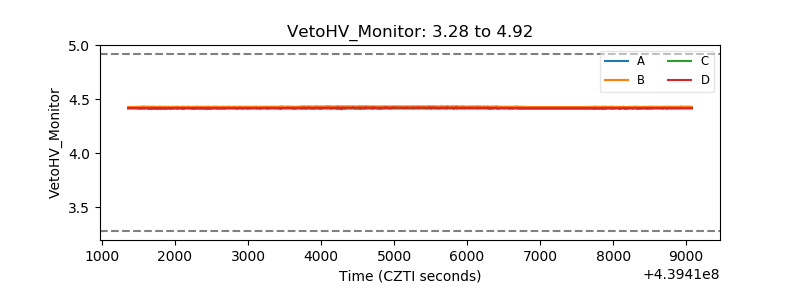 |
| Veto LLD | 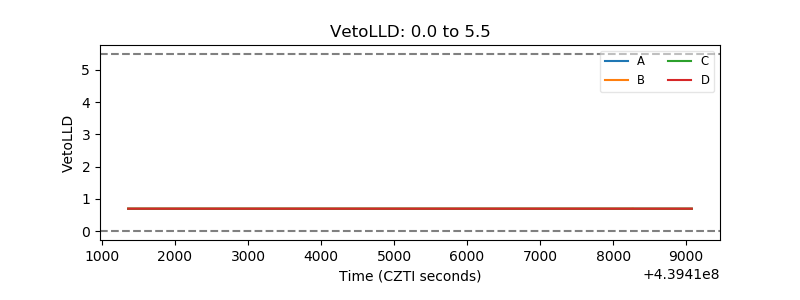 |
| Alpha Counter | 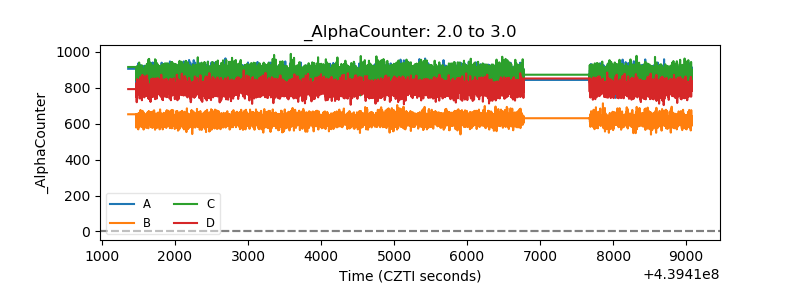 |
| _CPM_Rate | 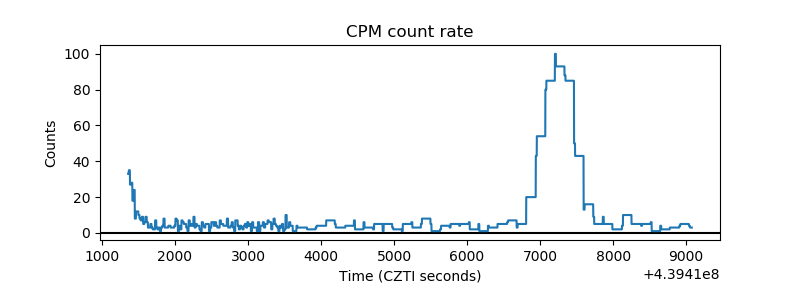 |
| CZT Counter | 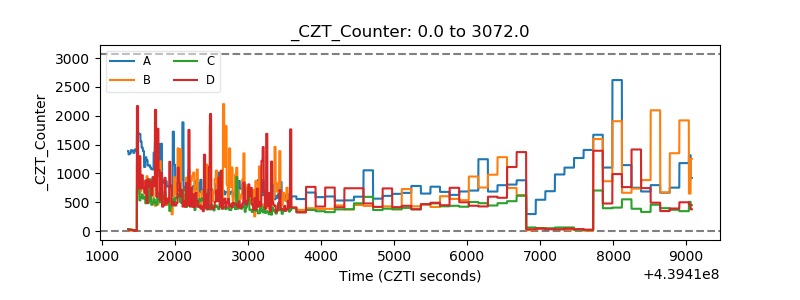 |
| +2.5 Volts monitor | 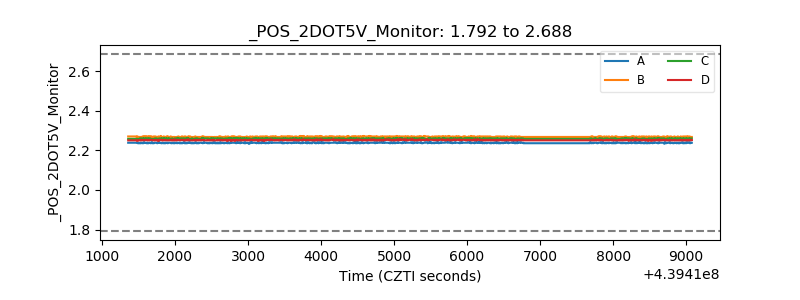 |
| +5 Volts monitor | 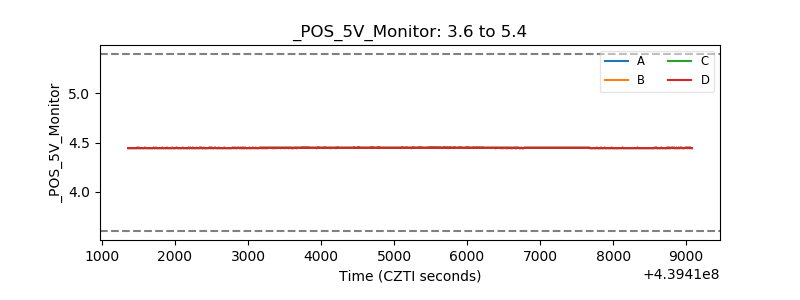 |
| _ROLL_ROT | 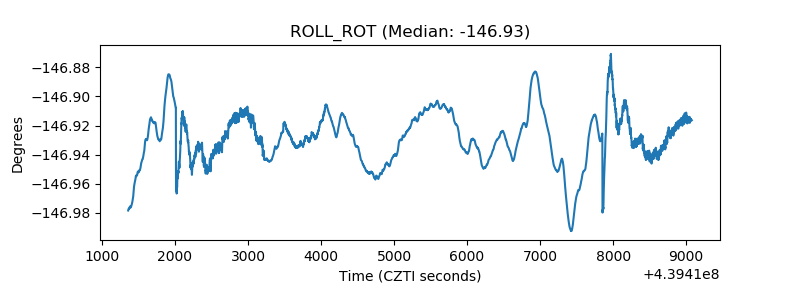 |
| _Roll_DEC | 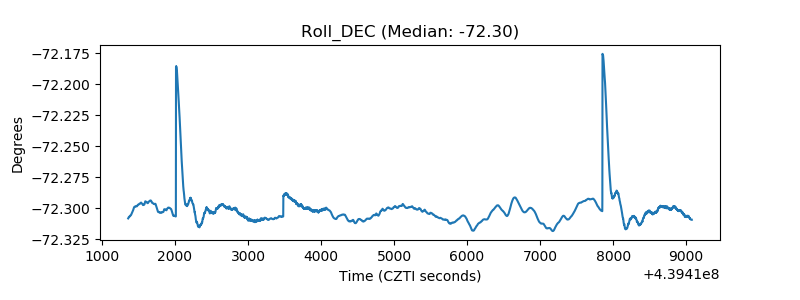 |
| _Roll_RA | 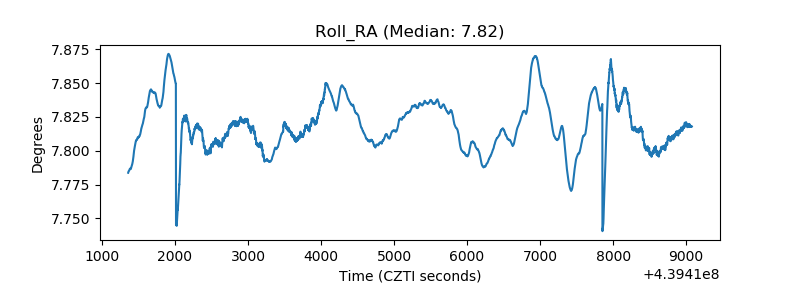 |
| Veto Counter | 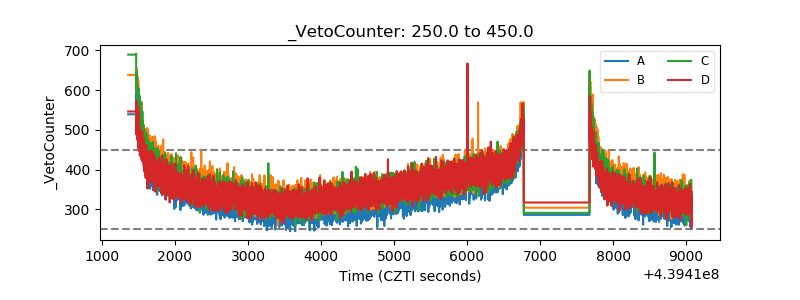 |