| Param | Original file | Final file |
|---|---|---|
| Filename | modeM0/AS1A13_080T05_9000005980_44260cztM0_level2.fits | modeM0/AS1A13_080T05_9000005980_44260cztM0_level2_quad_clean.evt |
| Size (bytes) | 580,610,880 | 113,532,480 |
| Size | 553.7 MB | 108.3 MB |
| Events in quadrant A | 7,496,913 | 703,528 |
| Events in quadrant B | 4,628,761 | 791,473 |
| Events in quadrant C | 3,471,512 | 760,483 |
| Events in quadrant D | 5,328,856 | 673,754 |
| Mode SS | |||
|---|---|---|---|
| Quadrant | BADHDUFLAG | Total packets | Discarded packets |
| A | 0 | 146 | 0 |
| B | 0 | 146 | 0 |
| C | 0 | 146 | 0 |
| D | 0 | 146 | 0 |
| Mode M9 | |||
|---|---|---|---|
| Quadrant | BADHDUFLAG | Total packets | Discarded packets |
| A | 0 | 10 | 0 |
| B | 0 | 11 | 0 |
| C | 0 | 11 | 0 |
| D | 0 | 11 | 0 |
| Mode M0 | |||
|---|---|---|---|
| Quadrant | BADHDUFLAG | Total packets | Discarded packets |
| A | 0 | 27684 | 2 |
| B | 0 | 18870 | 2 |
| C | 0 | 15788 | 3 |
| D | 0 | 20970 | 2 |
| Quadrant | Total seconds | Saturated seconds | Saturation percentage |
|---|---|---|---|
| A | 7304 | 929 | 12.719058% |
| B | 7304 | 212 | 2.902519% |
| C | 7303 | 73 | 0.999589% |
| D | 7303 | 377 | 5.162262% |
Noise dominated data is calculated using 1-second bins in cleaned event files. If a bin has >2000 counts, and if more than 50% of those come from <1% of pixels, then it is considered to be noise-dominated and hence unusable.
| Quadrant | # 1 sec bins | Bins with >0 counts | Bins with >2000 counts | High rate bins dominated by noise | Noise dominated (total time) | Noise dominated (detector-on time) | Marked lightcurve |
|---|---|---|---|---|---|---|---|
| A | 7674 | 7305 | 501 | 501 | 6.53% | 6.86% | 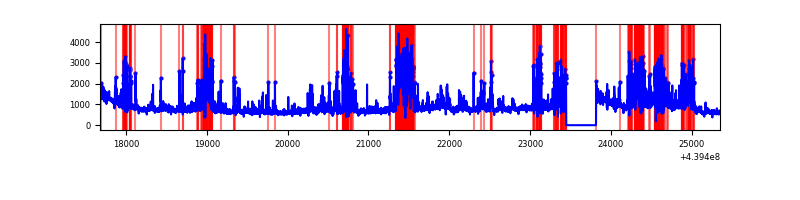 |
| B | 7674 | 7305 | 47 | 47 | 0.61% | 0.64% | 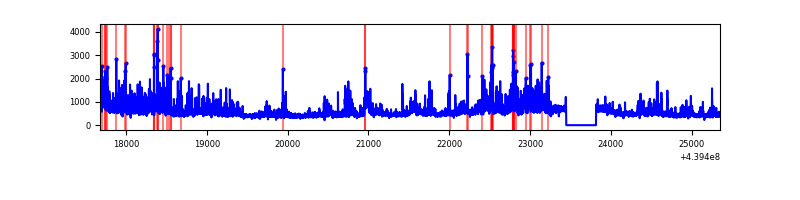 |
| C | 7673 | 7304 | 29 | 29 | 0.38% | 0.40% | 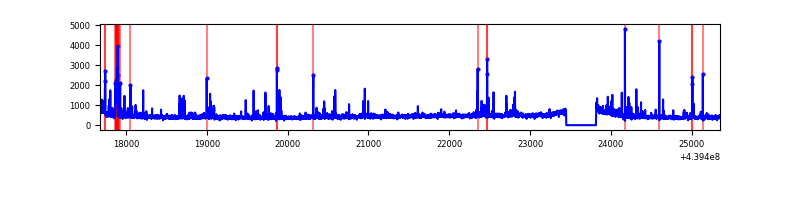 |
| D | 7673 | 7304 | 294 | 294 | 3.83% | 4.03% | 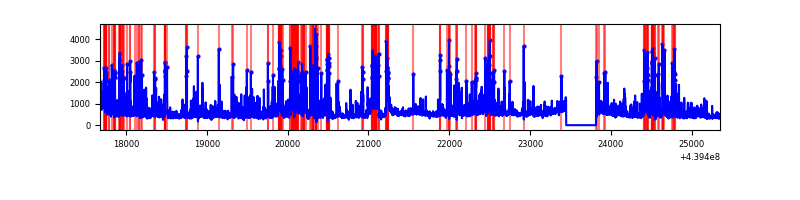 |
Top three noisy pixels from each quadrant. If the there are fewer than three noisy pixels in the level2.evt file, extra rows are filled as -1
| Pixel properties | Quadrant properties | ||||||
|---|---|---|---|---|---|---|---|
| Quadrant | DetID | PixID | Counts | Sigma | Mean | Median | Sigma |
| A | 15 | 223 | 2484153 | 15744.81 | 754 | 738 | 157.7 |
| A | 10 | 83 | 1853685 | 11747.65 | 754 | 738 | 157.7 |
| A | 7 | 3 | 124693 | 785.87 | 754 | 738 | 157.7 |
| B | 0 | 189 | 227367 | 1469.12 | 792 | 770 | 154.2 |
| B | 4 | 170 | 218494 | 1411.59 | 792 | 770 | 154.2 |
| B | 4 | 173 | 211562 | 1366.65 | 792 | 770 | 154.2 |
| C | 14 | 254 | 186457 | 1025.43 | 771 | 773 | 181.1 |
| C | 3 | 233 | 128094 | 703.12 | 771 | 773 | 181.1 |
| C | 4 | 254 | 93580 | 512.52 | 771 | 773 | 181.1 |
| D | 13 | 171 | 853452 | 4419.75 | 759 | 732 | 192.9 |
| D | 12 | 233 | 297136 | 1536.3 | 759 | 732 | 192.9 |
| D | 1 | 52 | 269549 | 1393.31 | 759 | 732 | 192.9 |
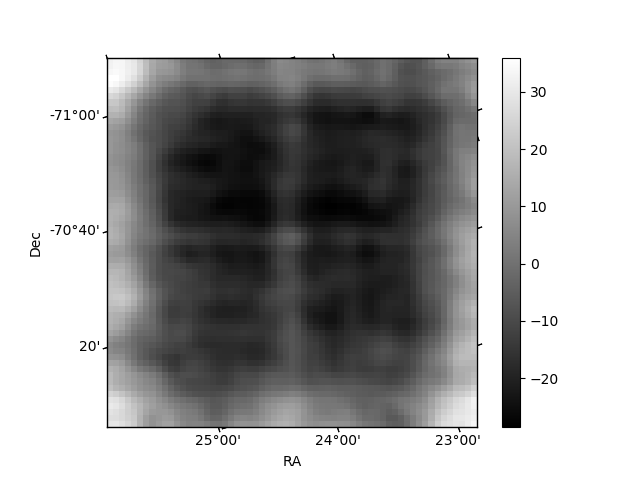
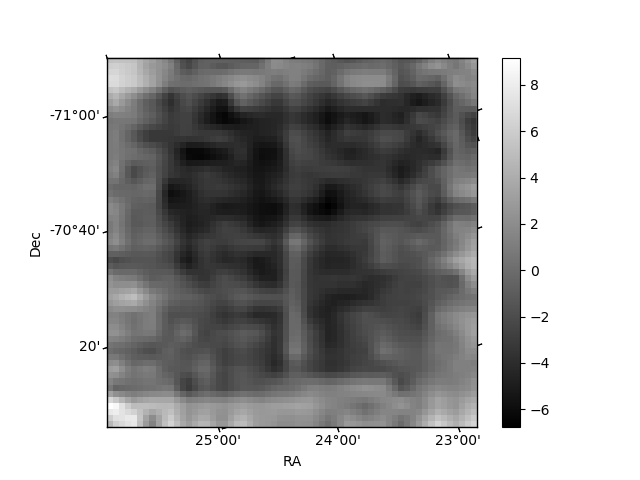
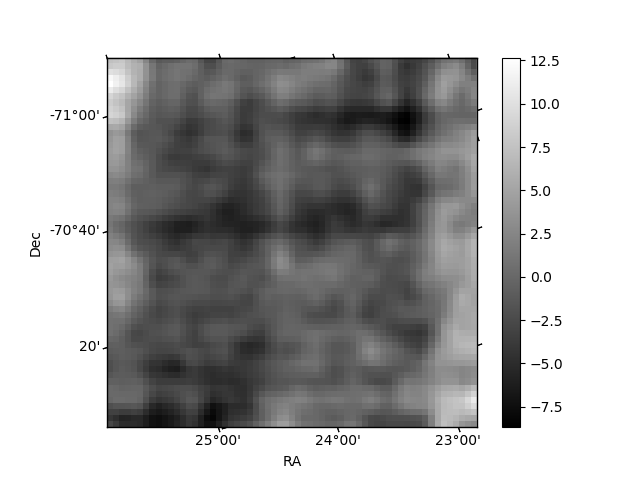
Histogram calculated using DETX and DETY for each event in the final _common_clean file
| Quadrant A | 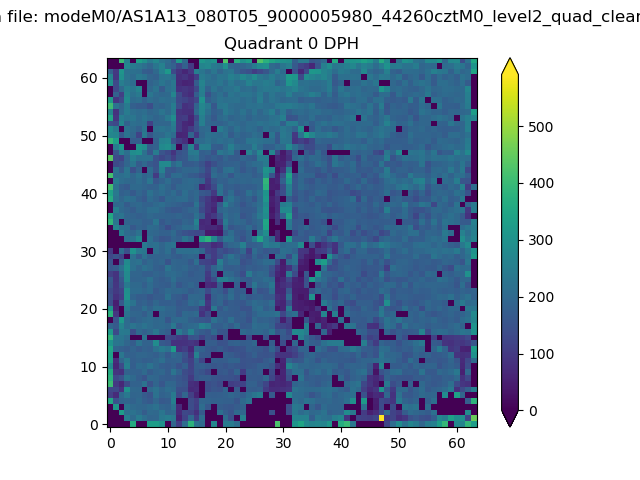 |
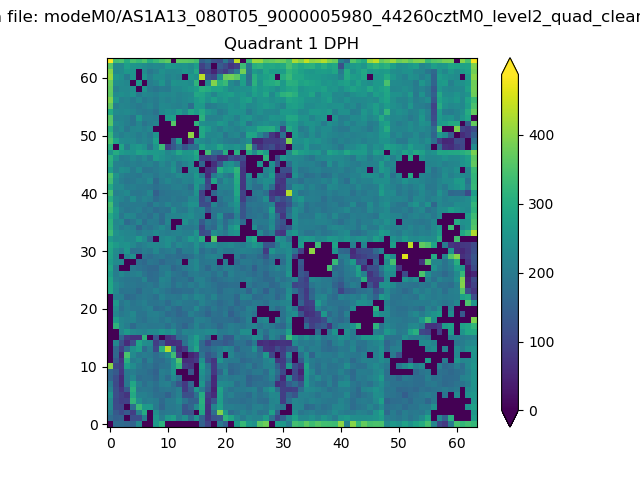 |
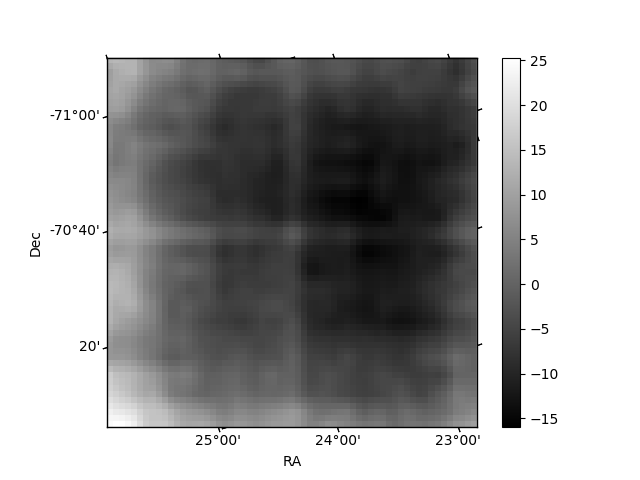
Quadrant B |
|---|---|---|---|
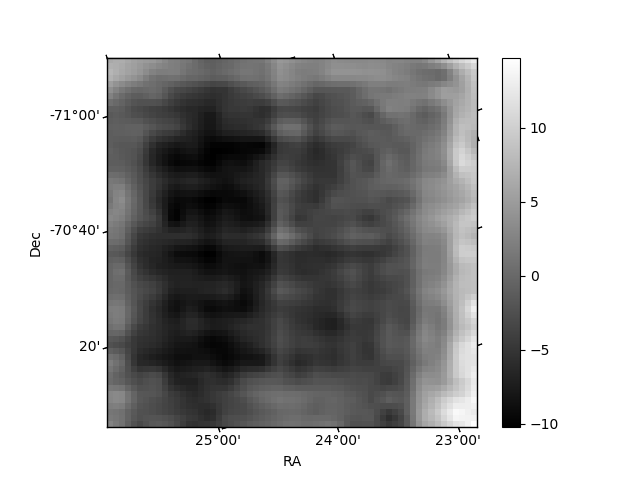
| Quadrant D | 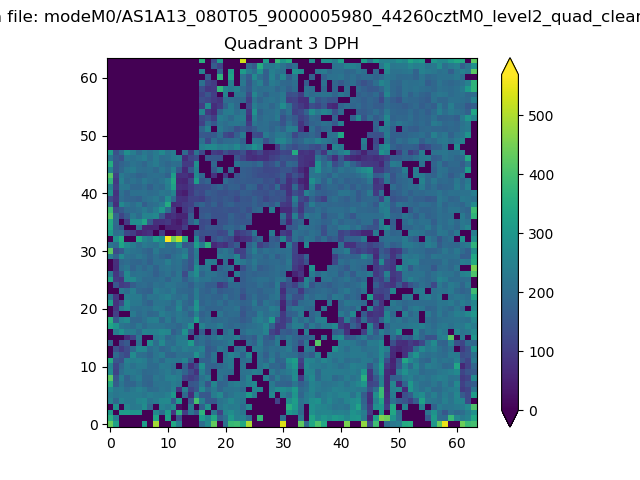 |
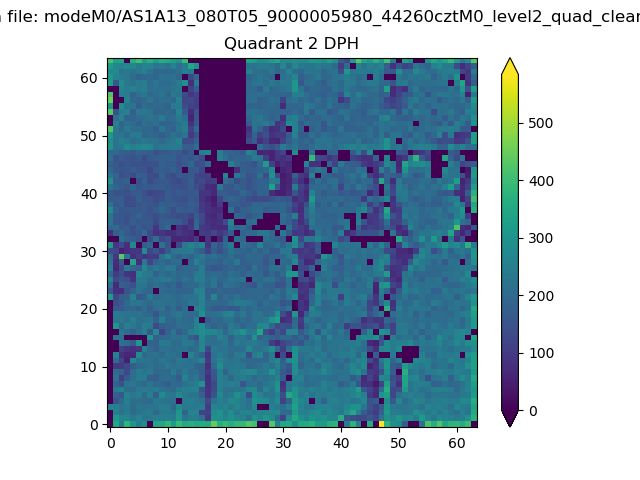 |
Quadrant C |
| Plot type | Count rate plots | Images |
|---|---|---|
| Comparison with Poisson distribution Blue bars denote a histogram of data divided into 1 sec bins. Red curve is a Poisson curve with rate = median count rate of data. |
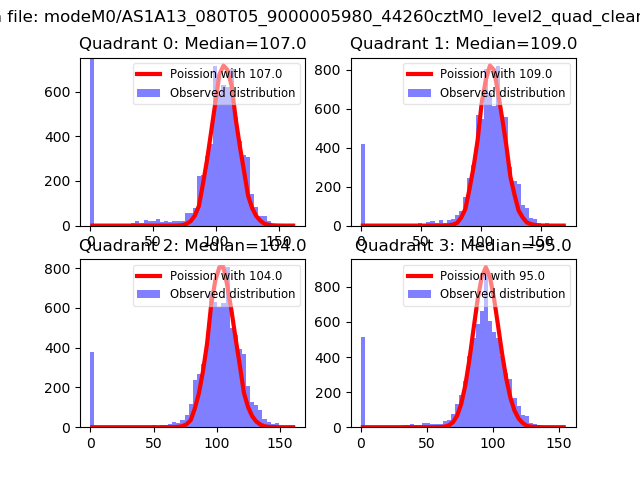 |
 |
| Quadrant-wise count rates Data is divided into 100 sec bins |
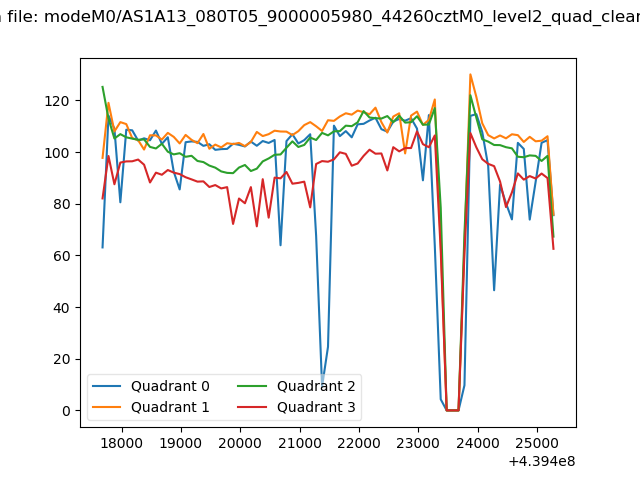 |
|
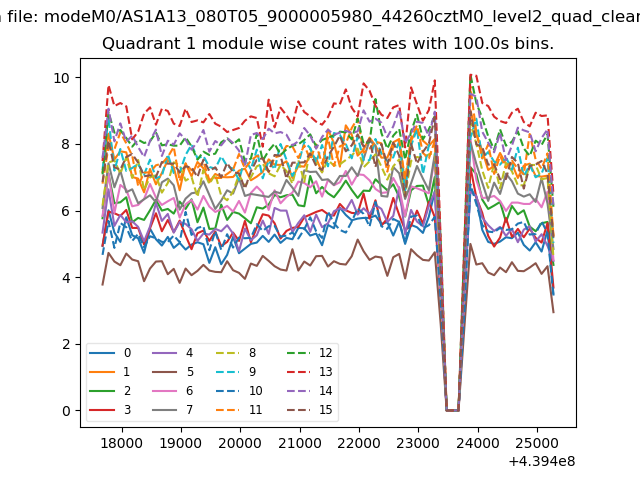
| Module-wise count rates for Quadrant A Data is divided into 100 sec bins |
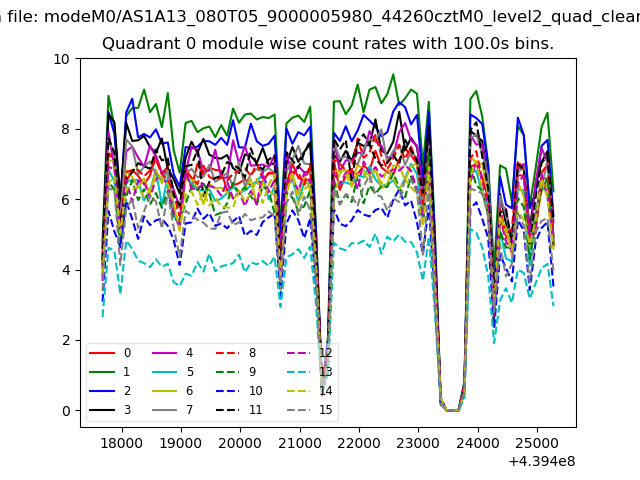 |
 |
| Module-wise count rates for Quadrant B Data is divided into 100 sec bins |
 |
 |
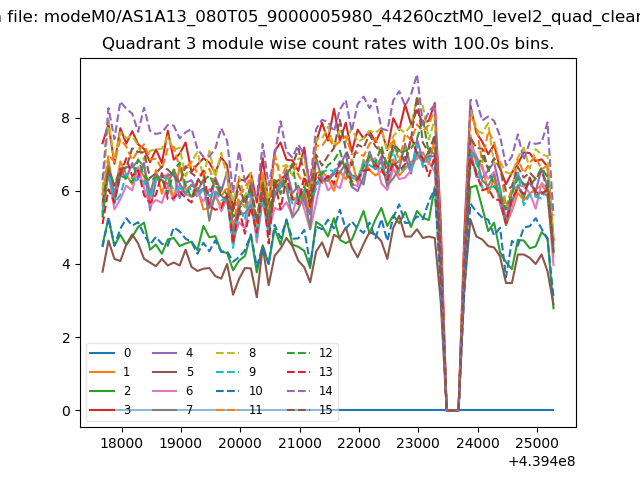
| Module-wise count rates for Quadrant C Data is divided into 100 sec bins |
 |
 |
| Module-wise count rates for Quadrant D Data is divided into 100 sec bins |
 |
 |
| Parameter | Plot |
|---|---|
| CZT HV Monitor | 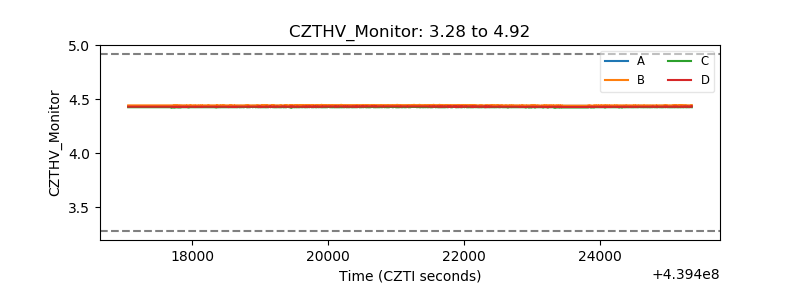 |
| D_VDD | 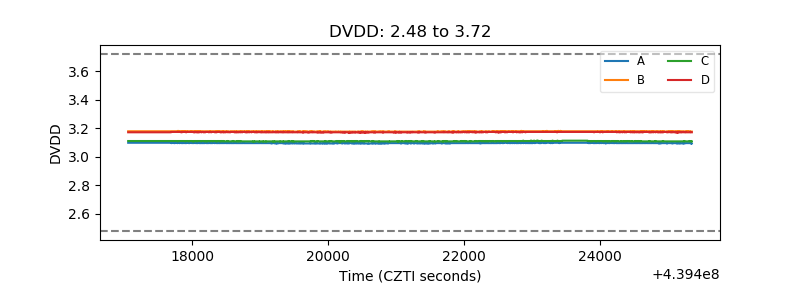 |
| Temperature 1 | 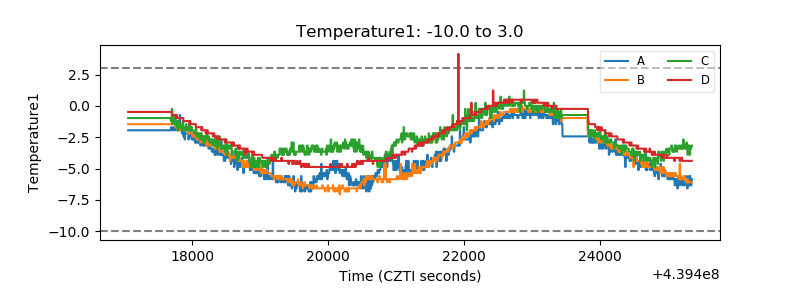 |
| Veto HV Monitor | 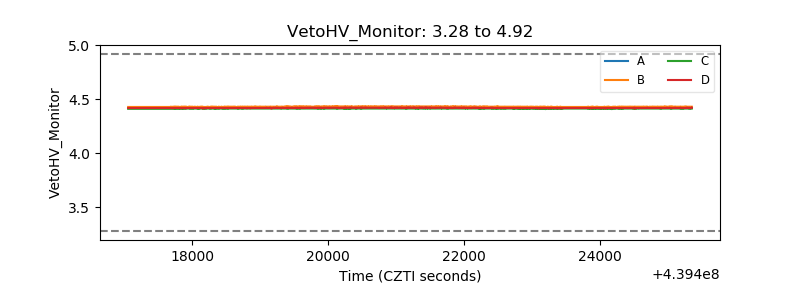 |
| Veto LLD | 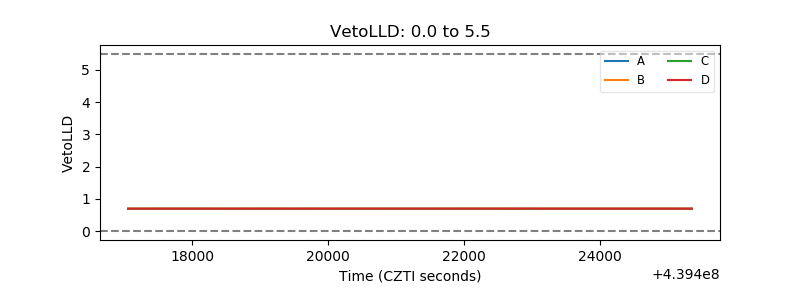 |
| Alpha Counter | 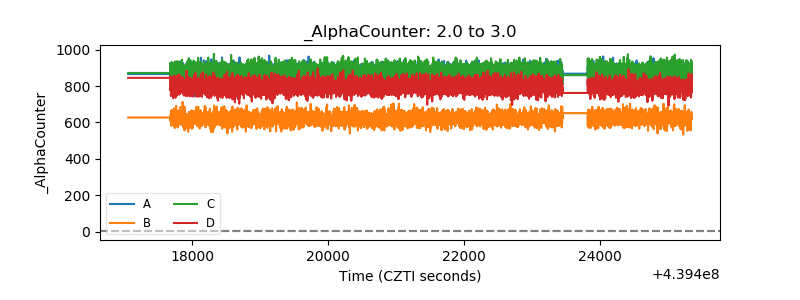 |
| _CPM_Rate | 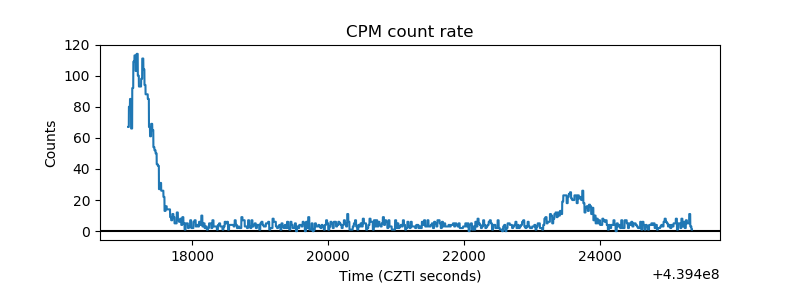 |
| CZT Counter | 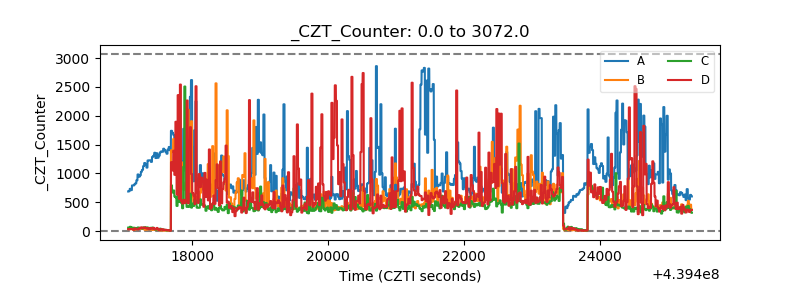 |
| +2.5 Volts monitor | 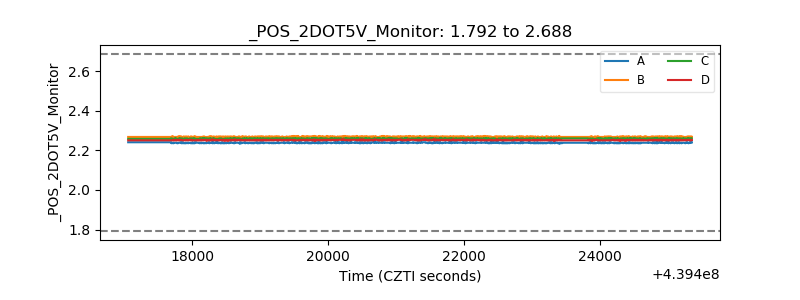 |
| +5 Volts monitor | 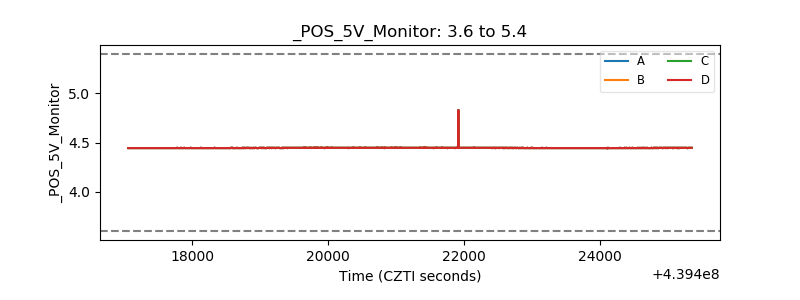 |
| _ROLL_ROT | 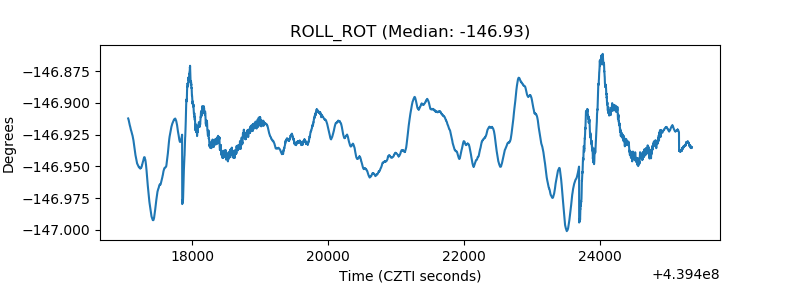 |
| _Roll_DEC | 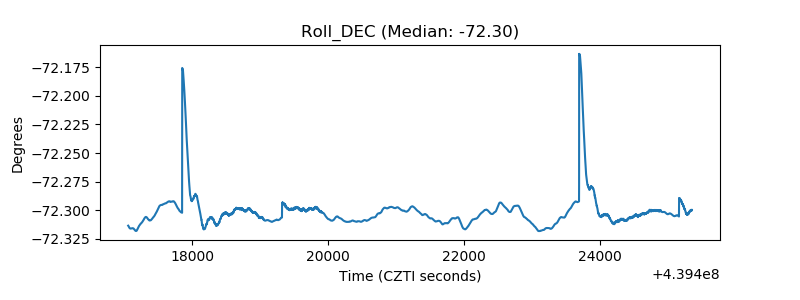 |
| _Roll_RA | 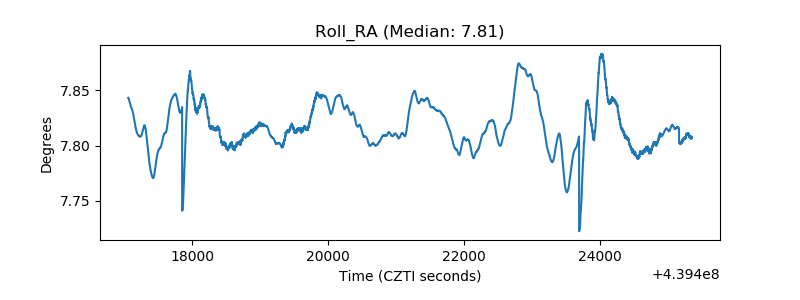 |
| Veto Counter | 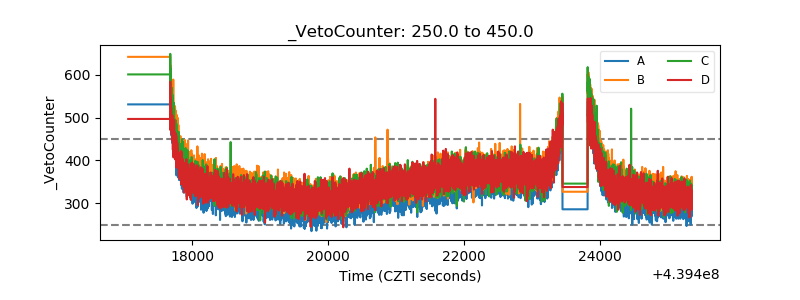 |