| Param | Original file | Final file |
|---|---|---|
| Filename | modeM0/AS1A13_080T05_9000005980_44262cztM0_level2.fits | modeM0/AS1A13_080T05_9000005980_44262cztM0_level2_quad_clean.evt |
| Size (bytes) | 620,789,760 | 126,489,600 |
| Size | 592.0 MB | 120.6 MB |
| Events in quadrant A | 7,474,742 | 845,124 |
| Events in quadrant B | 4,925,910 | 868,173 |
| Events in quadrant C | 3,700,976 | 830,741 |
| Events in quadrant D | 6,248,637 | 720,912 |
| Mode SS | |||
|---|---|---|---|
| Quadrant | BADHDUFLAG | Total packets | Discarded packets |
| A | 0 | 162 | 0 |
| B | 0 | 162 | 0 |
| C | 0 | 162 | 0 |
| D | 0 | 162 | 0 |
| Mode M0 | |||
|---|---|---|---|
| Quadrant | BADHDUFLAG | Total packets | Discarded packets |
| A | 0 | 28382 | 0 |
| B | 0 | 20233 | 0 |
| C | 0 | 17240 | 0 |
| D | 0 | 24332 | 1 |
| Quadrant | Total seconds | Saturated seconds | Saturation percentage |
|---|---|---|---|
| A | 8125 | 308 | 3.790769% |
| B | 8126 | 252 | 3.101157% |
| C | 8126 | 27 | 0.332267% |
| D | 8125 | 572 | 7.040000% |
Noise dominated data is calculated using 1-second bins in cleaned event files. If a bin has >2000 counts, and if more than 50% of those come from <1% of pixels, then it is considered to be noise-dominated and hence unusable.
| Quadrant | # 1 sec bins | Bins with >0 counts | Bins with >2000 counts | High rate bins dominated by noise | Noise dominated (total time) | Noise dominated (detector-on time) | Marked lightcurve |
|---|---|---|---|---|---|---|---|
| A | 8125 | 8125 | 164 | 164 | 2.02% | 2.02% | 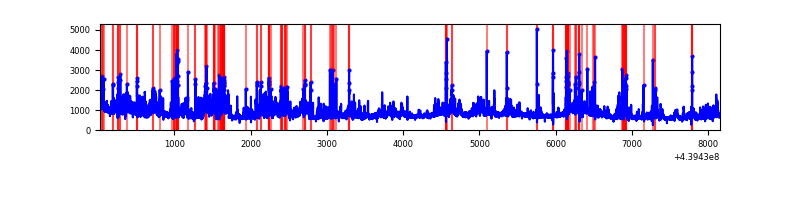 |
| B | 8126 | 8126 | 107 | 107 | 1.32% | 1.32% | 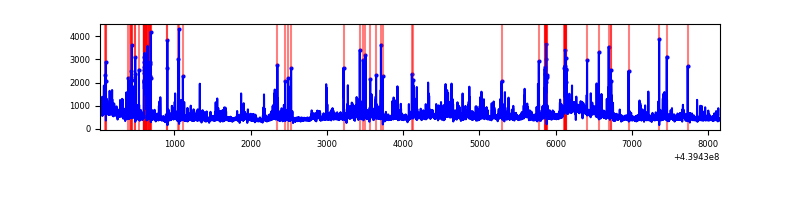 |
| C | 8126 | 8126 | 19 | 19 | 0.23% | 0.23% | 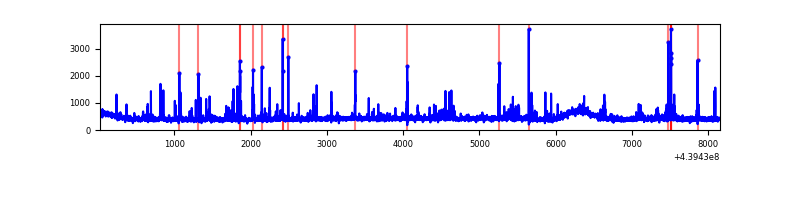 |
| D | 8125 | 8125 | 510 | 510 | 6.28% | 6.28% | 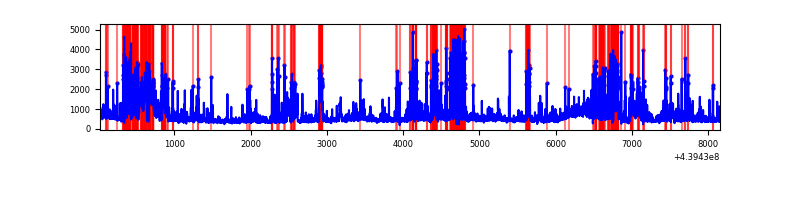 |
Top three noisy pixels from each quadrant. If the there are fewer than three noisy pixels in the level2.evt file, extra rows are filled as -1
| Pixel properties | Quadrant properties | ||||||
|---|---|---|---|---|---|---|---|
| Quadrant | DetID | PixID | Counts | Sigma | Mean | Median | Sigma |
| A | 15 | 223 | 2026746 | 11015.84 | 878 | 858 | 183.9 |
| A | 10 | 83 | 1836031 | 9978.82 | 878 | 858 | 183.9 |
| A | 7 | 3 | 92767 | 499.76 | 878 | 858 | 183.9 |
| B | 0 | 219 | 369611 | 2141.19 | 884 | 856 | 172.2 |
| B | 0 | 155 | 236099 | 1365.95 | 884 | 856 | 172.2 |
| B | 4 | 173 | 209018 | 1208.7 | 884 | 856 | 172.2 |
| C | 14 | 254 | 165442 | 804.46 | 865 | 865 | 204.6 |
| C | 5 | 250 | 123075 | 597.37 | 865 | 865 | 204.6 |
| C | 3 | 233 | 15239 | 70.26 | 865 | 865 | 204.6 |
| D | 5 | 222 | 544697 | 2568.35 | 841 | 813 | 211.8 |
| D | 5 | 235 | 524627 | 2473.57 | 841 | 813 | 211.8 |
| D | 1 | 20 | 501426 | 2364.01 | 841 | 813 | 211.8 |
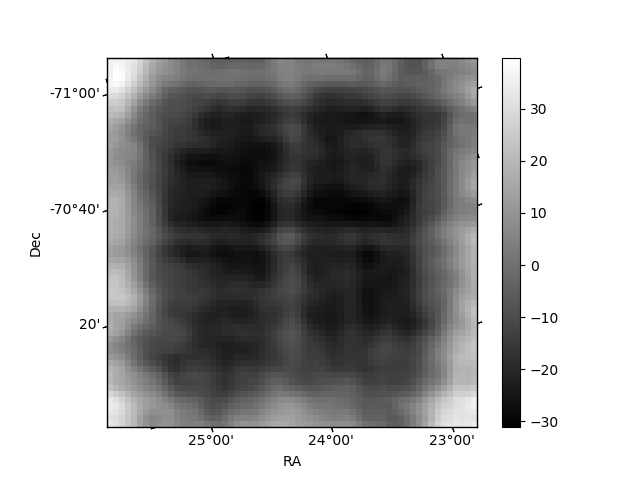
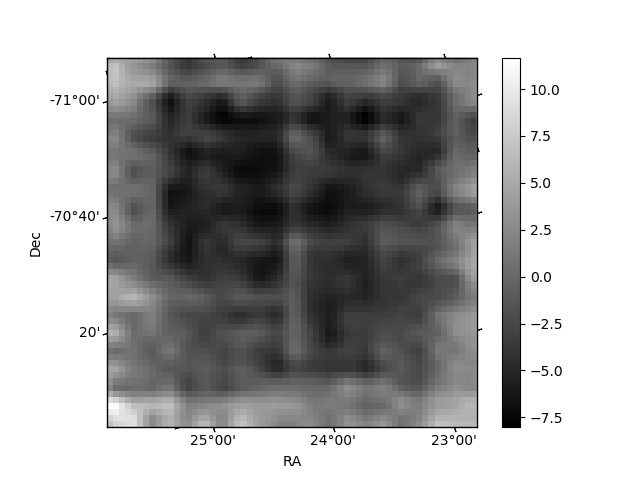
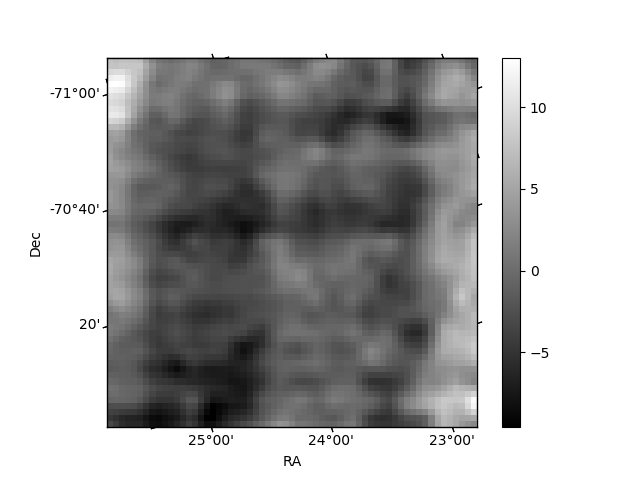
Histogram calculated using DETX and DETY for each event in the final _common_clean file
| Quadrant A | 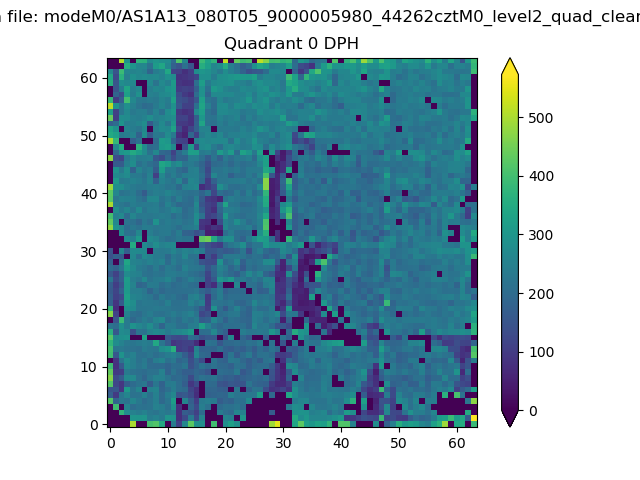 |
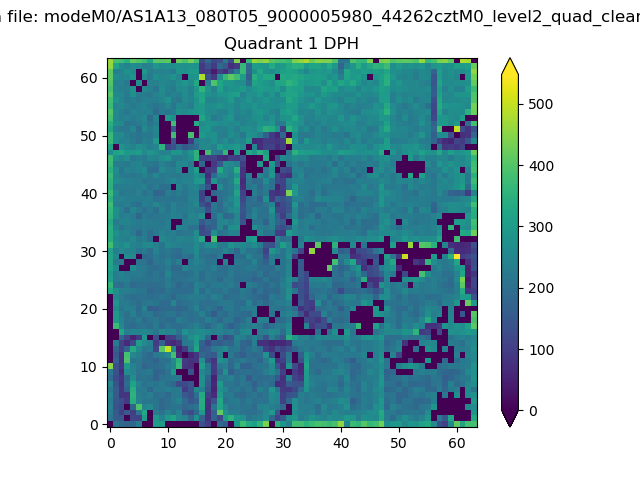 |
Quadrant B |
|---|---|---|---|
| Quadrant D | 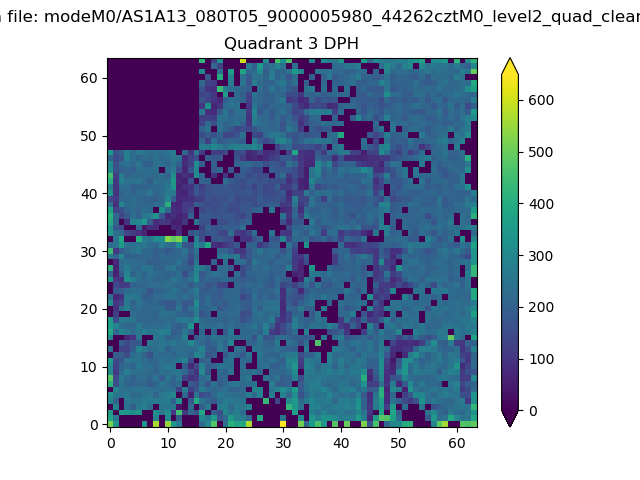 |
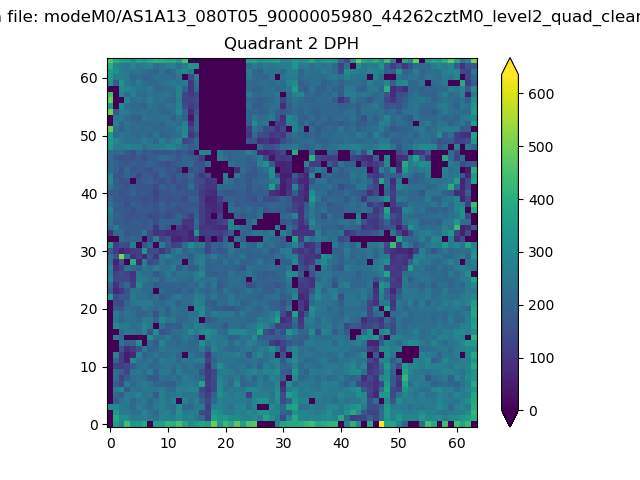 |
Quadrant C |
| Plot type | Count rate plots | Images |
|---|---|---|
| Comparison with Poisson distribution Blue bars denote a histogram of data divided into 1 sec bins. Red curve is a Poisson curve with rate = median count rate of data. |
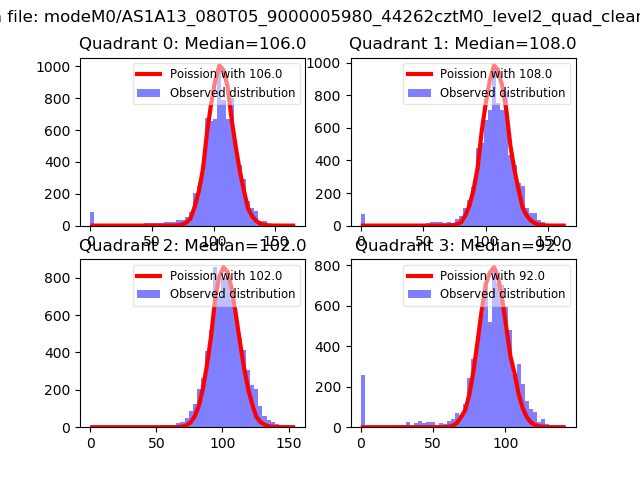 |
 |
| Quadrant-wise count rates Data is divided into 100 sec bins |
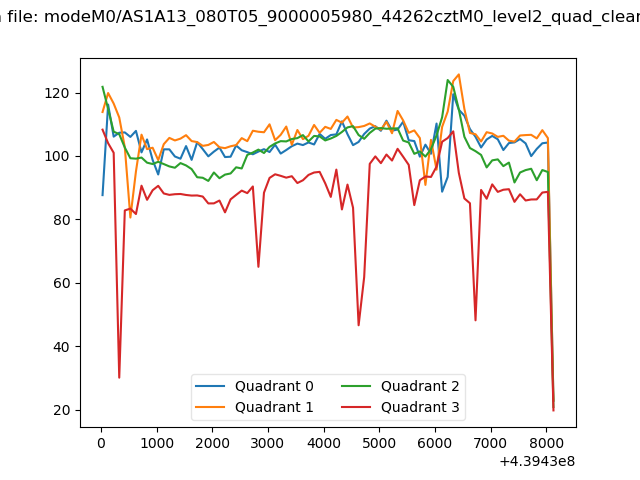 |
|
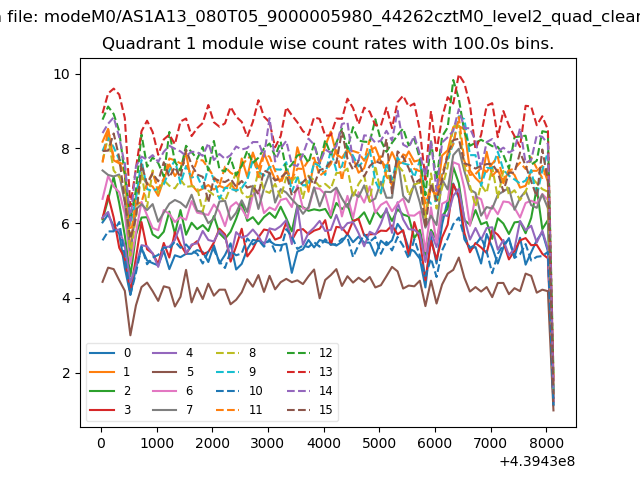
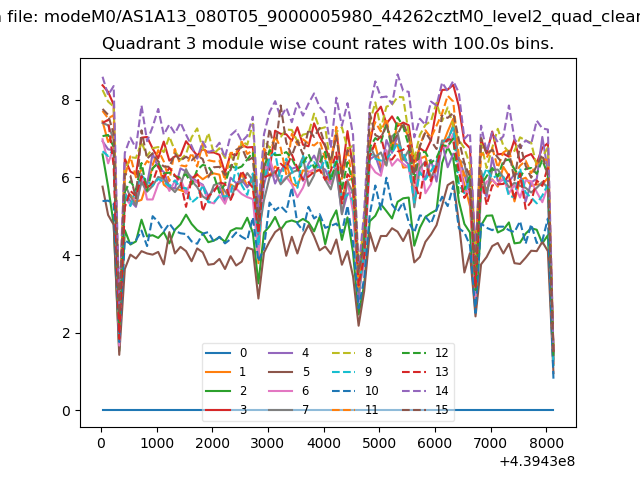
| Module-wise count rates for Quadrant A Data is divided into 100 sec bins |
 |
 |
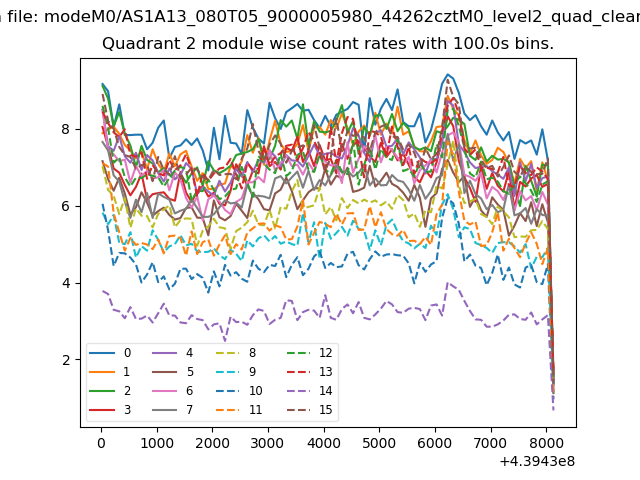
| Module-wise count rates for Quadrant B Data is divided into 100 sec bins |
 |
 |
| Module-wise count rates for Quadrant C Data is divided into 100 sec bins |
 |
 |
| Module-wise count rates for Quadrant D Data is divided into 100 sec bins |
 |
 |
| Parameter | Plot |
|---|---|
| CZT HV Monitor | 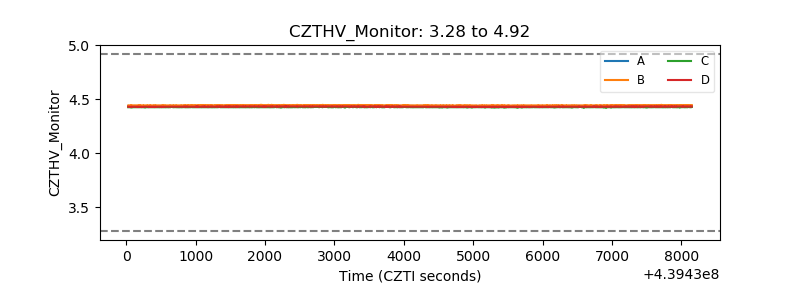 |
| D_VDD | 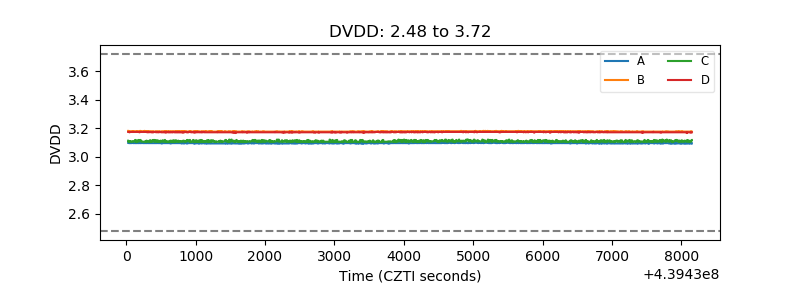 |
| Temperature 1 | 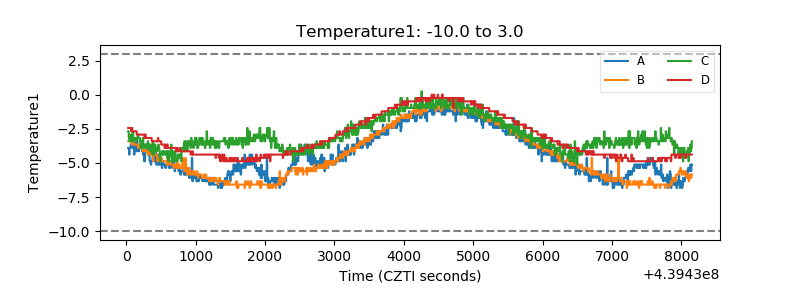 |
| Veto HV Monitor | 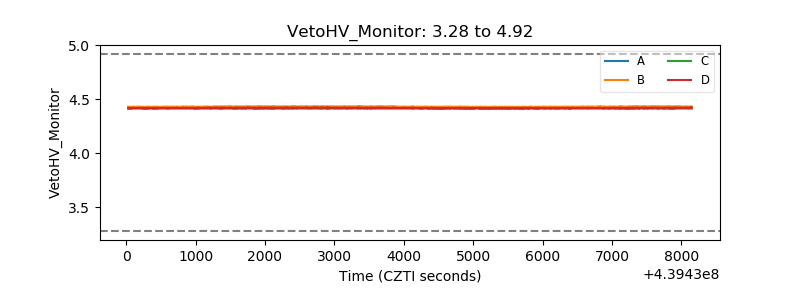 |
| Veto LLD | 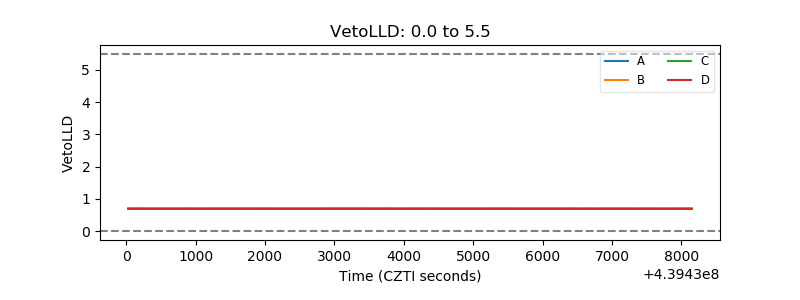 |
| Alpha Counter | 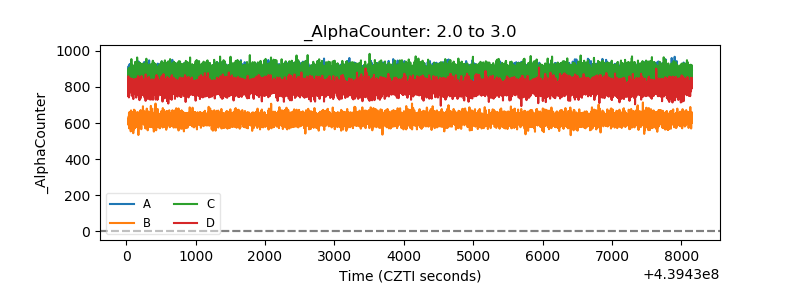 |
| _CPM_Rate | 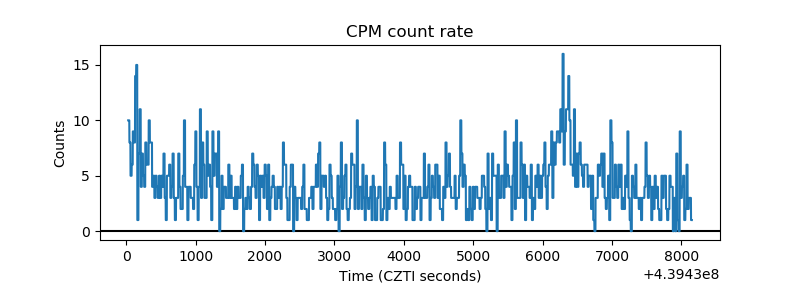 |
| CZT Counter | 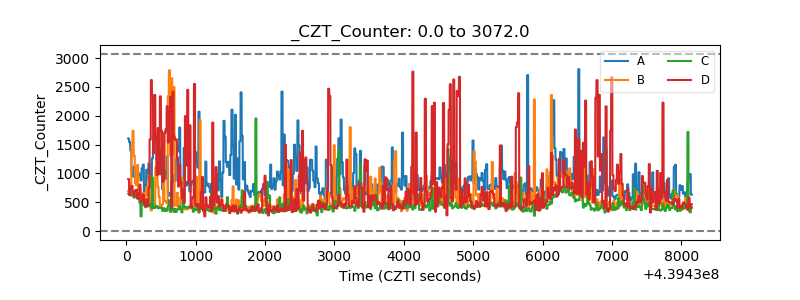 |
| +2.5 Volts monitor | 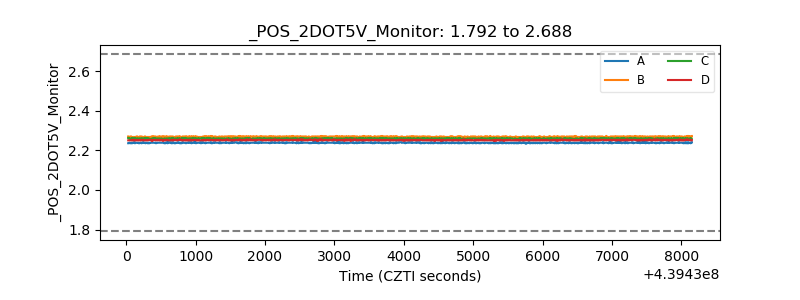 |
| +5 Volts monitor | 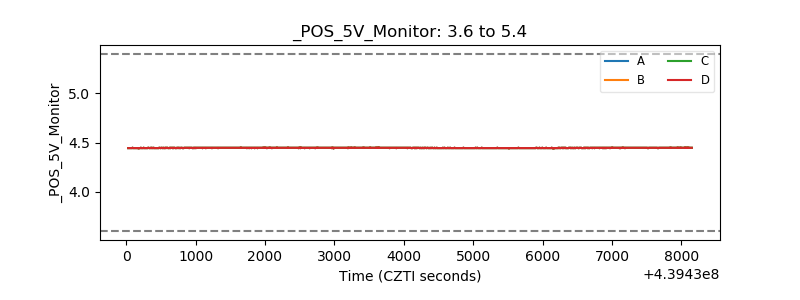 |
| _ROLL_ROT | 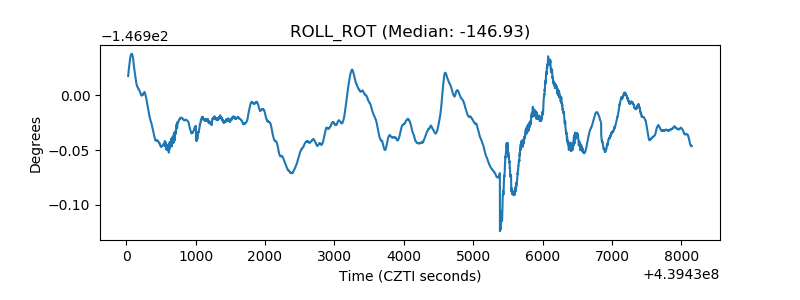 |
| _Roll_DEC | 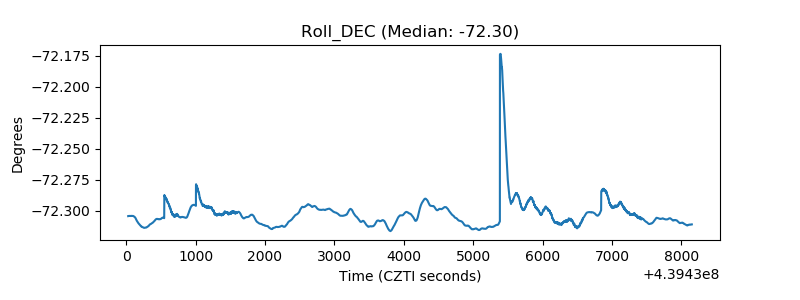 |
| _Roll_RA | 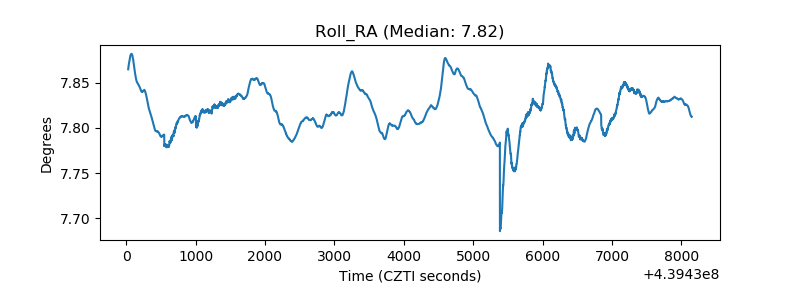 |
| Veto Counter | 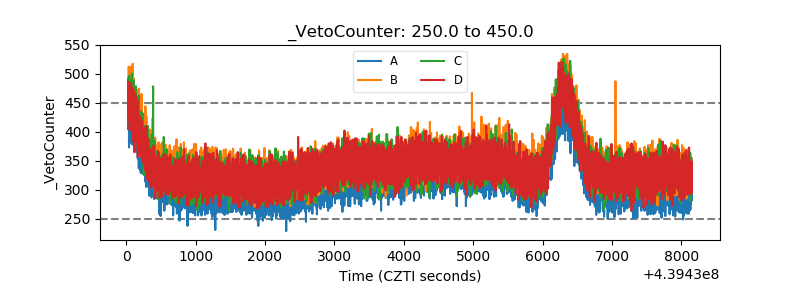 |