| Param | Original file | Final file |
|---|---|---|
| Filename | modeM0/AS1A13_077T01_9000005984_44272cztM0_level2.fits | modeM0/AS1A13_077T01_9000005984_44272cztM0_level2_quad_clean.evt |
| Size (bytes) | 611,331,840 | 99,878,400 |
| Size | 583.0 MB | 95.3 MB |
| Events in quadrant A | 9,799,176 | 495,435 |
| Events in quadrant B | 3,817,384 | 755,413 |
| Events in quadrant C | 3,304,983 | 719,994 |
| Events in quadrant D | 5,228,077 | 621,982 |
| Mode M0 | |||
|---|---|---|---|
| Quadrant | BADHDUFLAG | Total packets | Discarded packets |
| A | 0 | 33463 | 1 |
| B | 0 | 15533 | 1 |
| C | 0 | 13913 | 1 |
| D | 0 | 19813 | 1 |
| Mode M9 | |||
|---|---|---|---|
| Quadrant | BADHDUFLAG | Total packets | Discarded packets |
| A | 0 | 13 | 0 |
| B | 0 | 13 | 0 |
| C | 0 | 13 | 0 |
| D | 0 | 13 | 0 |
| Mode SS | |||
|---|---|---|---|
| Quadrant | BADHDUFLAG | Total packets | Discarded packets |
| A | 0 | 126 | 0 |
| B | 0 | 126 | 0 |
| C | 0 | 126 | 0 |
| D | 0 | 126 | 0 |
| Quadrant | Total seconds | Saturated seconds | Saturation percentage |
|---|---|---|---|
| A | 6187 | 2383 | 38.516244% |
| B | 6187 | 170 | 2.747697% |
| C | 6188 | 103 | 1.664512% |
| D | 6188 | 564 | 9.114415% |
Noise dominated data is calculated using 1-second bins in cleaned event files. If a bin has >2000 counts, and if more than 50% of those come from <1% of pixels, then it is considered to be noise-dominated and hence unusable.
| Quadrant | # 1 sec bins | Bins with >0 counts | Bins with >2000 counts | High rate bins dominated by noise | Noise dominated (total time) | Noise dominated (detector-on time) | Marked lightcurve |
|---|---|---|---|---|---|---|---|
| A | 7387 | 6189 | 2050 | 2050 | 27.75% | 33.12% | 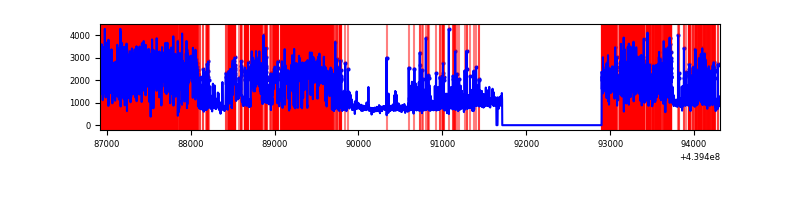 |
| B | 7387 | 6189 | 35 | 35 | 0.47% | 0.57% | 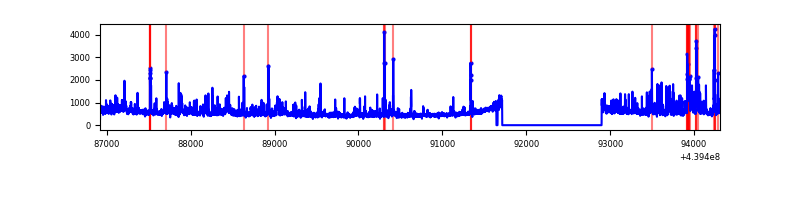 |
| C | 7388 | 6190 | 30 | 30 | 0.41% | 0.48% | 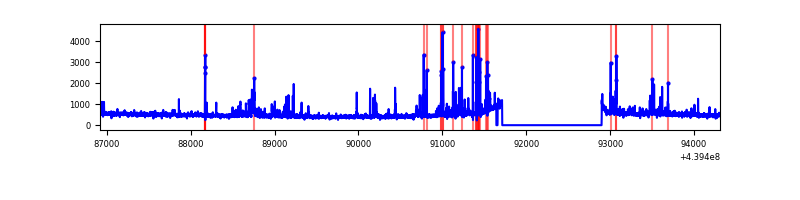 |
| D | 7388 | 6190 | 373 | 373 | 5.05% | 6.03% | 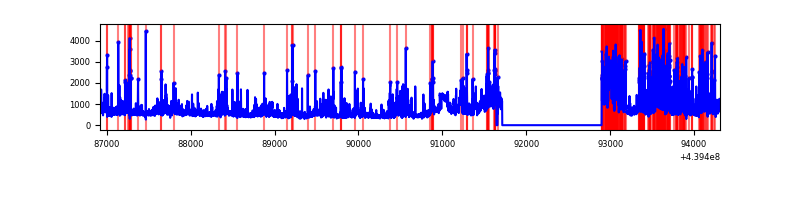 |
Top three noisy pixels from each quadrant. If the there are fewer than three noisy pixels in the level2.evt file, extra rows are filled as -1
| Pixel properties | Quadrant properties | ||||||
|---|---|---|---|---|---|---|---|
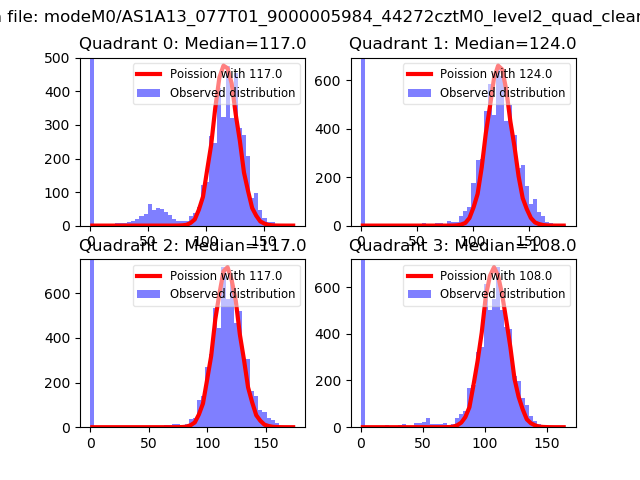
| Quadrant | DetID | PixID | Counts | Sigma | Mean | Median | Sigma |
| A | 15 | 223 | 5608776 | 40764.66 | 661 | 649 | 137.6 |
| A | 10 | 83 | 1394469 | 10131.47 | 661 | 649 | 137.6 |
| A | 13 | 248 | 155988 | 1129.14 | 661 | 649 | 137.6 |
| B | 0 | 219 | 121032 | 815.95 | 751 | 728 | 147.4 |
| B | 0 | 200 | 110379 | 743.7 | 751 | 728 | 147.4 |
| B | 4 | 173 | 95023 | 639.55 | 751 | 728 | 147.4 |
| C | 4 | 254 | 162988 | 927.79 | 741 | 748 | 174.9 |
| C | 14 | 254 | 108058 | 613.66 | 741 | 748 | 174.9 |
| C | 15 | 208 | 78313 | 443.56 | 741 | 748 | 174.9 |
| D | 1 | 52 | 1111428 | 6185.13 | 716 | 696 | 179.6 |
| D | 1 | 20 | 231170 | 1283.4 | 716 | 696 | 179.6 |
| D | 12 | 233 | 185794 | 1030.72 | 716 | 696 | 179.6 |
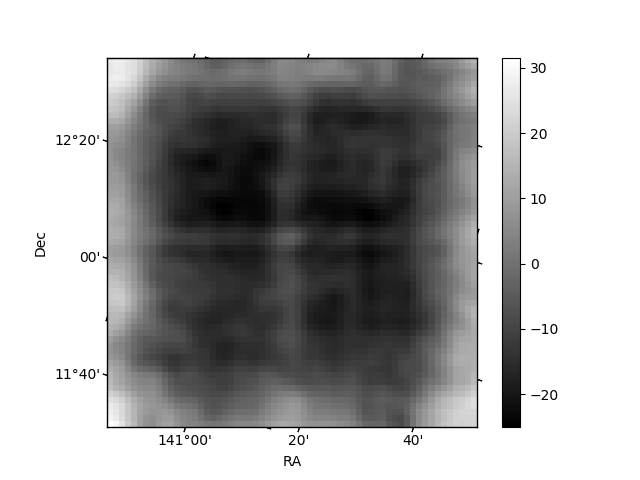
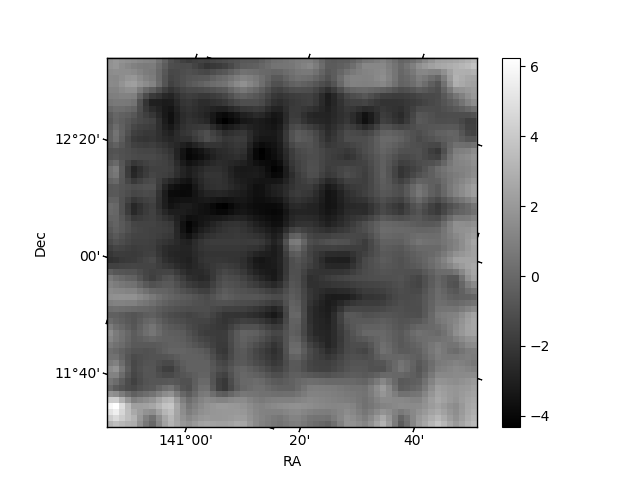
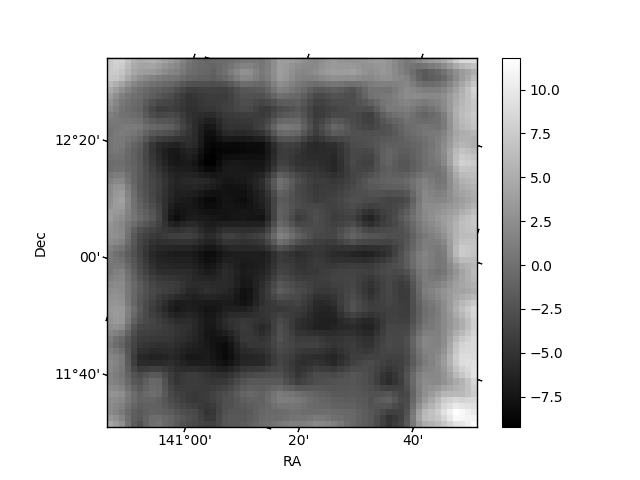
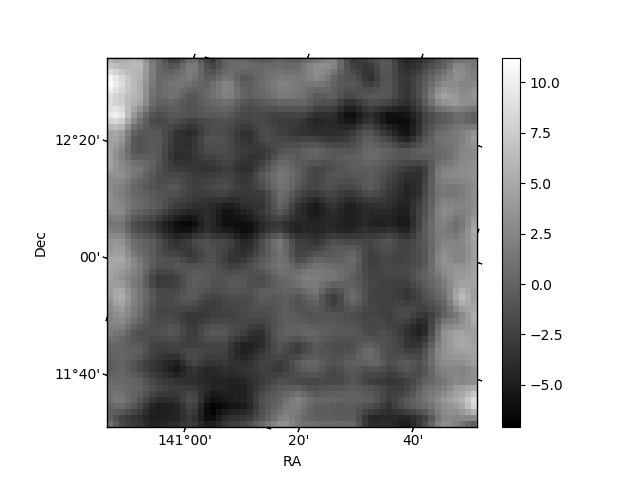
Histogram calculated using DETX and DETY for each event in the final _common_clean file
| Quadrant A | 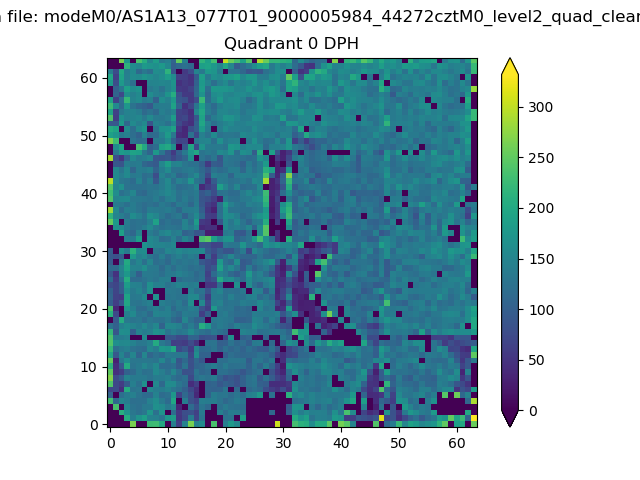 |
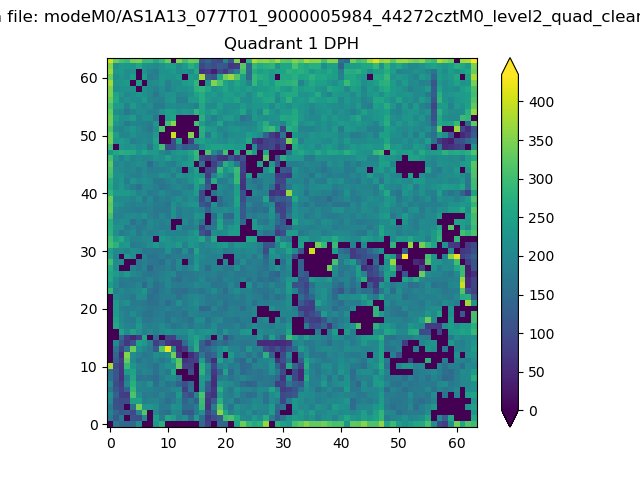 |
Quadrant B |
|---|---|---|---|
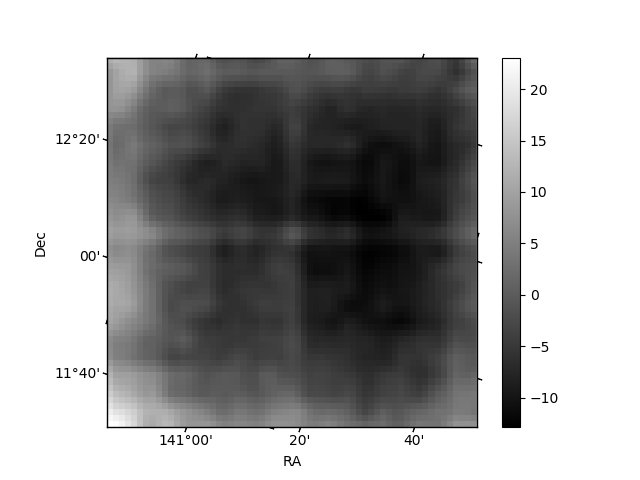
| Quadrant D | 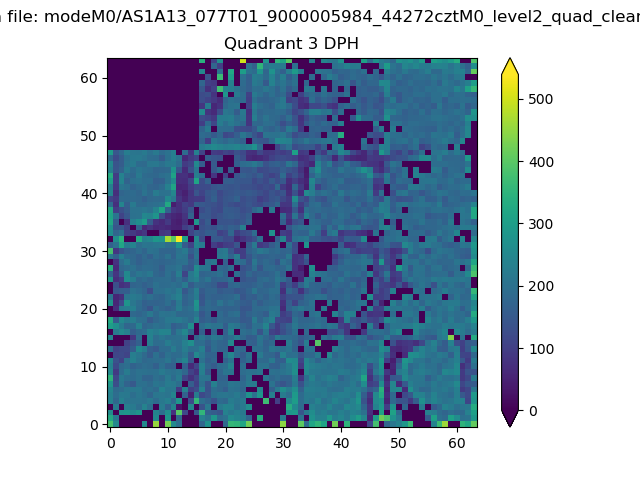 |
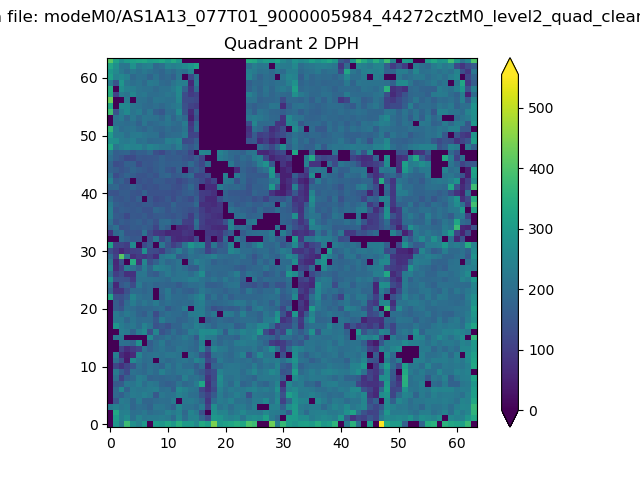 |
Quadrant C |
| Plot type | Count rate plots | Images |
|---|---|---|
| Comparison with Poisson distribution Blue bars denote a histogram of data divided into 1 sec bins. Red curve is a Poisson curve with rate = median count rate of data. |
 |
 |
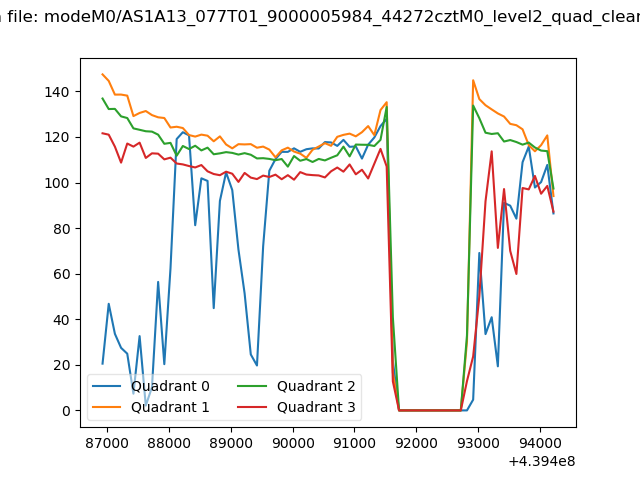
| Quadrant-wise count rates Data is divided into 100 sec bins |
 |
|
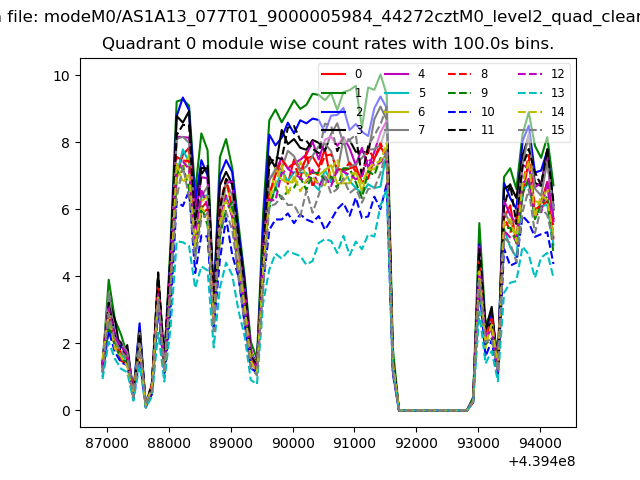
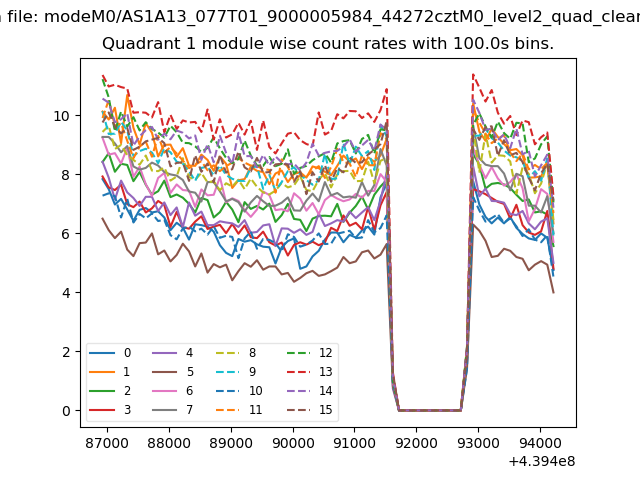
| Module-wise count rates for Quadrant A Data is divided into 100 sec bins |
 |
 |
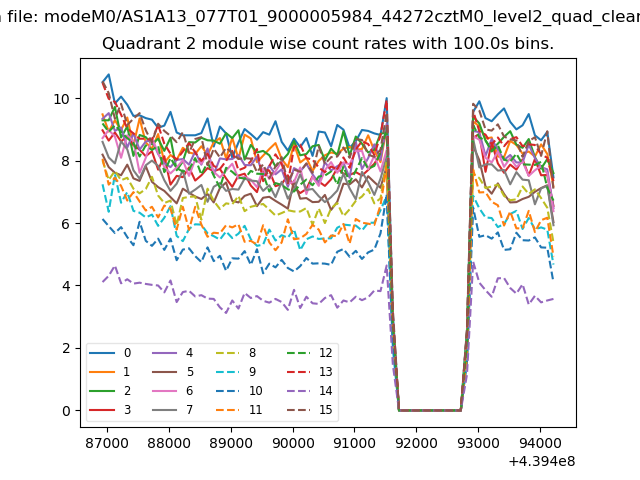
| Module-wise count rates for Quadrant B Data is divided into 100 sec bins |
 |
 |
| Module-wise count rates for Quadrant C Data is divided into 100 sec bins |
 |
 |
| Module-wise count rates for Quadrant D Data is divided into 100 sec bins |
 |
 |
| Parameter | Plot |
|---|---|
| CZT HV Monitor | 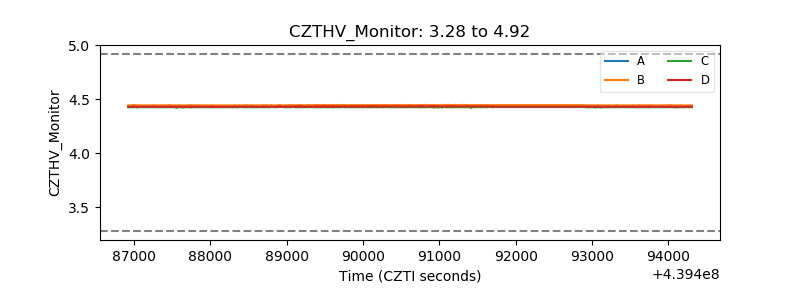 |
| D_VDD | 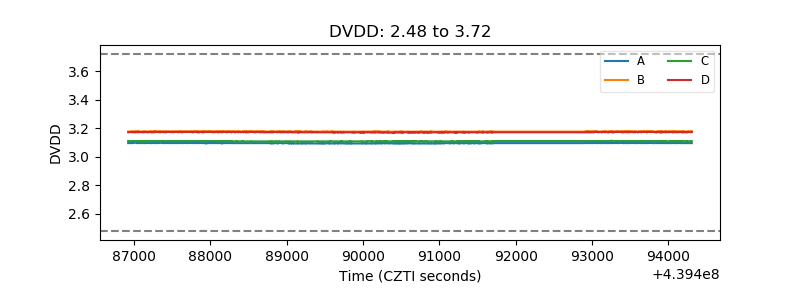 |
| Temperature 1 | 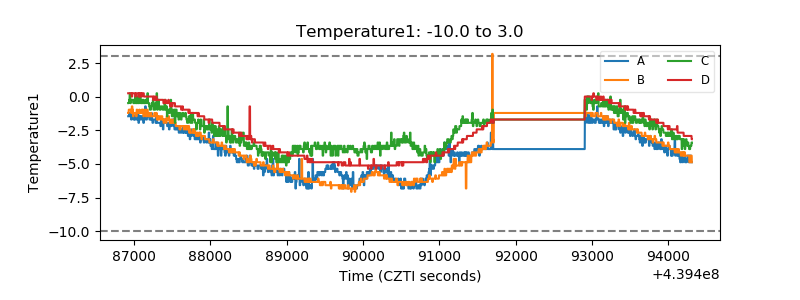 |
| Veto HV Monitor | 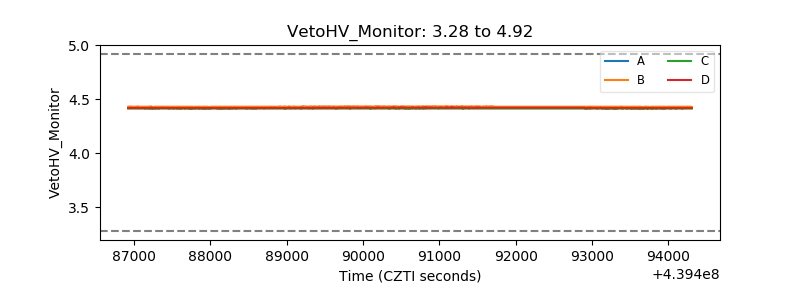 |
| Veto LLD | 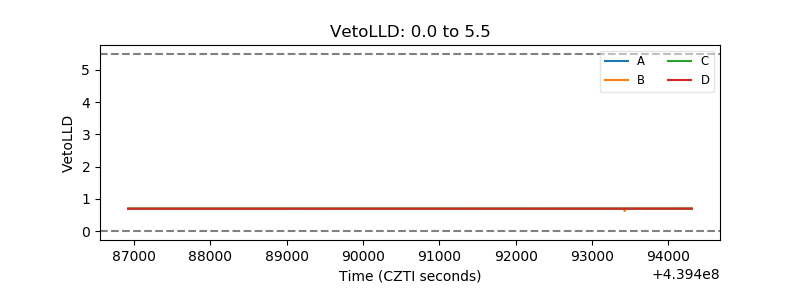 |
| Alpha Counter | 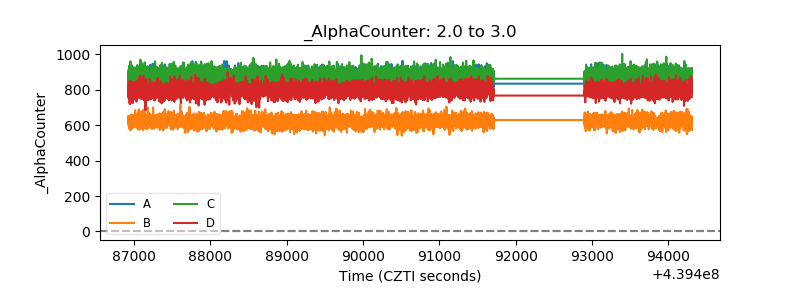 |
| _CPM_Rate | 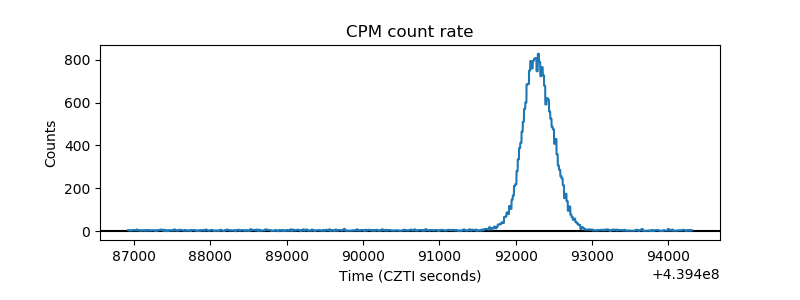 |
| CZT Counter | 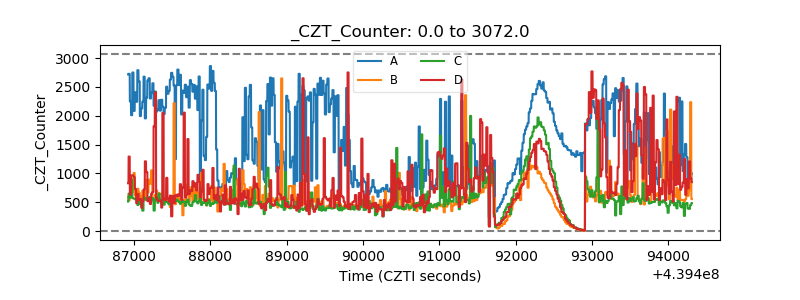 |
| +2.5 Volts monitor | 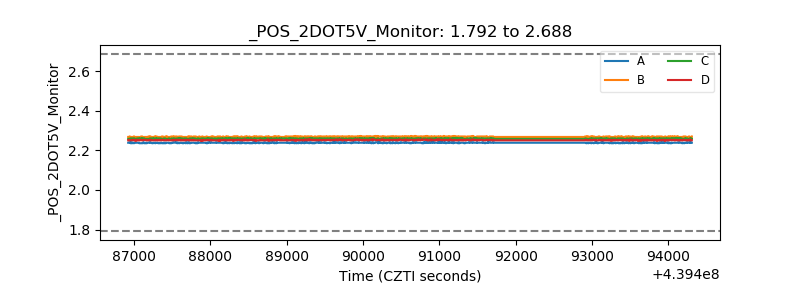 |
| +5 Volts monitor | 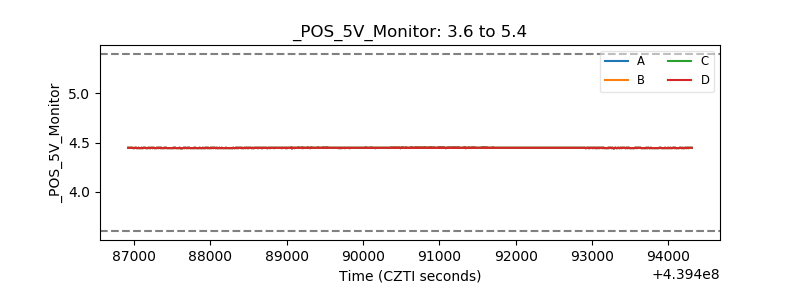 |
| _ROLL_ROT |  |
| _Roll_DEC | 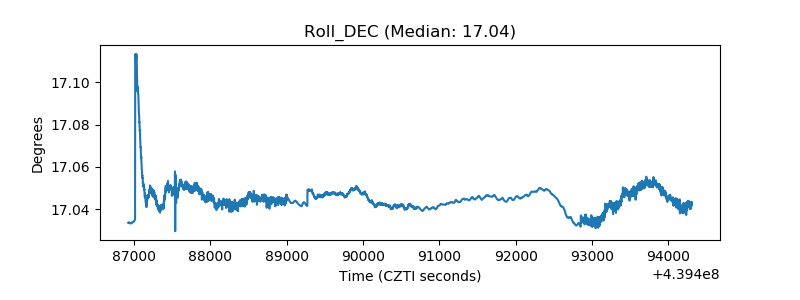 |
| _Roll_RA | 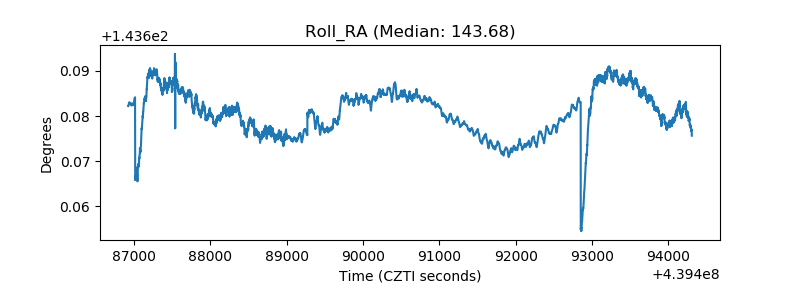 |
| Veto Counter | 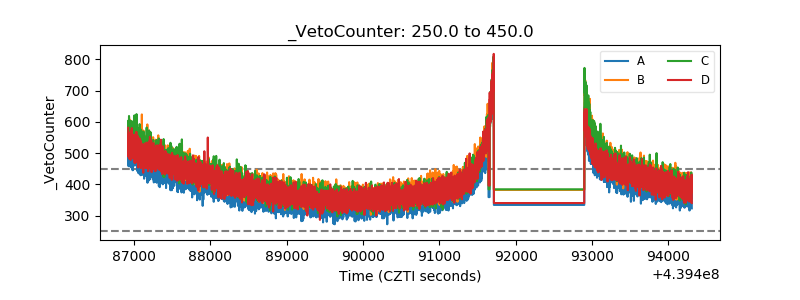 |