| Param | Original file | Final file |
|---|---|---|
| Filename | modeM0/AS1A13_077T01_9000005984_44273cztM0_level2.fits | modeM0/AS1A13_077T01_9000005984_44273cztM0_level2_quad_clean.evt |
| Size (bytes) | 565,292,160 | 106,683,840 |
| Size | 539.1 MB | 101.7 MB |
| Events in quadrant A | 6,921,527 | 679,811 |
| Events in quadrant B | 3,860,886 | 763,193 |
| Events in quadrant C | 3,418,364 | 735,253 |
| Events in quadrant D | 6,218,054 | 596,746 |
| Mode M0 | |||
|---|---|---|---|
| Quadrant | BADHDUFLAG | Total packets | Discarded packets |
| A | 0 | 25517 | 1 |
| B | 0 | 15968 | 1 |
| C | 0 | 14628 | 1 |
| D | 0 | 23046 | 9 |
| Mode M9 | |||
|---|---|---|---|
| Quadrant | BADHDUFLAG | Total packets | Discarded packets |
| A | 0 | 10 | 0 |
| B | 0 | 10 | 0 |
| C | 0 | 10 | 0 |
| D | 0 | 10 | 0 |
| Mode SS | |||
|---|---|---|---|
| Quadrant | BADHDUFLAG | Total packets | Discarded packets |
| A | 0 | 132 | 0 |
| B | 0 | 132 | 0 |
| C | 0 | 132 | 0 |
| D | 0 | 132 | 0 |
| Quadrant | Total seconds | Saturated seconds | Saturation percentage |
|---|---|---|---|
| A | 6529 | 863 | 13.217951% |
| B | 6530 | 163 | 2.496172% |
| C | 6530 | 83 | 1.271057% |
| D | 6529 | 992 | 15.193751% |
Noise dominated data is calculated using 1-second bins in cleaned event files. If a bin has >2000 counts, and if more than 50% of those come from <1% of pixels, then it is considered to be noise-dominated and hence unusable.
| Quadrant | # 1 sec bins | Bins with >0 counts | Bins with >2000 counts | High rate bins dominated by noise | Noise dominated (total time) | Noise dominated (detector-on time) | Marked lightcurve |
|---|---|---|---|---|---|---|---|
| A | 7564 | 6531 | 535 | 535 | 7.07% | 8.19% | 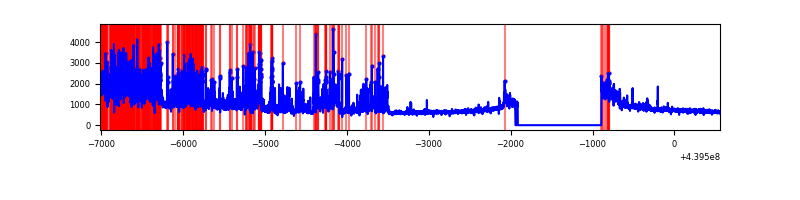 |
| B | 7565 | 6532 | 45 | 45 | 0.59% | 0.69% | 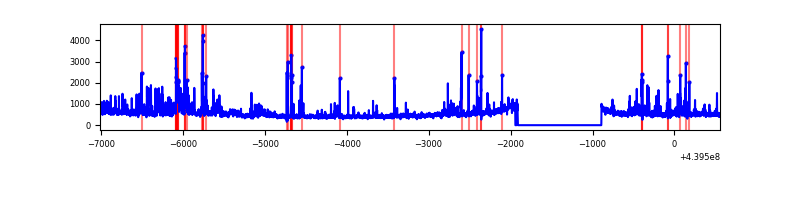 |
| C | 7565 | 6531 | 18 | 18 | 0.24% | 0.28% | 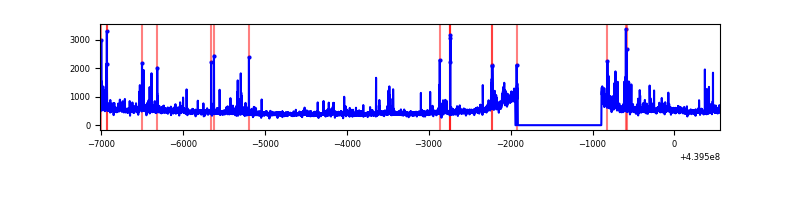 |
| D | 7564 | 6531 | 720 | 720 | 9.52% | 11.02% | 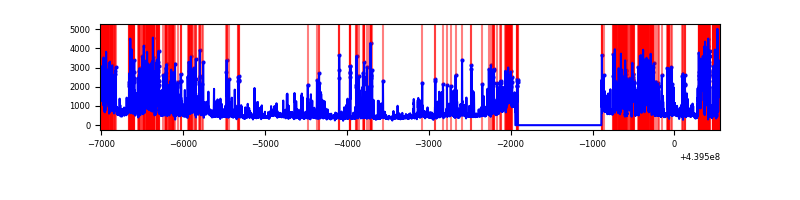 |
Top three noisy pixels from each quadrant. If the there are fewer than three noisy pixels in the level2.evt file, extra rows are filled as -1
| Pixel properties | Quadrant properties | ||||||
|---|---|---|---|---|---|---|---|
| Quadrant | DetID | PixID | Counts | Sigma | Mean | Median | Sigma |
| A | 15 | 223 | 2342838 | 14983.41 | 748 | 733 | 156.3 |
| A | 10 | 83 | 1599554 | 10228.32 | 748 | 733 | 156.3 |
| A | 0 | 243 | 28015 | 174.53 | 748 | 733 | 156.3 |
| B | 0 | 219 | 193633 | 1272.04 | 771 | 749 | 151.6 |
| B | 0 | 200 | 147312 | 966.56 | 771 | 749 | 151.6 |
| B | 7 | 221 | 87354 | 571.15 | 771 | 749 | 151.6 |
| C | 3 | 233 | 193044 | 1070.24 | 761 | 769 | 179.7 |
| C | 4 | 254 | 135390 | 749.33 | 761 | 769 | 179.7 |
| C | 14 | 254 | 95204 | 525.64 | 761 | 769 | 179.7 |
| D | 1 | 52 | 1986074 | 11075.82 | 716 | 697 | 179.3 |
| D | 13 | 249 | 236776 | 1317.01 | 716 | 697 | 179.3 |
| D | 12 | 233 | 183369 | 1019.07 | 716 | 697 | 179.3 |
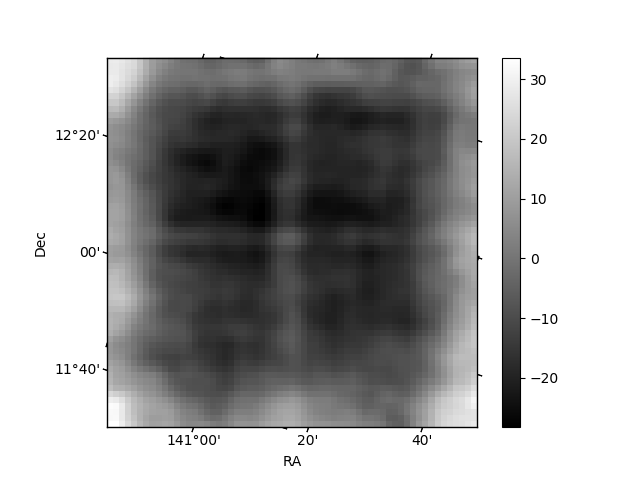
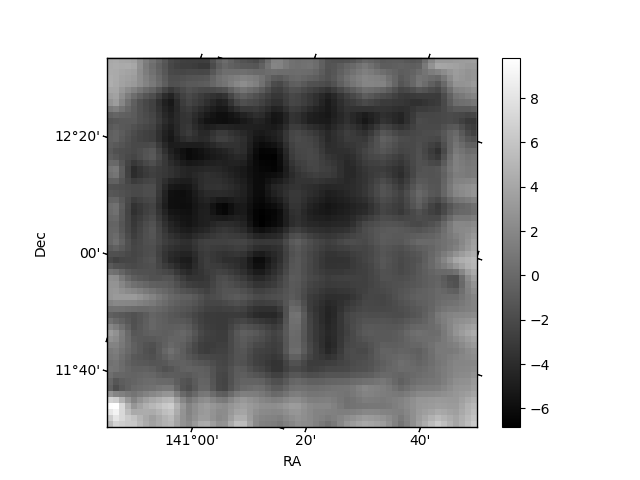
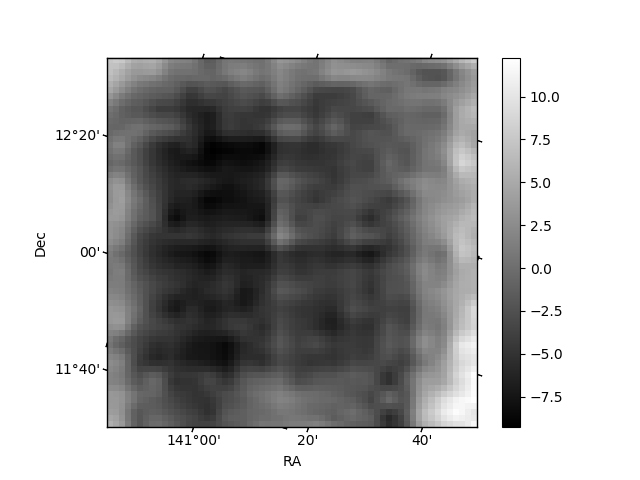
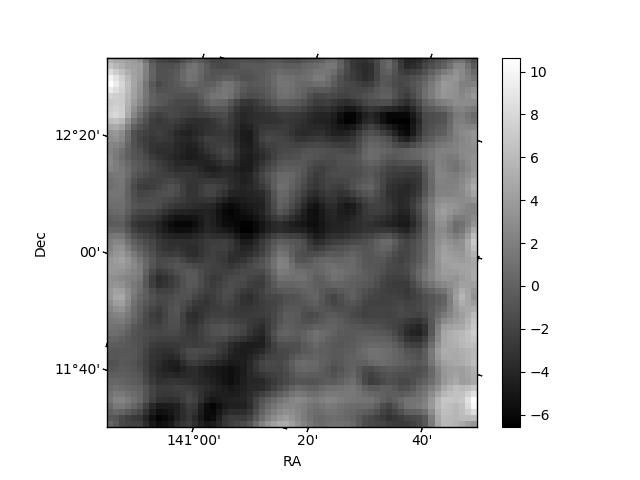
Histogram calculated using DETX and DETY for each event in the final _common_clean file
| Quadrant A | 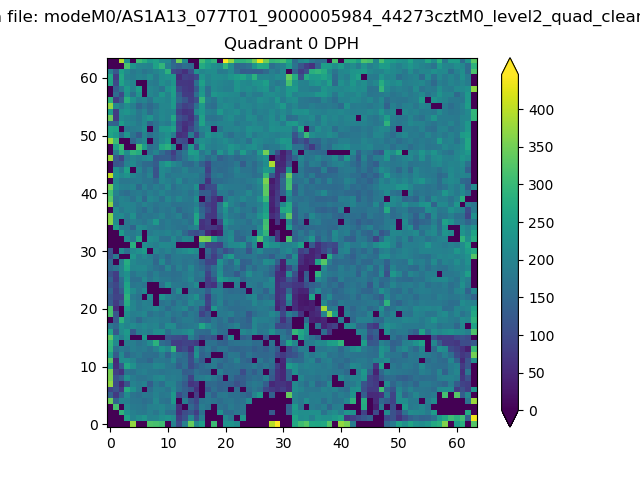 |
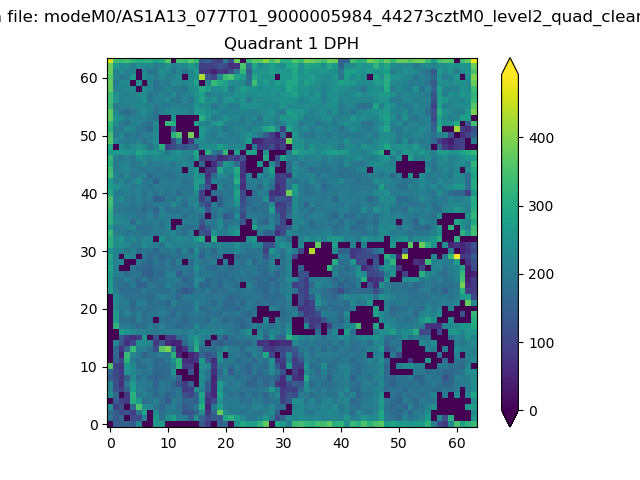 |
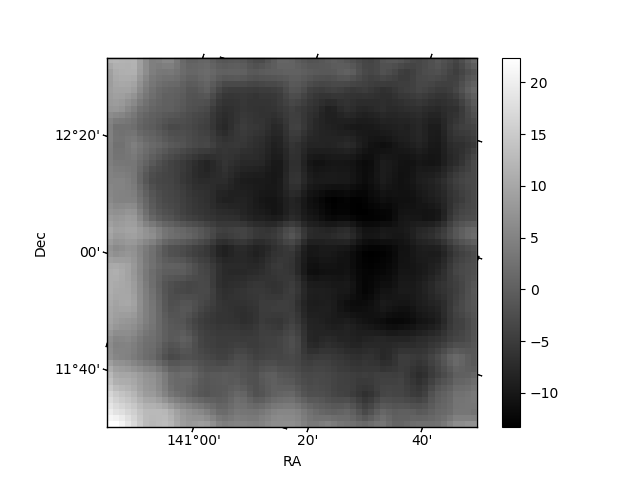
Quadrant B |
|---|---|---|---|
| Quadrant D | 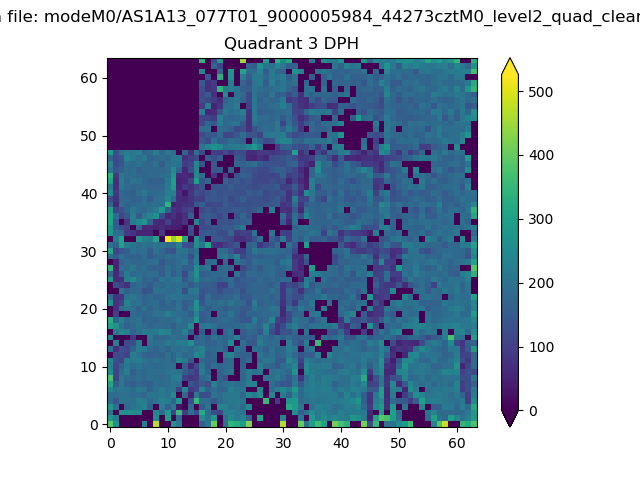 |
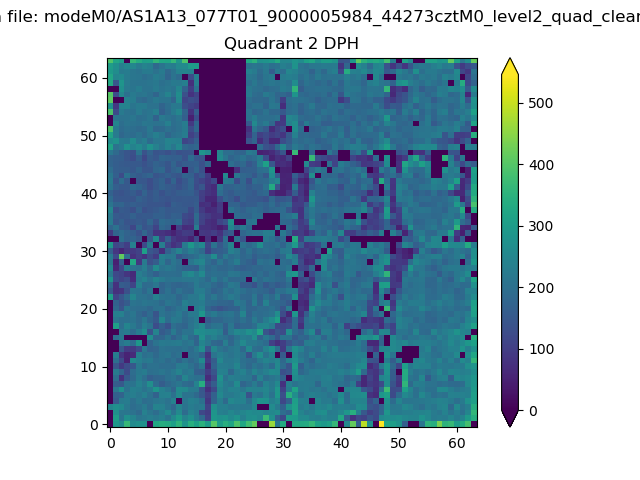 |
Quadrant C |
| Plot type | Count rate plots | Images |
|---|---|---|
| Comparison with Poisson distribution Blue bars denote a histogram of data divided into 1 sec bins. Red curve is a Poisson curve with rate = median count rate of data. |
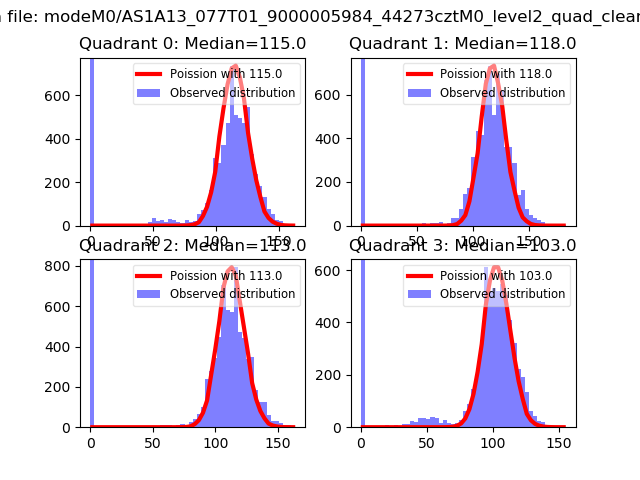 |
 |
| Quadrant-wise count rates Data is divided into 100 sec bins |
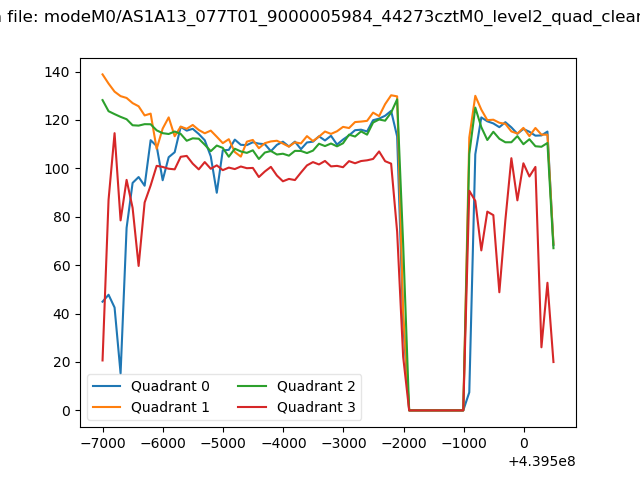 |
|
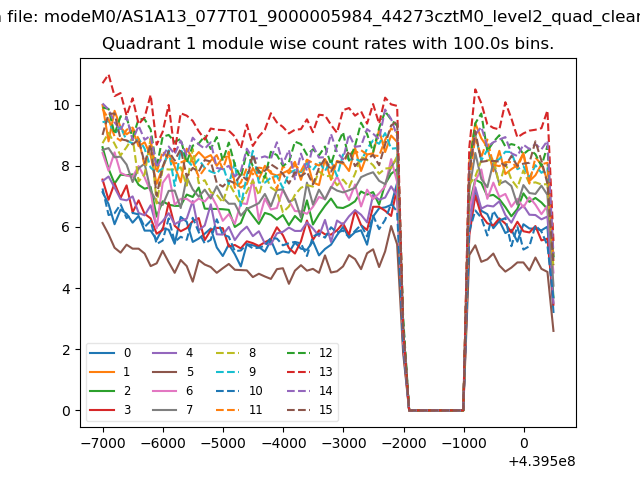
| Module-wise count rates for Quadrant A Data is divided into 100 sec bins |
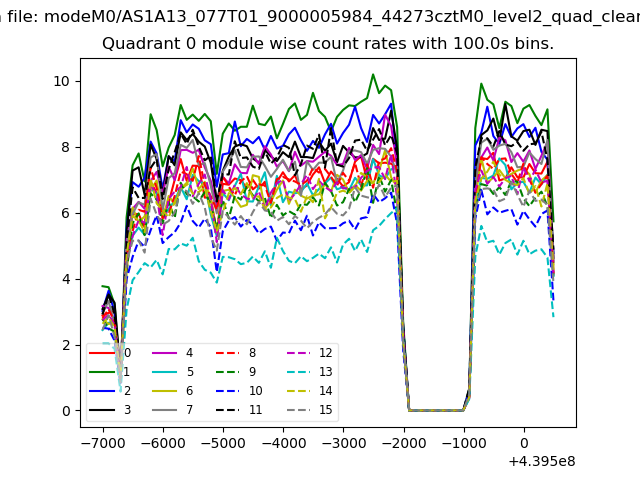 |
 |
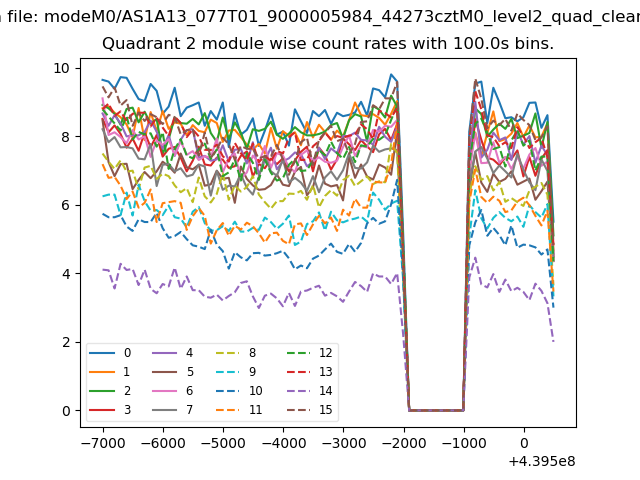
| Module-wise count rates for Quadrant B Data is divided into 100 sec bins |
 |
 |
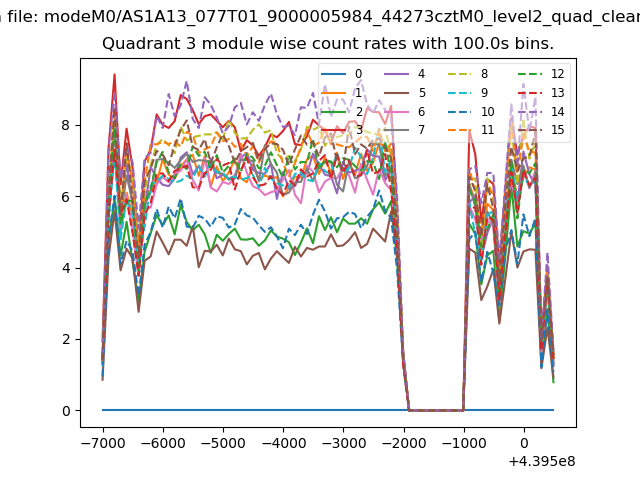
| Module-wise count rates for Quadrant C Data is divided into 100 sec bins |
 |
 |
| Module-wise count rates for Quadrant D Data is divided into 100 sec bins |
 |
 |
| Parameter | Plot |
|---|---|
| CZT HV Monitor |  |
| D_VDD | 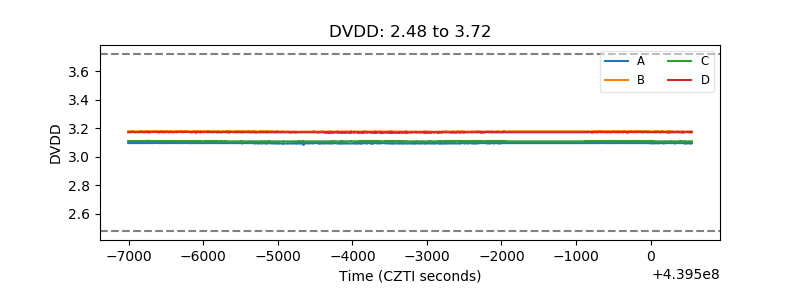 |
| Temperature 1 | 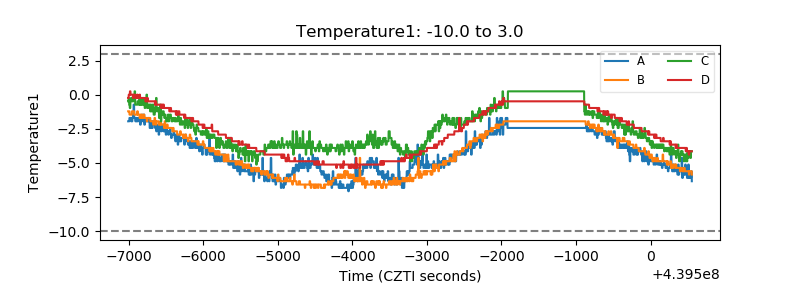 |
| Veto HV Monitor | 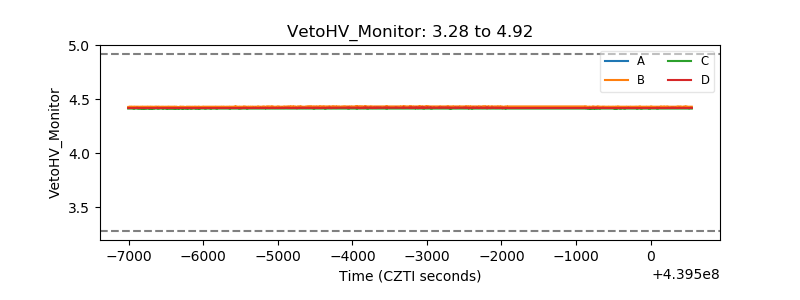 |
| Veto LLD | 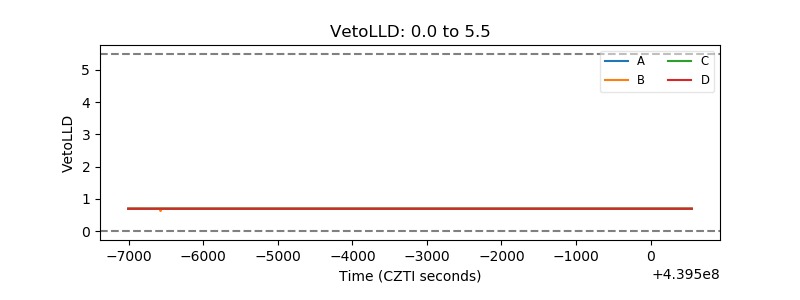 |
| Alpha Counter | 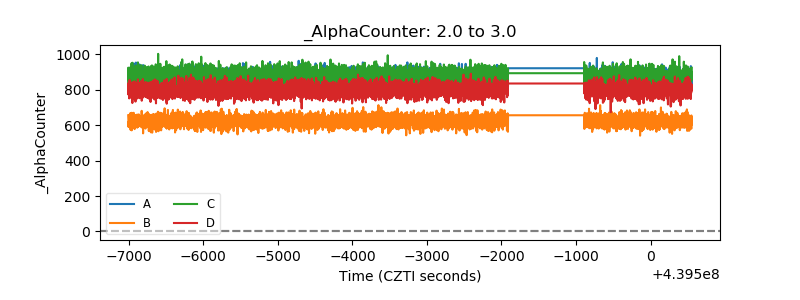 |
| _CPM_Rate | 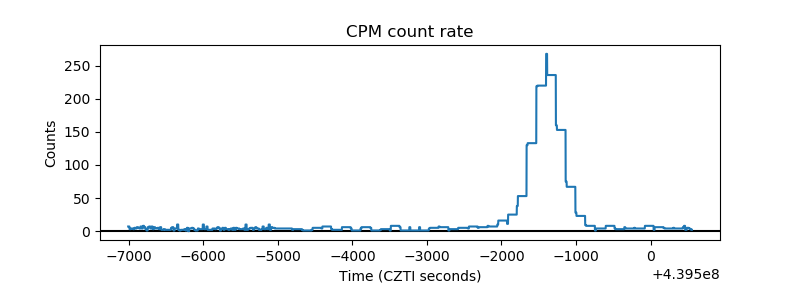 |
| CZT Counter | 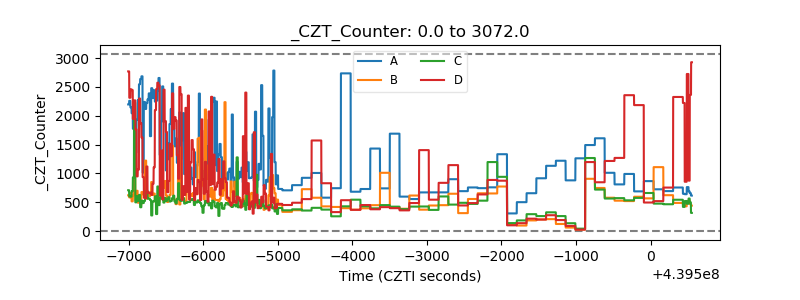 |
| +2.5 Volts monitor | 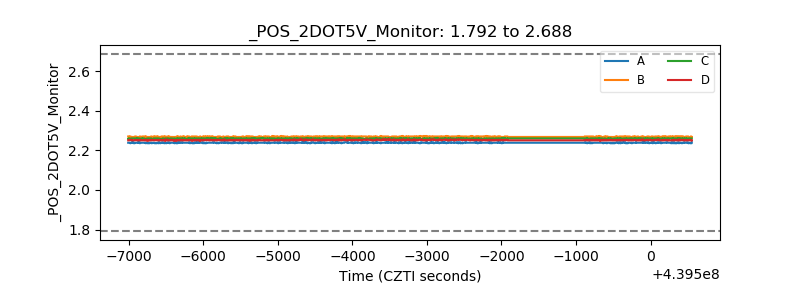 |
| +5 Volts monitor | 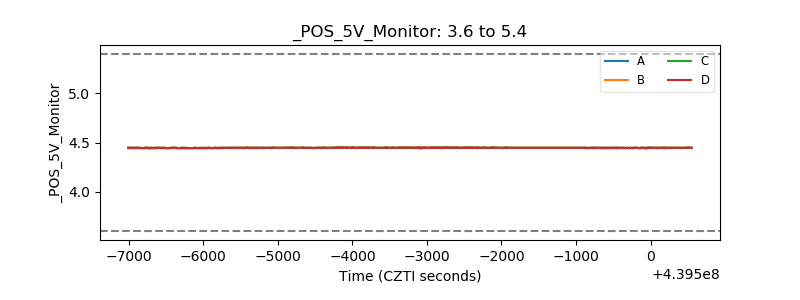 |
| _ROLL_ROT | 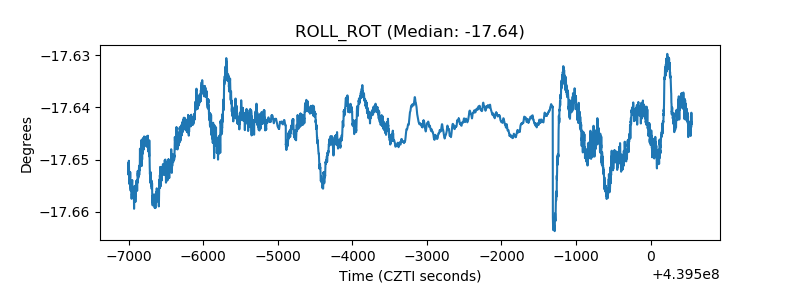 |
| _Roll_DEC | 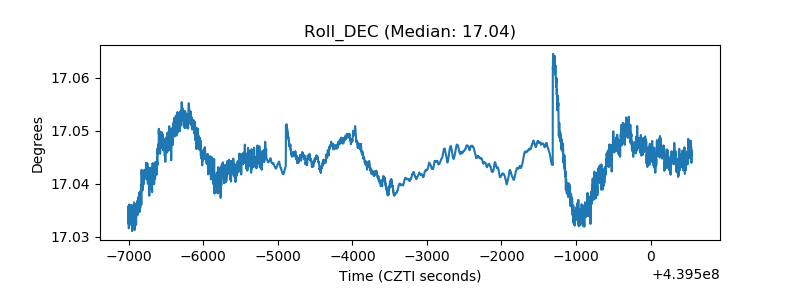 |
| _Roll_RA | 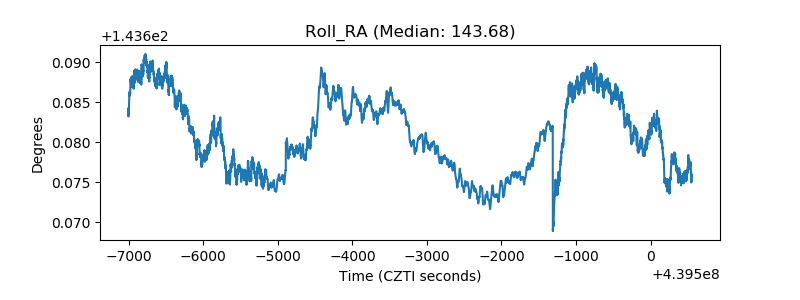 |
| Veto Counter | 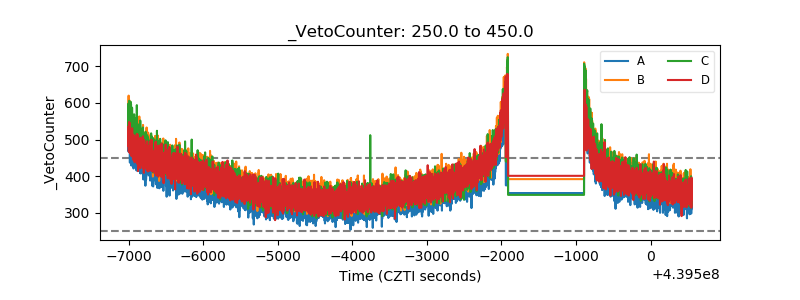 |