| Param | Original file | Final file |
|---|---|---|
| Filename | modeM0/AS1A13_077T01_9000005984_44274cztM0_level2.fits | modeM0/AS1A13_077T01_9000005984_44274cztM0_level2_quad_clean.evt |
| Size (bytes) | 552,882,240 | 114,269,760 |
| Size | 527.3 MB | 109.0 MB |
| Events in quadrant A | 5,401,406 | 769,036 |
| Events in quadrant B | 4,037,102 | 796,877 |
| Events in quadrant C | 3,901,542 | 762,087 |
| Events in quadrant D | 6,581,697 | 643,308 |
| Mode M0 | |||
|---|---|---|---|
| Quadrant | BADHDUFLAG | Total packets | Discarded packets |
| A | 0 | 21254 | 2 |
| B | 0 | 16785 | 2 |
| C | 0 | 16259 | 2 |
| D | 0 | 24492 | 2 |
| Mode M9 | |||
|---|---|---|---|
| Quadrant | BADHDUFLAG | Total packets | Discarded packets |
| A | 0 | 7 | 0 |
| B | 0 | 8 | 0 |
| C | 0 | 8 | 0 |
| D | 0 | 8 | 0 |
| Mode SS | |||
|---|---|---|---|
| Quadrant | BADHDUFLAG | Total packets | Discarded packets |
| A | 0 | 142 | 0 |
| B | 0 | 142 | 0 |
| C | 0 | 142 | 0 |
| D | 0 | 142 | 0 |
| Quadrant | Total seconds | Saturated seconds | Saturation percentage |
|---|---|---|---|
| A | 7015 | 274 | 3.905916% |
| B | 7015 | 180 | 2.565930% |
| C | 7015 | 113 | 1.610834% |
| D | 7015 | 851 | 12.131148% |
Noise dominated data is calculated using 1-second bins in cleaned event files. If a bin has >2000 counts, and if more than 50% of those come from <1% of pixels, then it is considered to be noise-dominated and hence unusable.
| Quadrant | # 1 sec bins | Bins with >0 counts | Bins with >2000 counts | High rate bins dominated by noise | Noise dominated (total time) | Noise dominated (detector-on time) | Marked lightcurve |
|---|---|---|---|---|---|---|---|
| A | 7695 | 7016 | 30 | 30 | 0.39% | 0.43% | 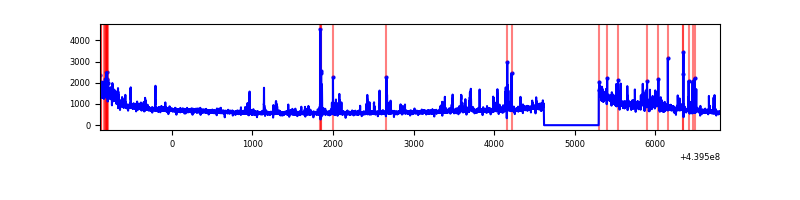 |
| B | 7695 | 7016 | 59 | 59 | 0.77% | 0.84% | 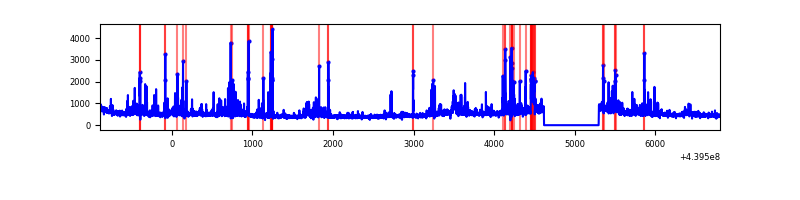 |
| C | 7695 | 7016 | 39 | 39 | 0.51% | 0.56% | 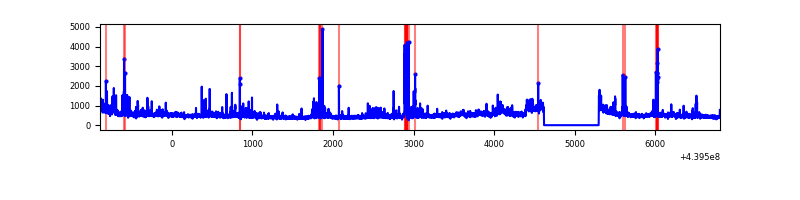 |
| D | 7695 | 7016 | 654 | 654 | 8.50% | 9.32% | 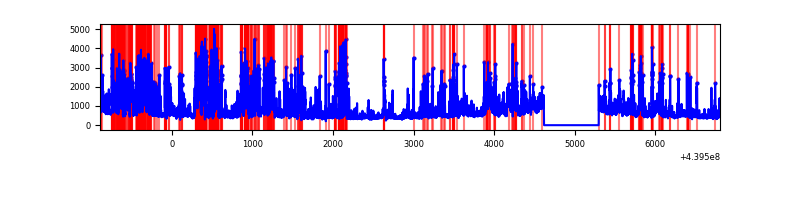 |
Top three noisy pixels from each quadrant. If the there are fewer than three noisy pixels in the level2.evt file, extra rows are filled as -1
| Pixel properties | Quadrant properties | ||||||
|---|---|---|---|---|---|---|---|
| Quadrant | DetID | PixID | Counts | Sigma | Mean | Median | Sigma |
| A | 10 | 83 | 1741199 | 10317.26 | 807 | 789 | 168.7 |
| A | 15 | 223 | 303808 | 1796.32 | 807 | 789 | 168.7 |
| A | 7 | 3 | 122418 | 721.02 | 807 | 789 | 168.7 |
| B | 0 | 219 | 178846 | 1104.95 | 808 | 782 | 161.2 |
| B | 0 | 200 | 154157 | 951.75 | 808 | 782 | 161.2 |
| B | 5 | 235 | 126243 | 778.53 | 808 | 782 | 161.2 |
| C | 3 | 233 | 491519 | 2608.3 | 795 | 800 | 188.1 |
| C | 14 | 254 | 165452 | 875.17 | 795 | 800 | 188.1 |
| C | 4 | 254 | 133126 | 703.35 | 795 | 800 | 188.1 |
| D | 1 | 52 | 1661925 | 8669.01 | 762 | 739 | 191.6 |
| D | 2 | 249 | 405382 | 2111.65 | 762 | 739 | 191.6 |
| D | 13 | 249 | 337818 | 1759.07 | 762 | 739 | 191.6 |
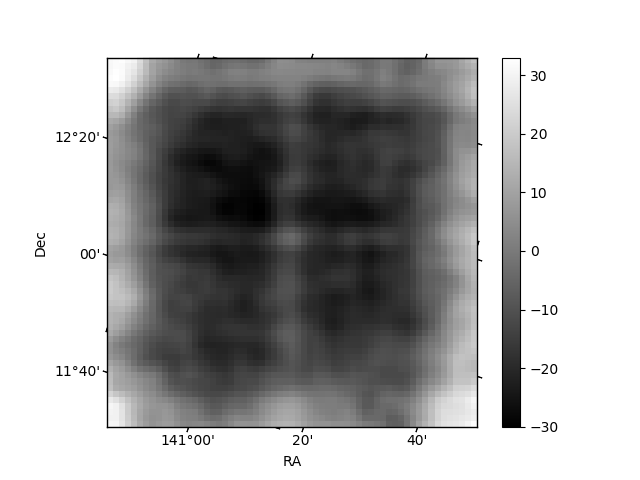
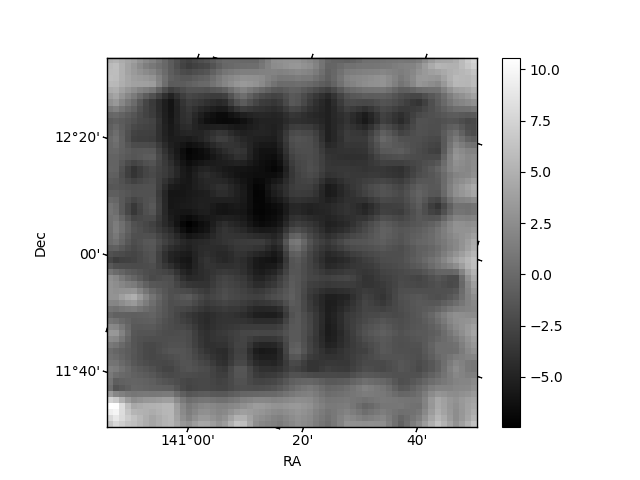
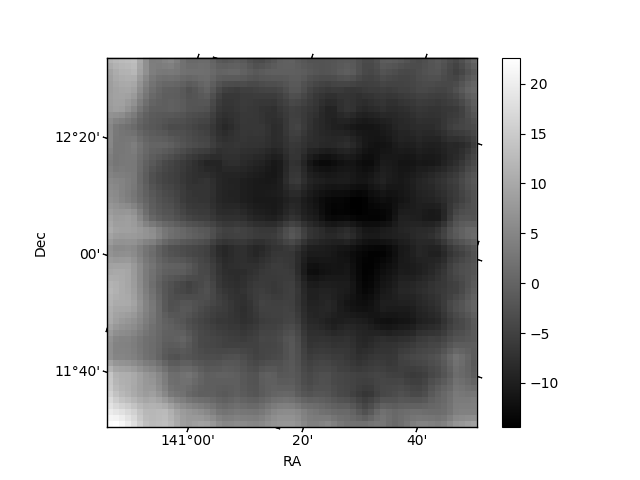
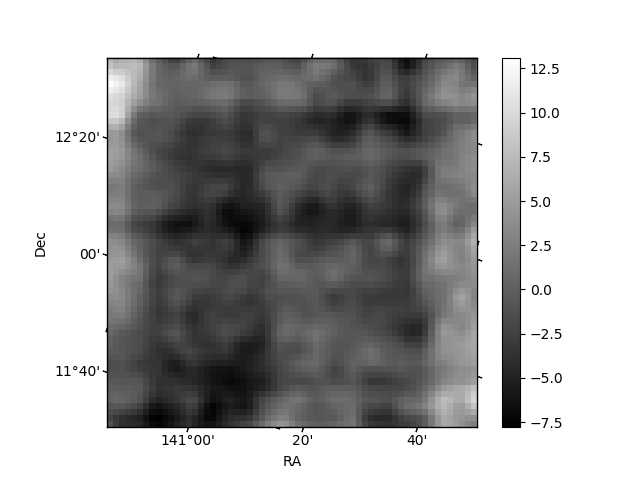
Histogram calculated using DETX and DETY for each event in the final _common_clean file
| Quadrant A | 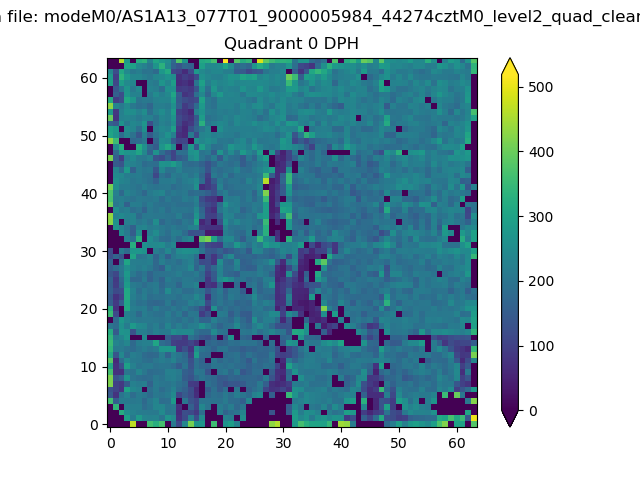 |
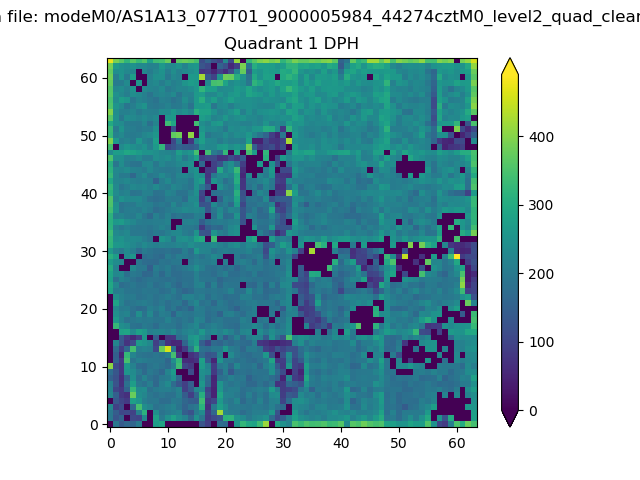 |
Quadrant B |
|---|---|---|---|
| Quadrant D | 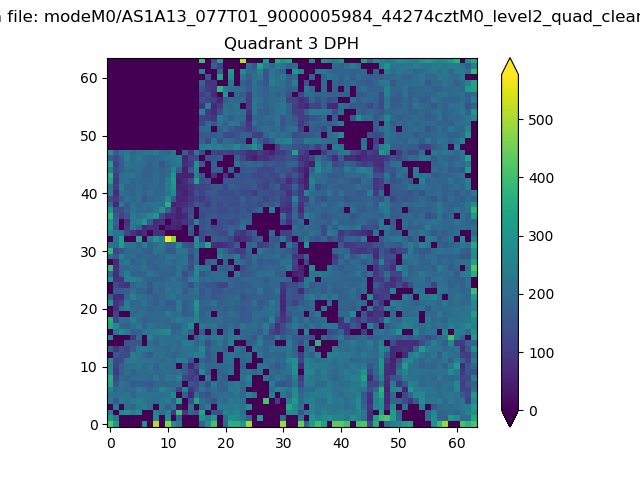 |
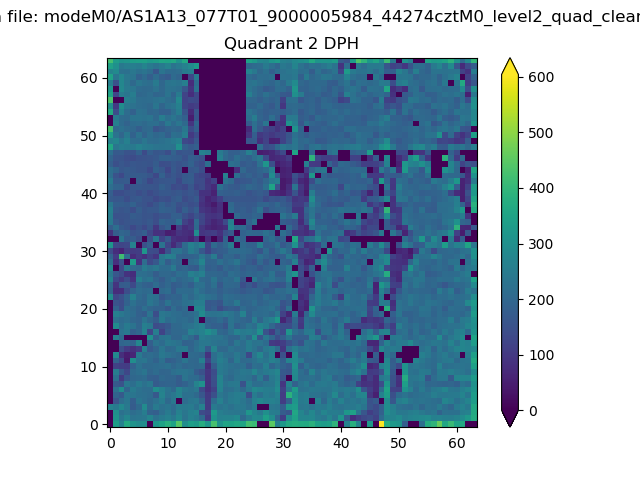 |
Quadrant C |
| Plot type | Count rate plots | Images |
|---|---|---|
| Comparison with Poisson distribution Blue bars denote a histogram of data divided into 1 sec bins. Red curve is a Poisson curve with rate = median count rate of data. |
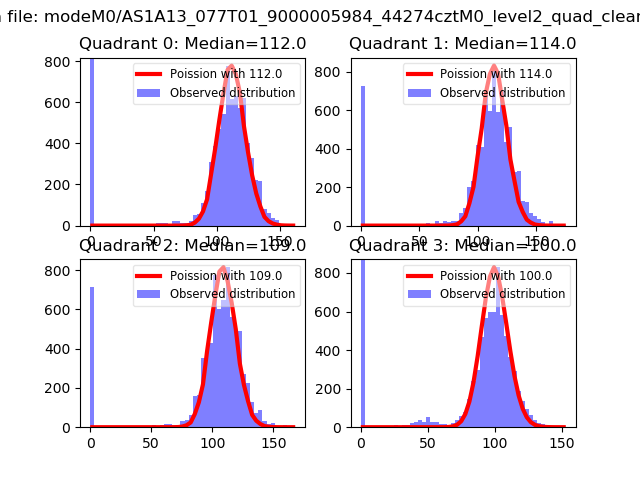 |
 |
| Quadrant-wise count rates Data is divided into 100 sec bins |
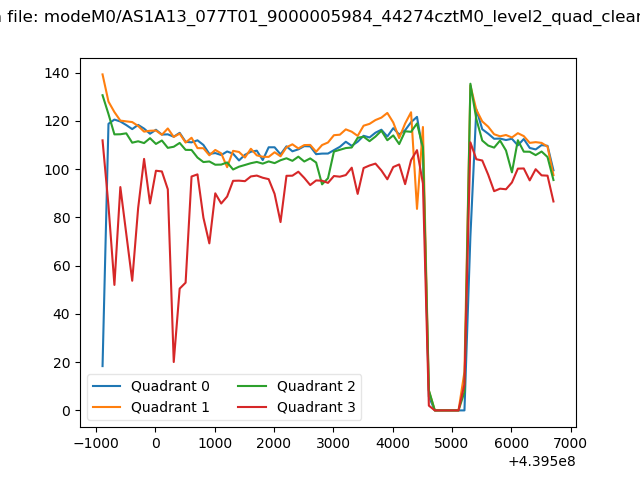 |
|
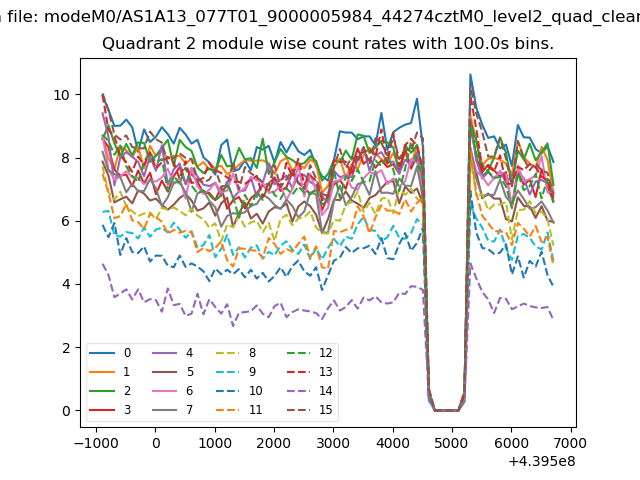
| Module-wise count rates for Quadrant A Data is divided into 100 sec bins |
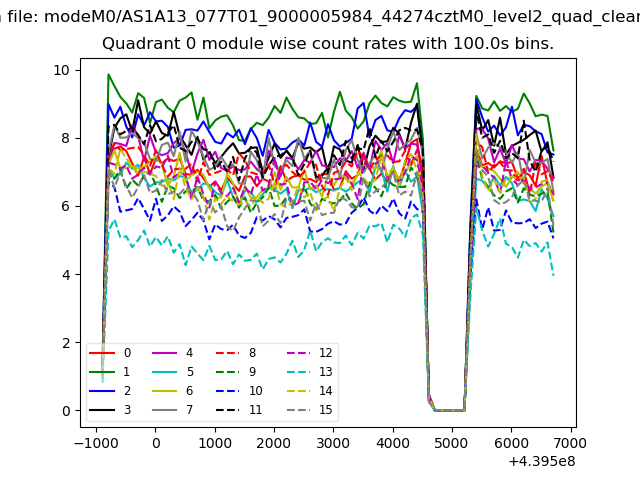 |
 |
| Module-wise count rates for Quadrant B Data is divided into 100 sec bins |
 |
 |
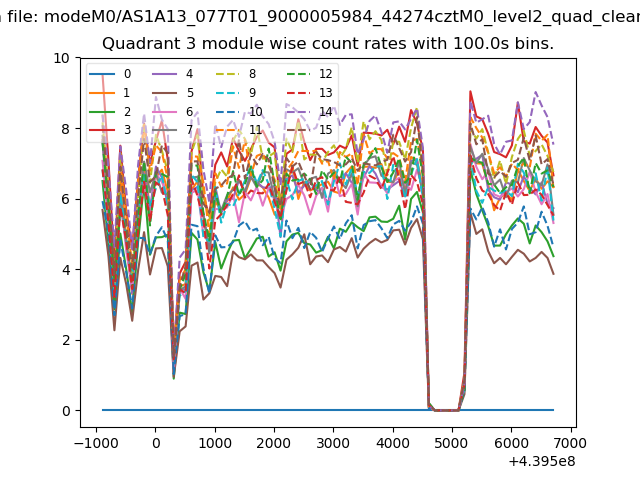
| Module-wise count rates for Quadrant C Data is divided into 100 sec bins |
 |
 |
| Module-wise count rates for Quadrant D Data is divided into 100 sec bins |
 |
 |
| Parameter | Plot |
|---|---|
| CZT HV Monitor | 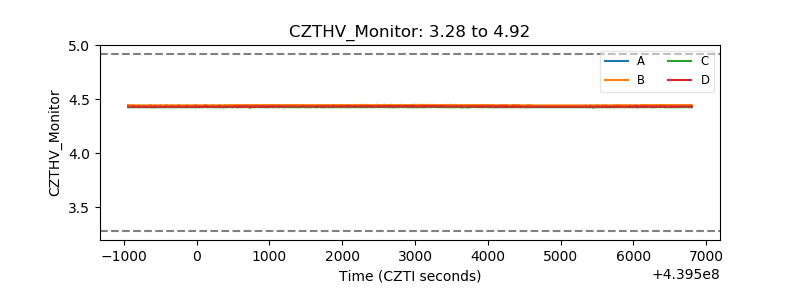 |
| D_VDD | 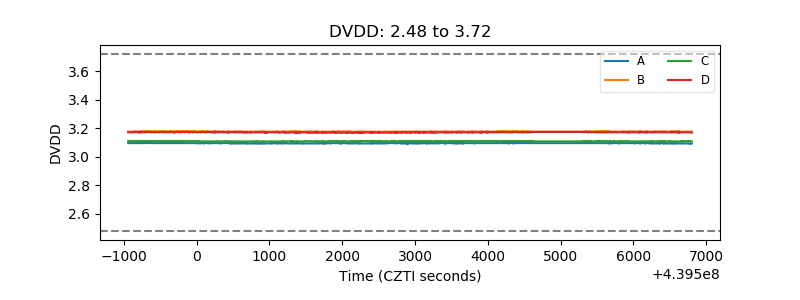 |
| Temperature 1 | 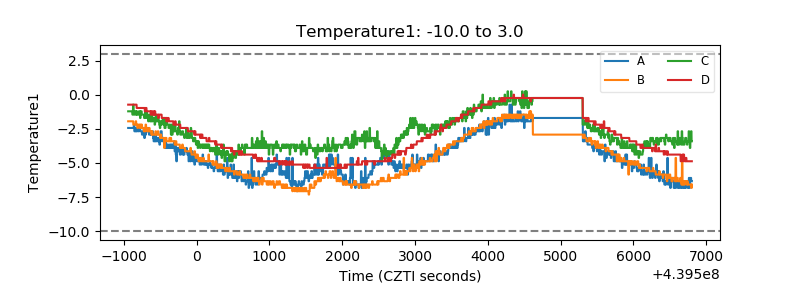 |
| Veto HV Monitor | 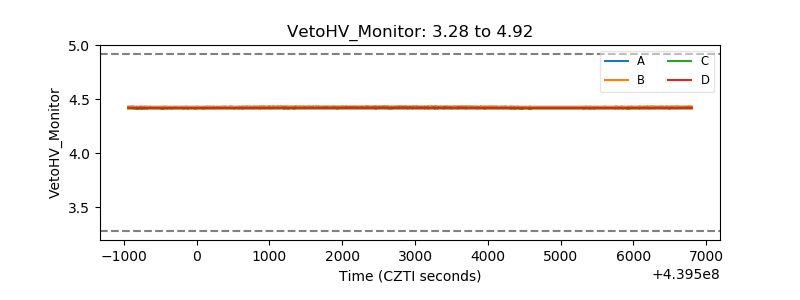 |
| Veto LLD | 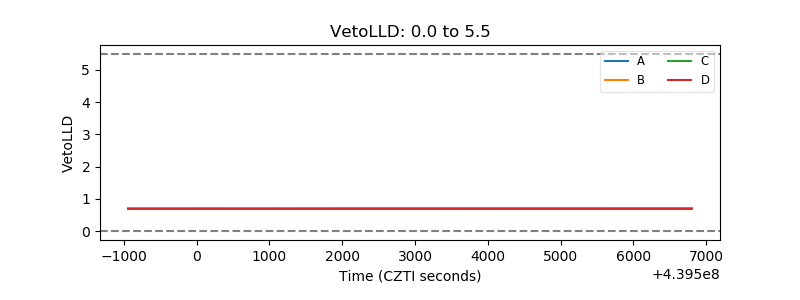 |
| Alpha Counter | 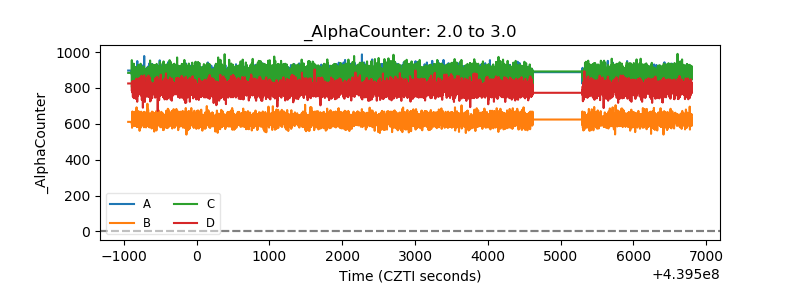 |
| _CPM_Rate | 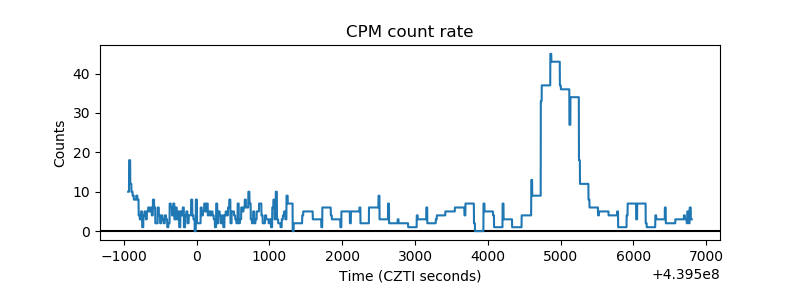 |
| CZT Counter | 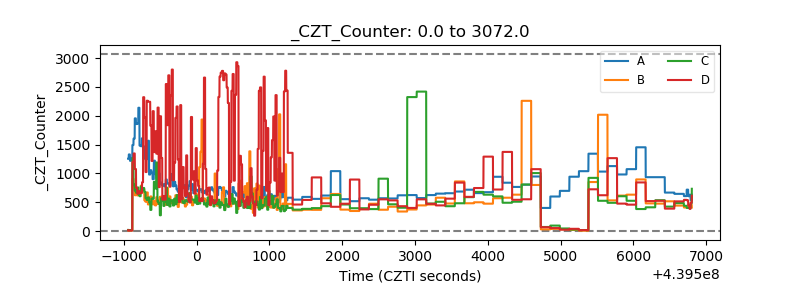 |
| +2.5 Volts monitor | 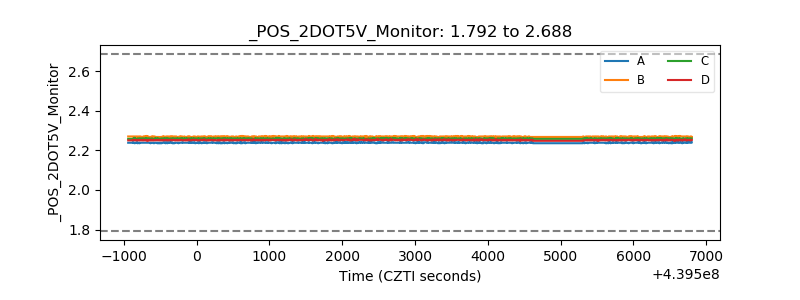 |
| +5 Volts monitor | 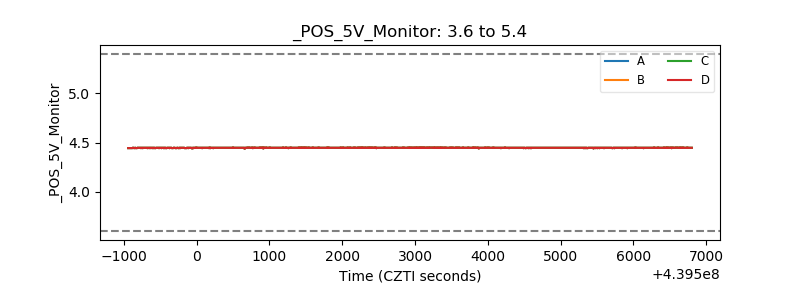 |
| _ROLL_ROT | 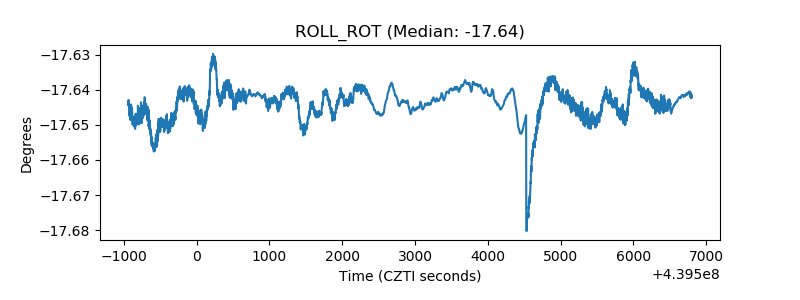 |
| _Roll_DEC | 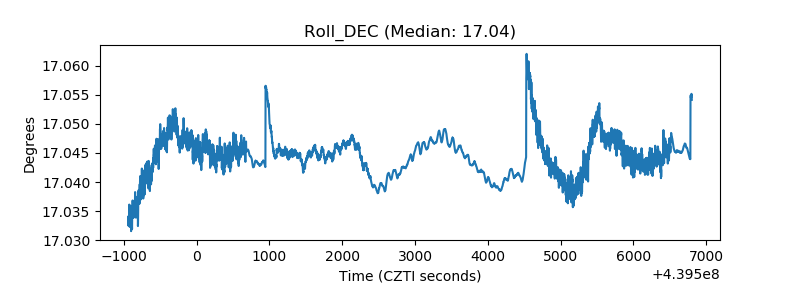 |
| _Roll_RA | 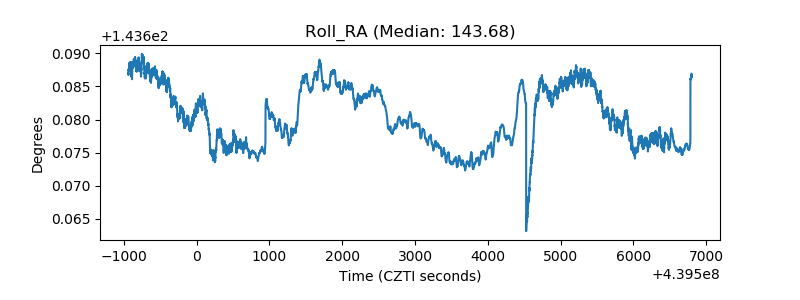 |
| Veto Counter | 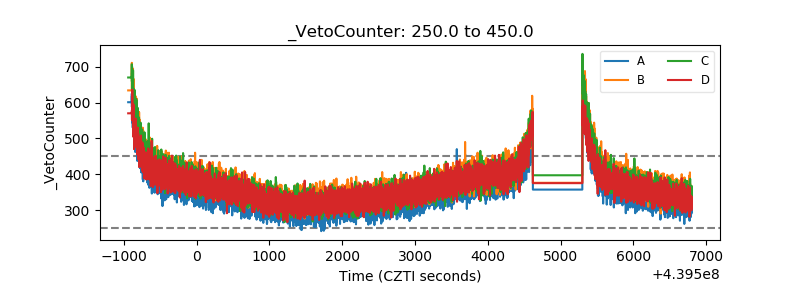 |