| Param | Original file | Final file |
|---|---|---|
| Filename | modeM0/AS1A13_077T01_9000005984_44275cztM0_level2.fits | modeM0/AS1A13_077T01_9000005984_44275cztM0_level2_quad_clean.evt |
| Size (bytes) | 570,657,600 | 128,200,320 |
| Size | 544.2 MB | 122.3 MB |
| Events in quadrant A | 6,176,496 | 845,748 |
| Events in quadrant B | 4,178,872 | 887,793 |
| Events in quadrant C | 4,214,932 | 847,440 |
| Events in quadrant D | 5,944,936 | 754,717 |
| Mode M0 | |||
|---|---|---|---|
| Quadrant | BADHDUFLAG | Total packets | Discarded packets |
| A | 0 | 24096 | 2 |
| B | 0 | 17838 | 2 |
| C | 0 | 18100 | 2 |
| D | 0 | 23127 | 2 |
| Mode M9 | |||
|---|---|---|---|
| Quadrant | BADHDUFLAG | Total packets | Discarded packets |
| A | 0 | 3 | 0 |
| B | 0 | 4 | 0 |
| C | 0 | 4 | 0 |
| D | 0 | 4 | 0 |
| Mode SS | |||
|---|---|---|---|
| Quadrant | BADHDUFLAG | Total packets | Discarded packets |
| A | 0 | 158 | 0 |
| B | 0 | 158 | 0 |
| C | 0 | 158 | 0 |
| D | 0 | 158 | 0 |
| Quadrant | Total seconds | Saturated seconds | Saturation percentage |
|---|---|---|---|
| A | 7850 | 366 | 4.662420% |
| B | 7849 | 172 | 2.191362% |
| C | 7849 | 110 | 1.401452% |
| D | 7849 | 433 | 5.516626% |
Noise dominated data is calculated using 1-second bins in cleaned event files. If a bin has >2000 counts, and if more than 50% of those come from <1% of pixels, then it is considered to be noise-dominated and hence unusable.
| Quadrant | # 1 sec bins | Bins with >0 counts | Bins with >2000 counts | High rate bins dominated by noise | Noise dominated (total time) | Noise dominated (detector-on time) | Marked lightcurve |
|---|---|---|---|---|---|---|---|
| A | 7865 | 7851 | 43 | 43 | 0.55% | 0.55% | 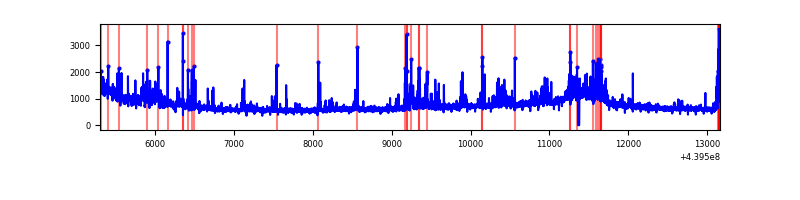 |
| B | 7864 | 7850 | 17 | 17 | 0.22% | 0.22% | 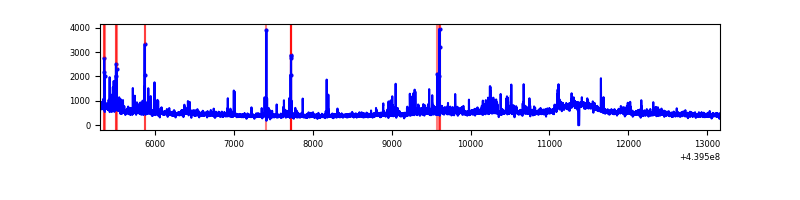 |
| C | 7864 | 7850 | 36 | 36 | 0.46% | 0.46% | 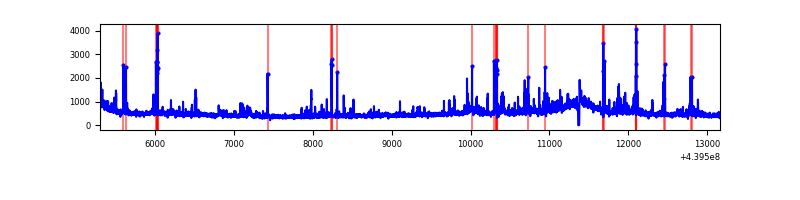 |
| D | 7864 | 7850 | 294 | 294 | 3.74% | 3.75% | 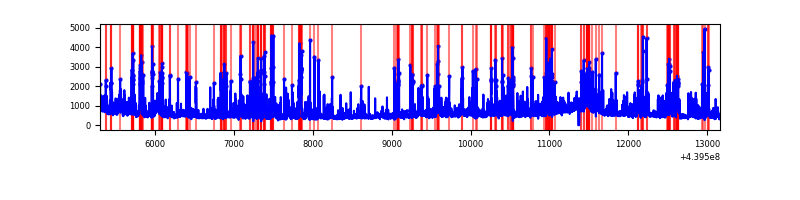 |
Top three noisy pixels from each quadrant. If the there are fewer than three noisy pixels in the level2.evt file, extra rows are filled as -1
| Pixel properties | Quadrant properties | ||||||
|---|---|---|---|---|---|---|---|
| Quadrant | DetID | PixID | Counts | Sigma | Mean | Median | Sigma |
| A | 10 | 83 | 1736632 | 9043.21 | 918 | 899 | 191.9 |
| A | 15 | 223 | 485241 | 2523.43 | 918 | 899 | 191.9 |
| A | 7 | 3 | 283330 | 1471.47 | 918 | 899 | 191.9 |
| B | 0 | 219 | 135083 | 727.91 | 924 | 893 | 184.3 |
| B | 0 | 190 | 122900 | 661.82 | 924 | 893 | 184.3 |
| B | 0 | 200 | 71264 | 381.73 | 924 | 893 | 184.3 |
| C | 3 | 233 | 384850 | 1773.07 | 904 | 906 | 216.5 |
| C | 14 | 254 | 191240 | 878.97 | 904 | 906 | 216.5 |
| C | 4 | 254 | 102916 | 471.09 | 904 | 906 | 216.5 |
| D | 1 | 52 | 607224 | 2677.91 | 884 | 855 | 226.4 |
| D | 13 | 249 | 468626 | 2065.82 | 884 | 855 | 226.4 |
| D | 2 | 249 | 403158 | 1776.69 | 884 | 855 | 226.4 |
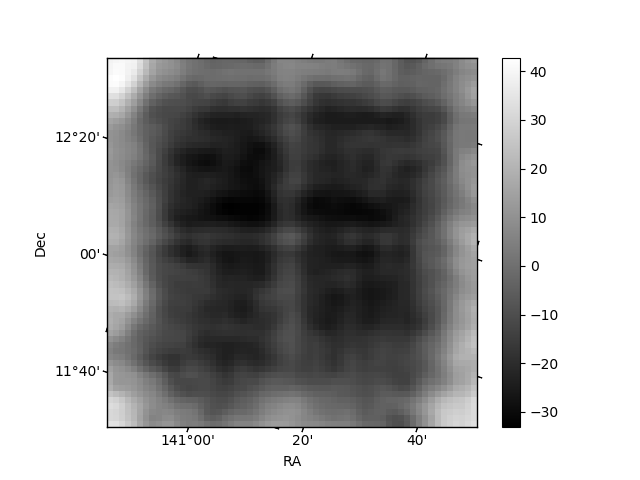
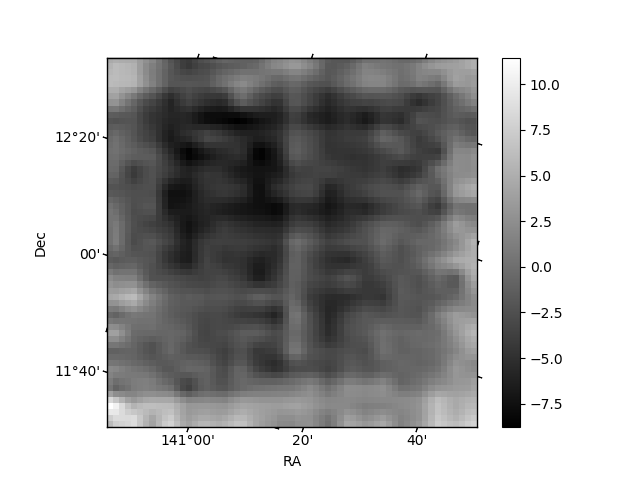
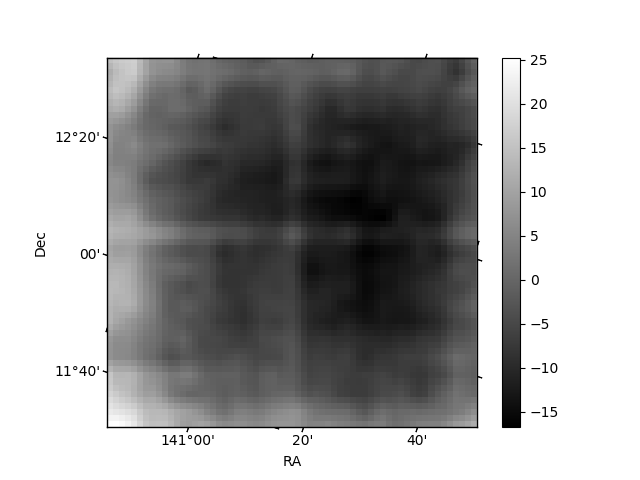
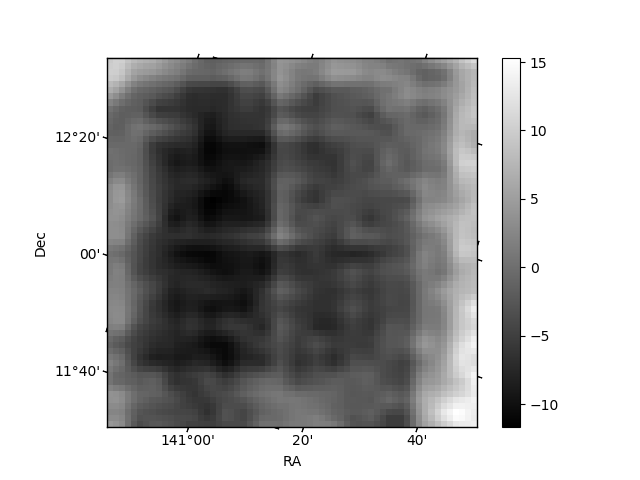
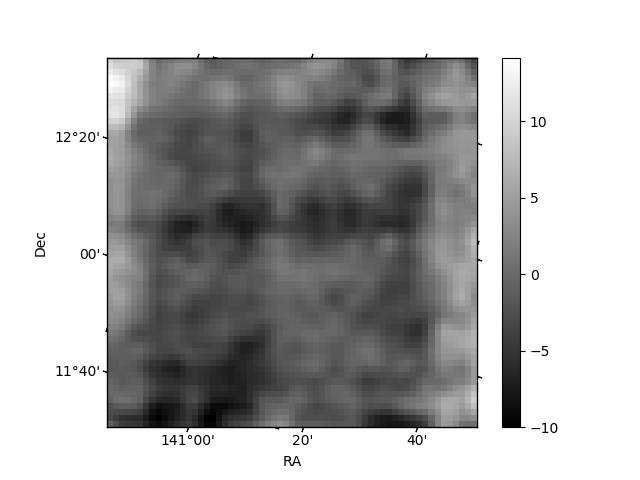
Histogram calculated using DETX and DETY for each event in the final _common_clean file
| Quadrant A | 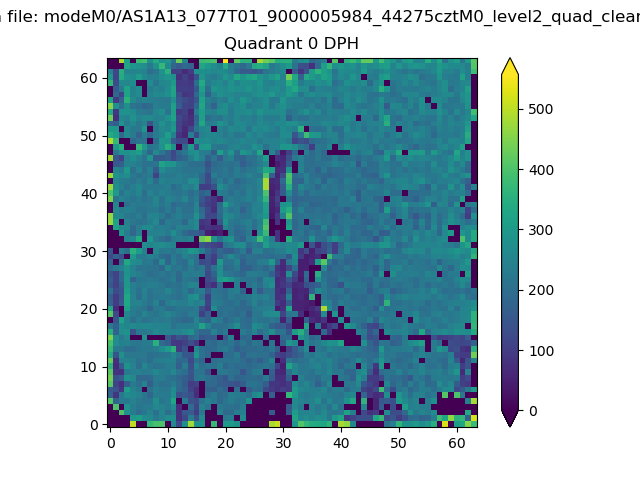 |
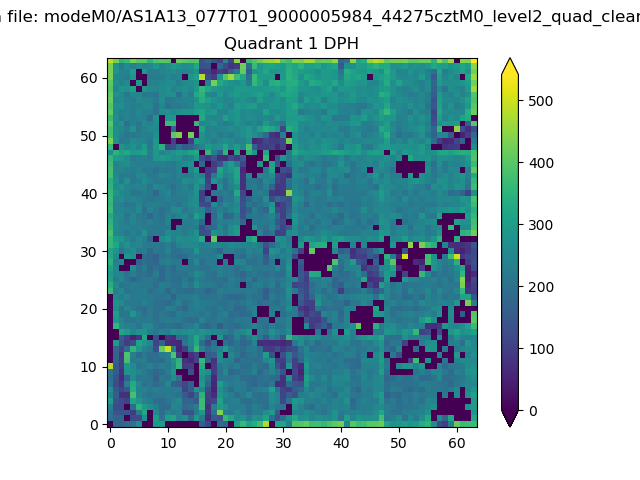 |
Quadrant B |
|---|---|---|---|
| Quadrant D | 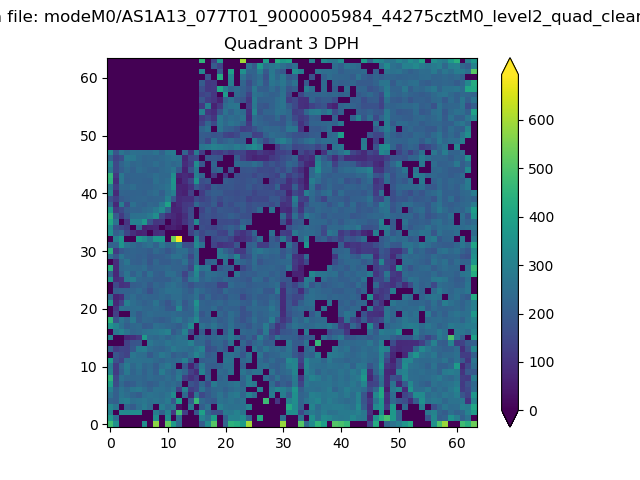 |
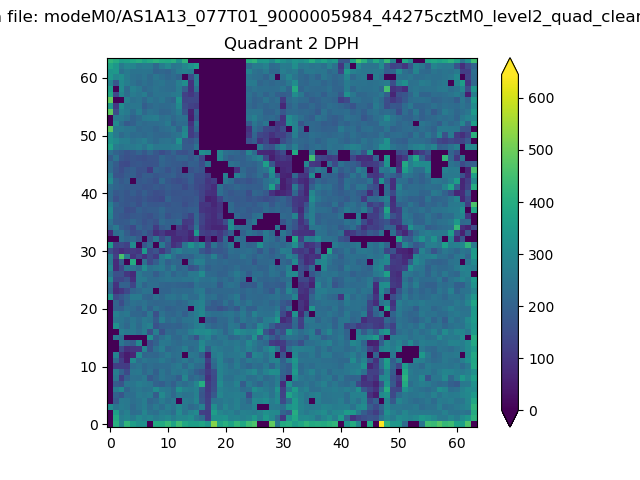 |
Quadrant C |
| Plot type | Count rate plots | Images |
|---|---|---|
| Comparison with Poisson distribution Blue bars denote a histogram of data divided into 1 sec bins. Red curve is a Poisson curve with rate = median count rate of data. |
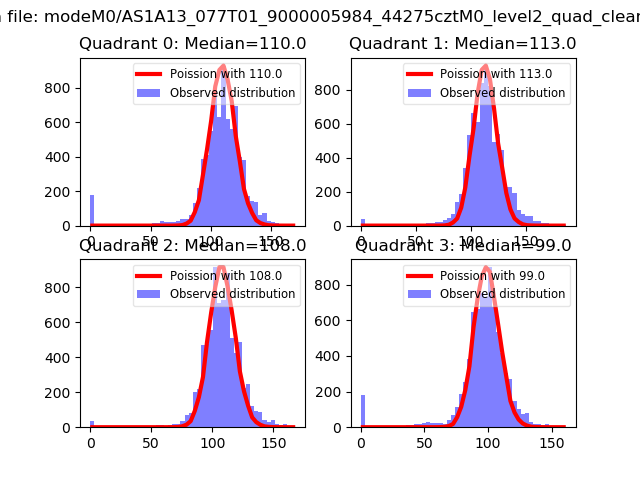 |
 |
| Quadrant-wise count rates Data is divided into 100 sec bins |
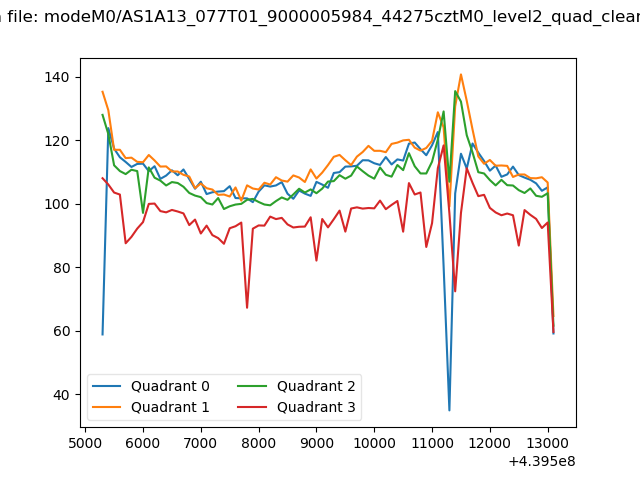 |
|
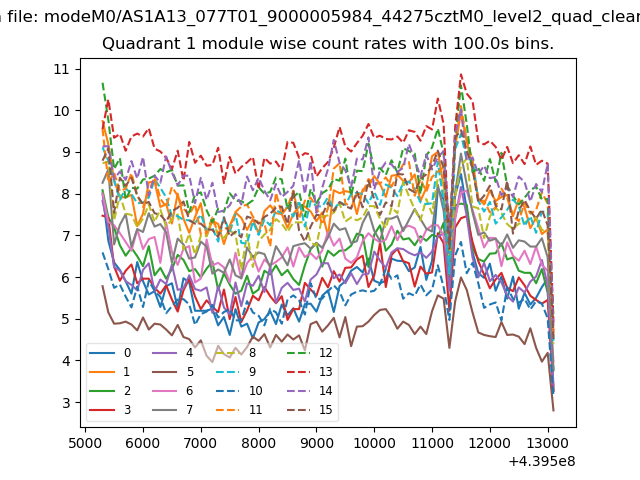
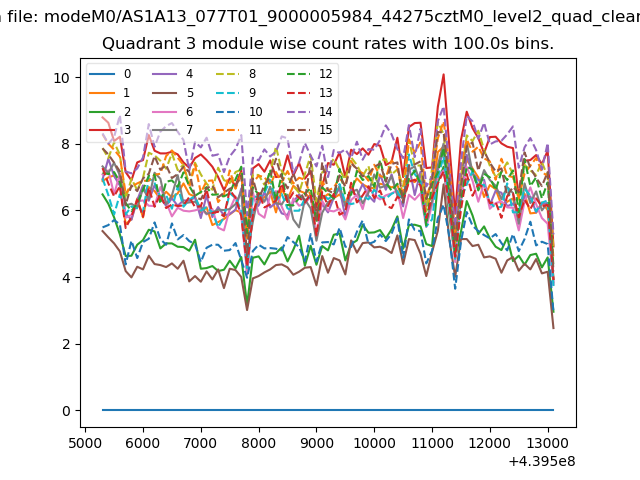
| Module-wise count rates for Quadrant A Data is divided into 100 sec bins |
 |
 |
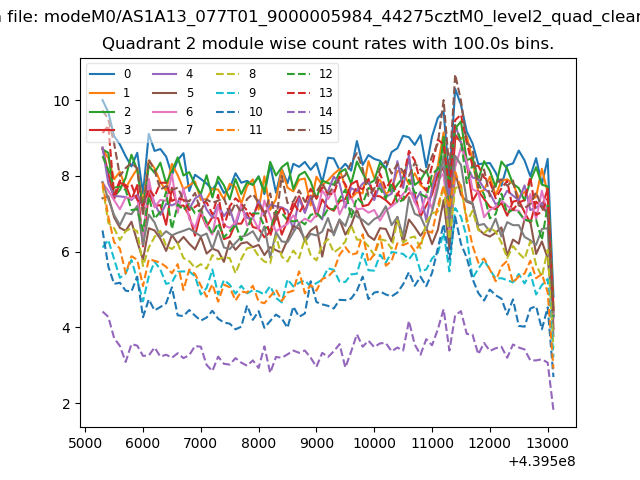
| Module-wise count rates for Quadrant B Data is divided into 100 sec bins |
 |
 |
| Module-wise count rates for Quadrant C Data is divided into 100 sec bins |
 |
 |
| Module-wise count rates for Quadrant D Data is divided into 100 sec bins |
 |
 |
| Parameter | Plot |
|---|---|
| CZT HV Monitor | 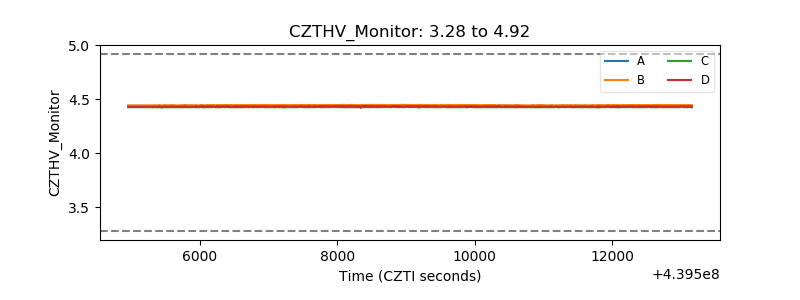 |
| D_VDD | 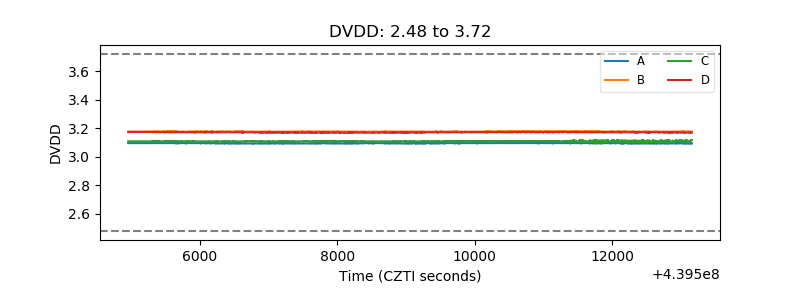 |
| Temperature 1 | 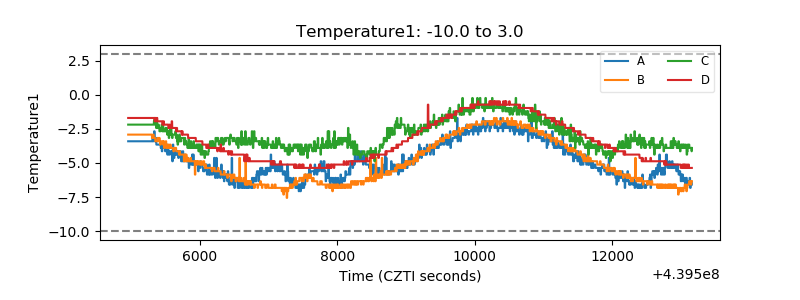 |
| Veto HV Monitor | 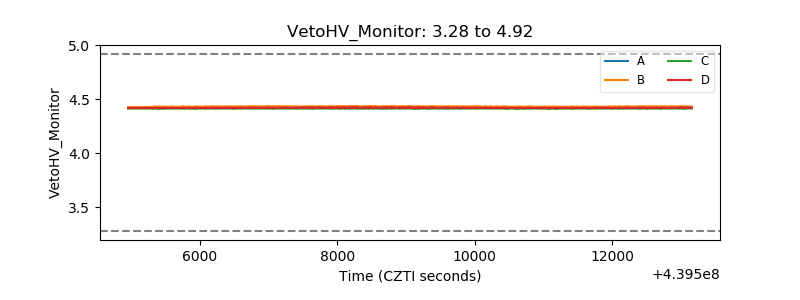 |
| Veto LLD | 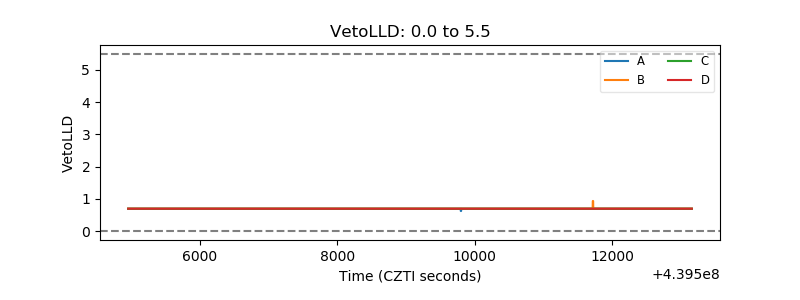 |
| Alpha Counter | 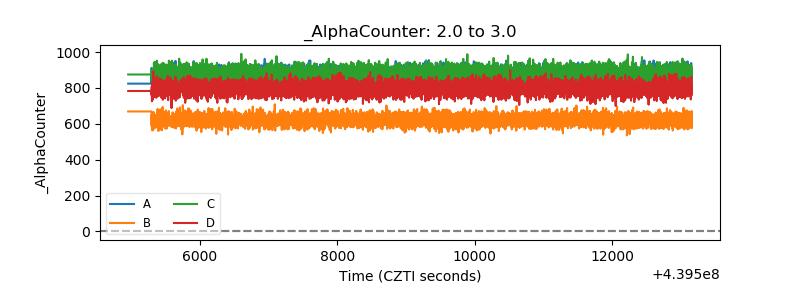 |
| _CPM_Rate | 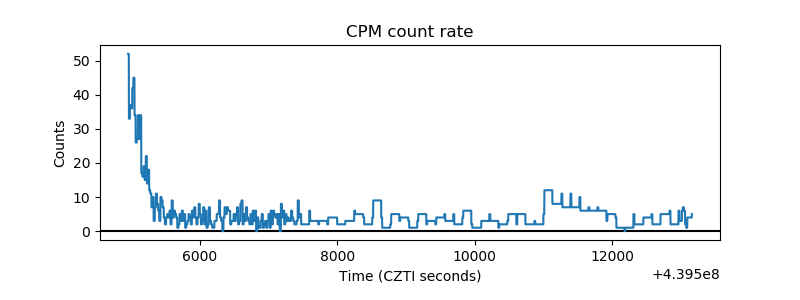 |
| CZT Counter | 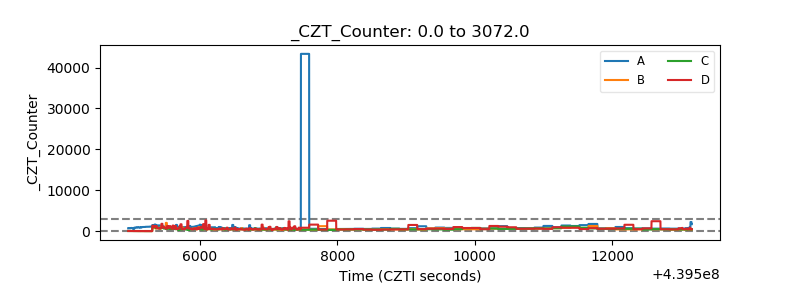 |
| +2.5 Volts monitor | 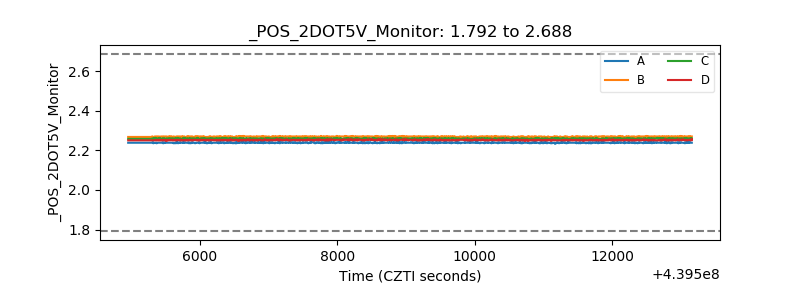 |
| +5 Volts monitor | 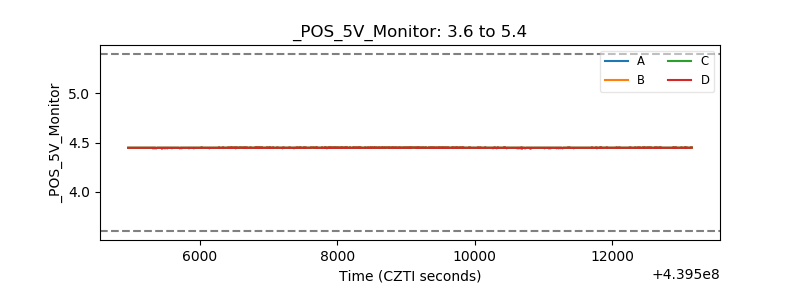 |
| _ROLL_ROT | 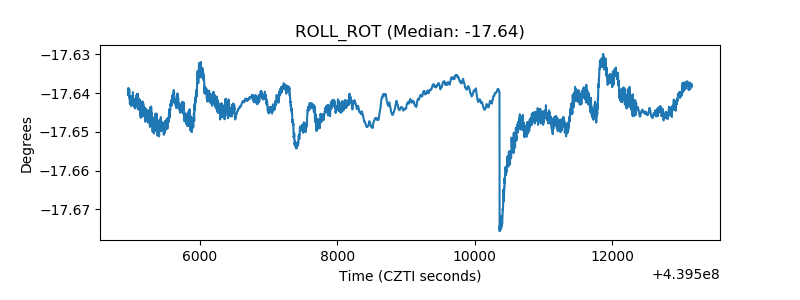 |
| _Roll_DEC | 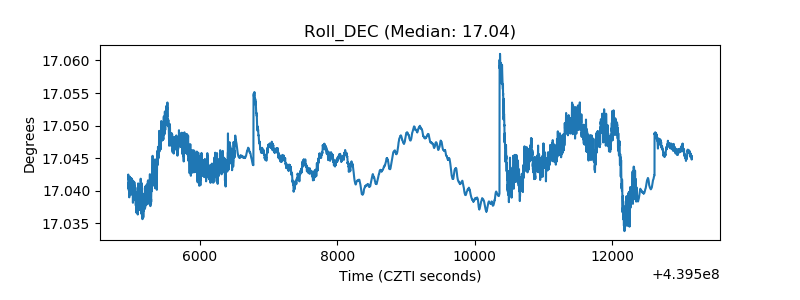 |
| _Roll_RA | 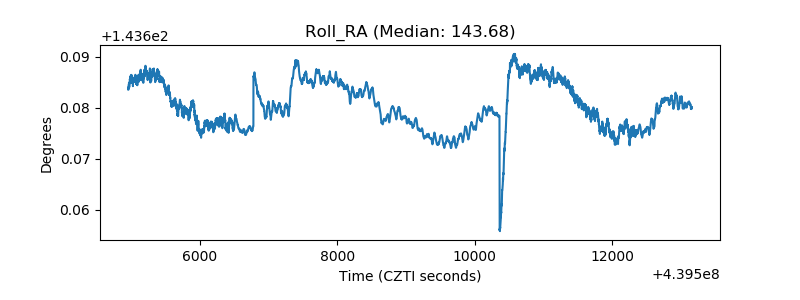 |
| Veto Counter | 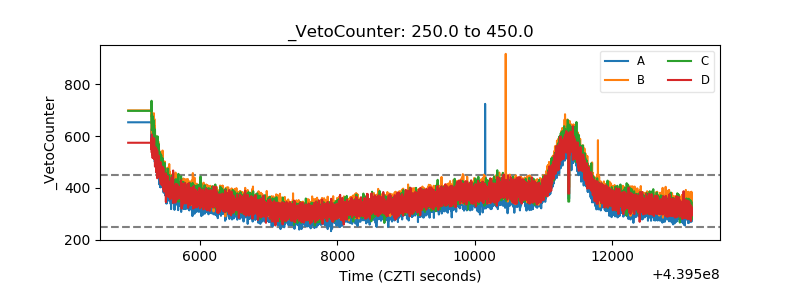 |