| Param | Original file | Final file |
|---|---|---|
| Filename | modeM0/AS1A13_077T01_9000005984_44276cztM0_level2.fits | modeM0/AS1A13_077T01_9000005984_44276cztM0_level2_quad_clean.evt |
| Size (bytes) | 676,100,160 | 140,135,040 |
| Size | 644.8 MB | 133.6 MB |
| Events in quadrant A | 9,220,906 | 865,839 |
| Events in quadrant B | 4,544,294 | 982,388 |
| Events in quadrant C | 4,884,698 | 938,355 |
| Events in quadrant D | 5,697,709 | 847,584 |
| Mode M0 | |||
|---|---|---|---|
| Quadrant | BADHDUFLAG | Total packets | Discarded packets |
| A | 0 | 33960 | 1 |
| B | 0 | 19563 | 1 |
| C | 0 | 20643 | 1 |
| D | 0 | 23190 | 1 |
| Mode SS | |||
|---|---|---|---|
| Quadrant | BADHDUFLAG | Total packets | Discarded packets |
| A | 0 | 176 | 0 |
| B | 0 | 176 | 0 |
| C | 0 | 176 | 0 |
| D | 0 | 176 | 0 |
| Quadrant | Total seconds | Saturated seconds | Saturation percentage |
|---|---|---|---|
| A | 8766 | 1250 | 14.259640% |
| B | 8766 | 191 | 2.178873% |
| C | 8767 | 110 | 1.254705% |
| D | 8767 | 327 | 3.729896% |
Noise dominated data is calculated using 1-second bins in cleaned event files. If a bin has >2000 counts, and if more than 50% of those come from <1% of pixels, then it is considered to be noise-dominated and hence unusable.
| Quadrant | # 1 sec bins | Bins with >0 counts | Bins with >2000 counts | High rate bins dominated by noise | Noise dominated (total time) | Noise dominated (detector-on time) | Marked lightcurve |
|---|---|---|---|---|---|---|---|
| A | 8781 | 8767 | 573 | 573 | 6.53% | 6.54% | 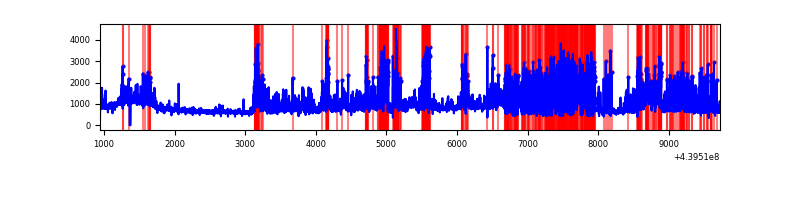 |
| B | 8781 | 8767 | 28 | 28 | 0.32% | 0.32% | 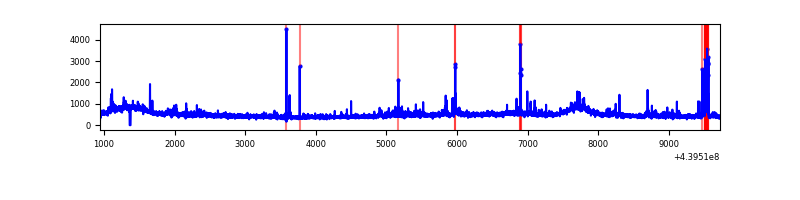 |
| C | 8782 | 8768 | 41 | 41 | 0.47% | 0.47% | 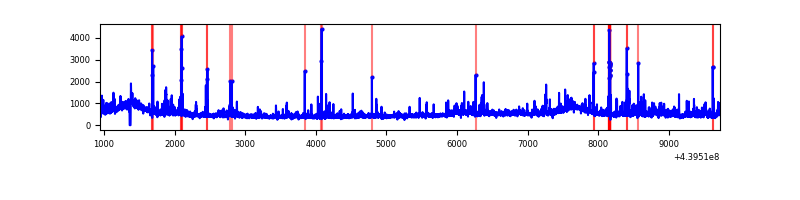 |
| D | 8782 | 8768 | 221 | 221 | 2.52% | 2.52% | 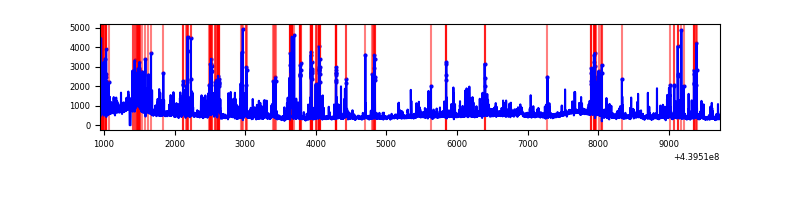 |
Top three noisy pixels from each quadrant. If the there are fewer than three noisy pixels in the level2.evt file, extra rows are filled as -1
| Pixel properties | Quadrant properties | ||||||
|---|---|---|---|---|---|---|---|
| Quadrant | DetID | PixID | Counts | Sigma | Mean | Median | Sigma |
| A | 15 | 223 | 2933247 | 14319.78 | 984 | 963 | 204.8 |
| A | 10 | 83 | 1745550 | 8519.68 | 984 | 963 | 204.8 |
| A | 13 | 248 | 543904 | 2651.45 | 984 | 963 | 204.8 |
| B | 0 | 190 | 131459 | 630.09 | 1033 | 1000 | 207.0 |
| B | 4 | 158 | 97740 | 467.24 | 1033 | 1000 | 207.0 |
| B | 0 | 155 | 52000 | 246.32 | 1033 | 1000 | 207.0 |
| C | 3 | 233 | 628615 | 2588.49 | 1010 | 1014 | 242.5 |
| C | 14 | 254 | 276265 | 1135.25 | 1010 | 1014 | 242.5 |
| C | 4 | 254 | 27213 | 108.06 | 1010 | 1014 | 242.5 |
| D | 13 | 249 | 539616 | 2100.57 | 995 | 963 | 256.4 |
| D | 2 | 249 | 394636 | 1535.2 | 995 | 963 | 256.4 |
| D | 1 | 52 | 252233 | 979.87 | 995 | 963 | 256.4 |
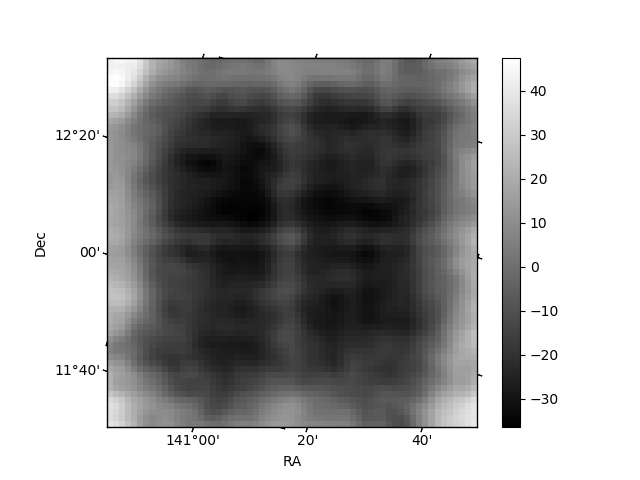
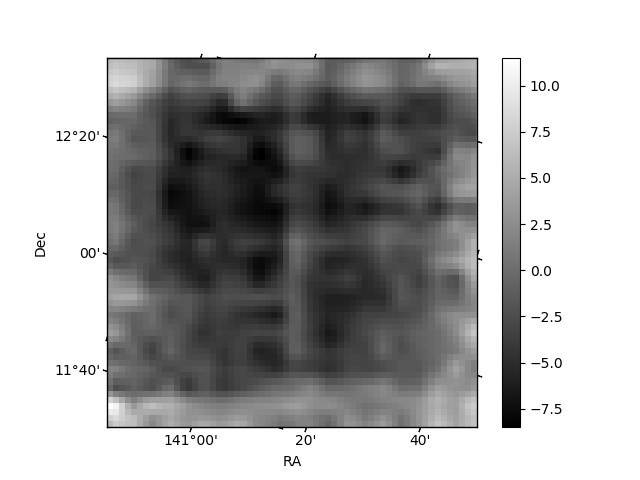
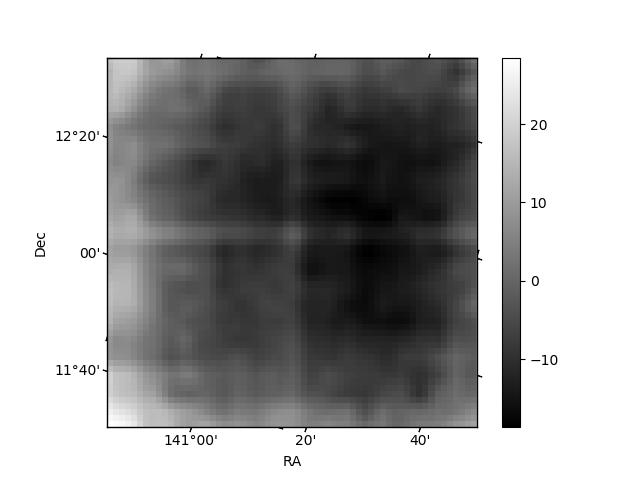
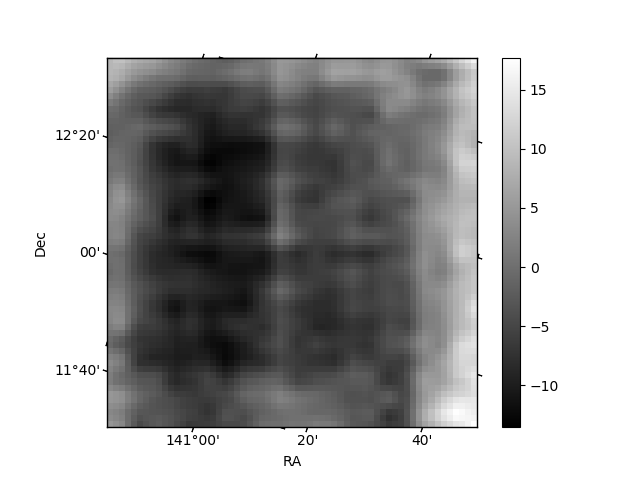
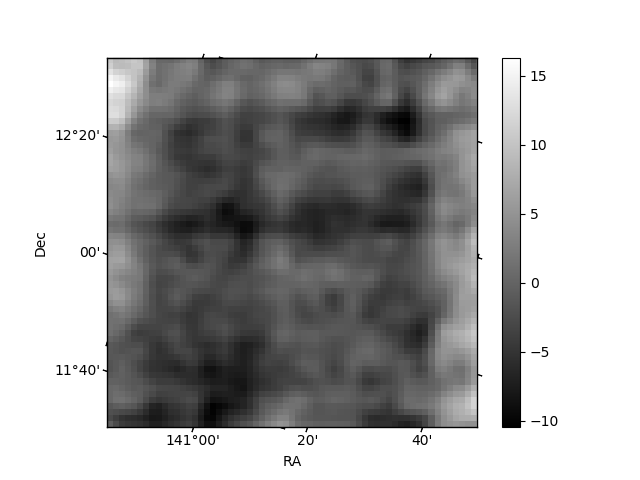
Histogram calculated using DETX and DETY for each event in the final _common_clean file
| Quadrant A | 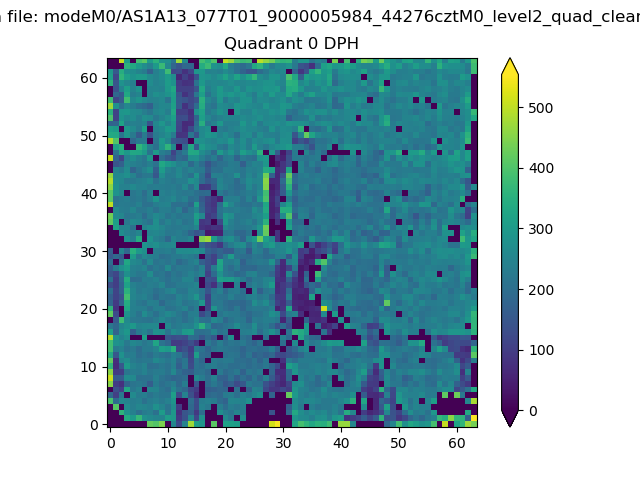 |
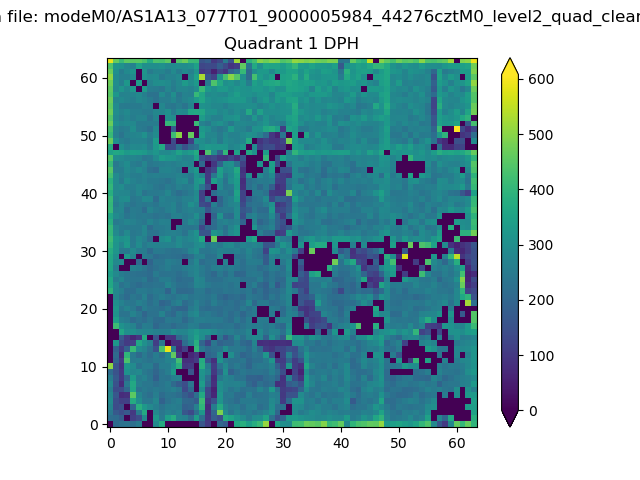 |
Quadrant B |
|---|---|---|---|
| Quadrant D | 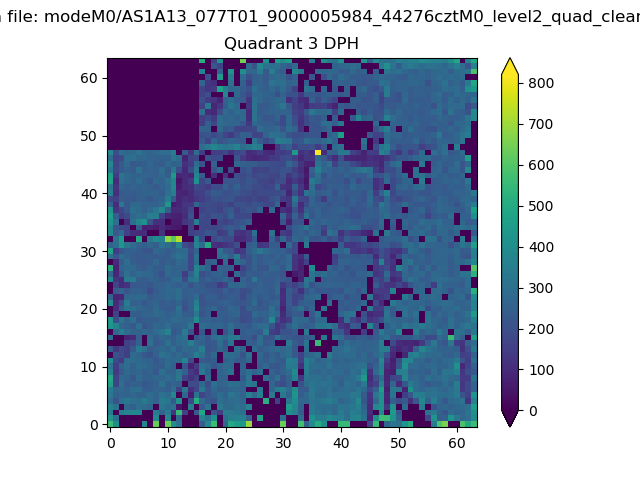 |
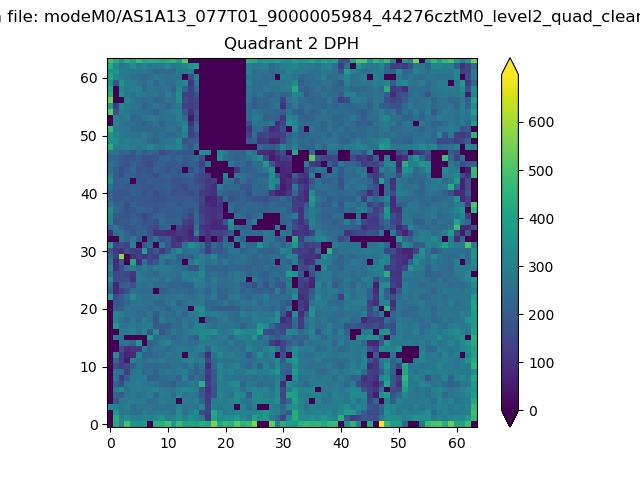 |
Quadrant C |
| Plot type | Count rate plots | Images |
|---|---|---|
| Comparison with Poisson distribution Blue bars denote a histogram of data divided into 1 sec bins. Red curve is a Poisson curve with rate = median count rate of data. |
 |
 |
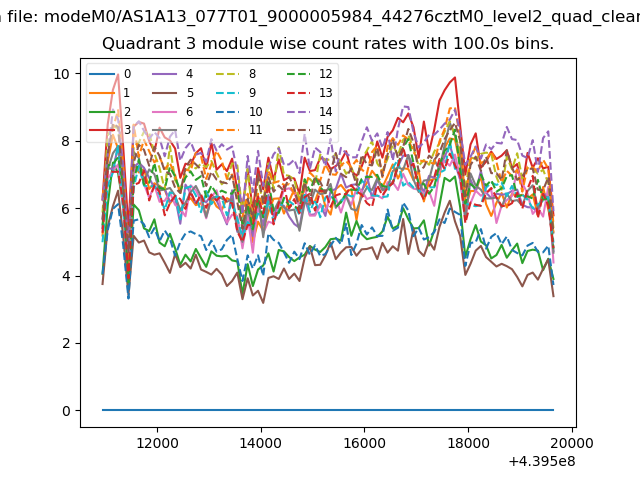
| Quadrant-wise count rates Data is divided into 100 sec bins |
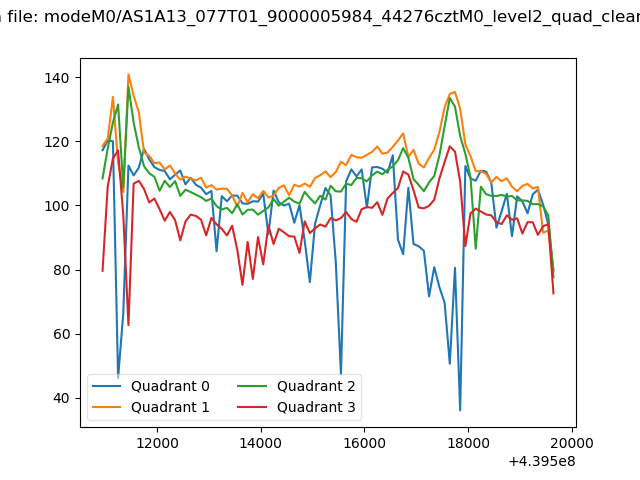 |
|
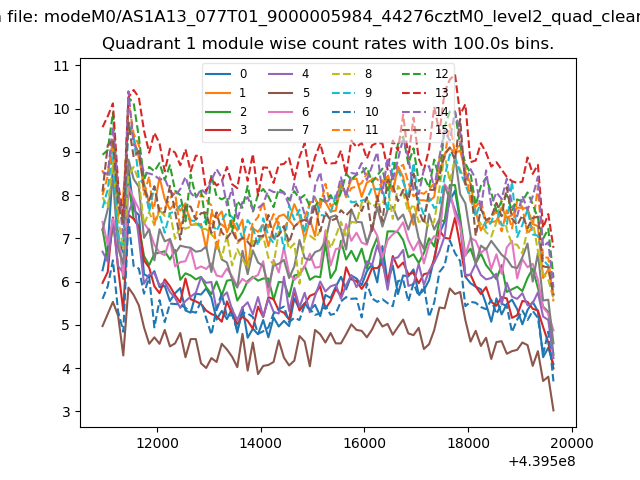
| Module-wise count rates for Quadrant A Data is divided into 100 sec bins |
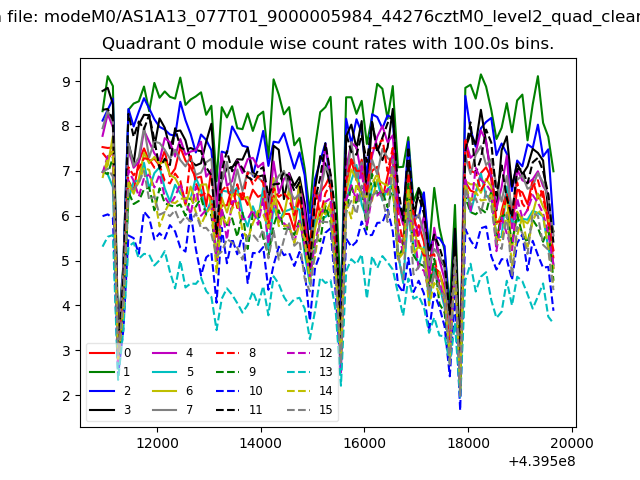 |
 |
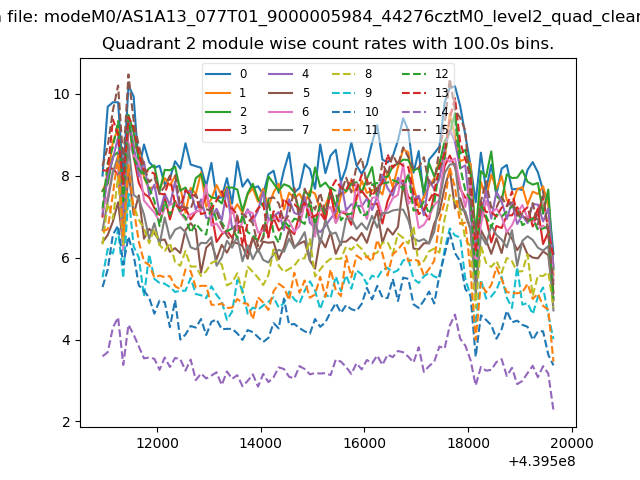
| Module-wise count rates for Quadrant B Data is divided into 100 sec bins |
 |
 |
| Module-wise count rates for Quadrant C Data is divided into 100 sec bins |
 |
 |
| Module-wise count rates for Quadrant D Data is divided into 100 sec bins |
 |
 |
| Parameter | Plot |
|---|---|
| CZT HV Monitor | 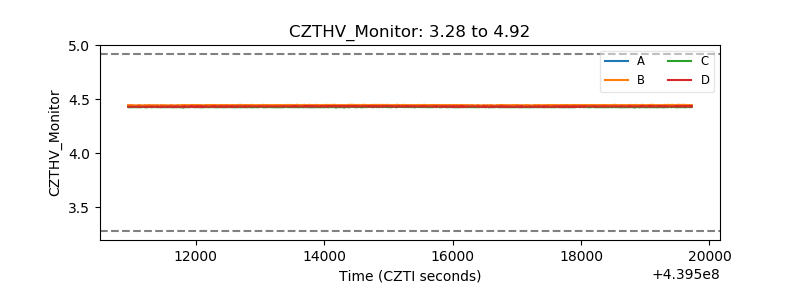 |
| D_VDD | 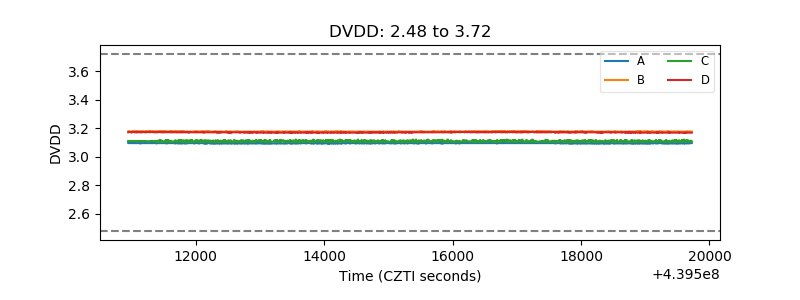 |
| Temperature 1 | 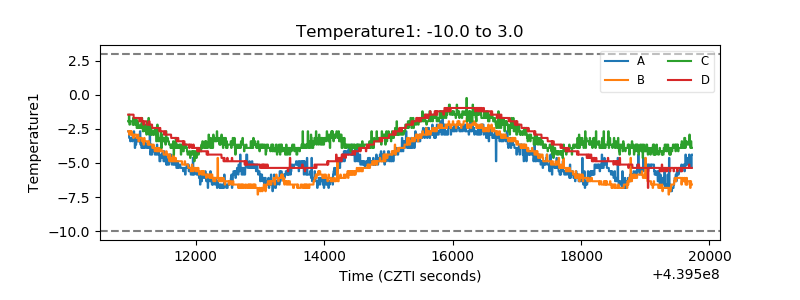 |
| Veto HV Monitor | 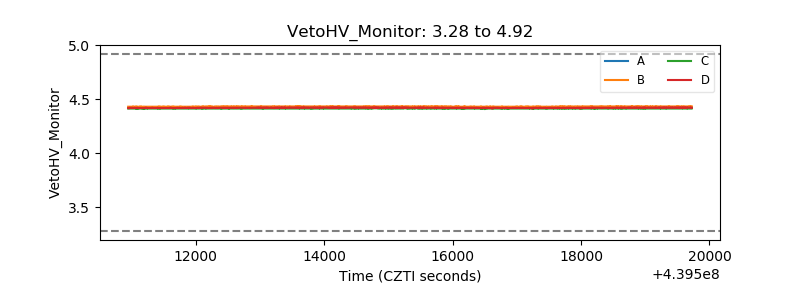 |
| Veto LLD | 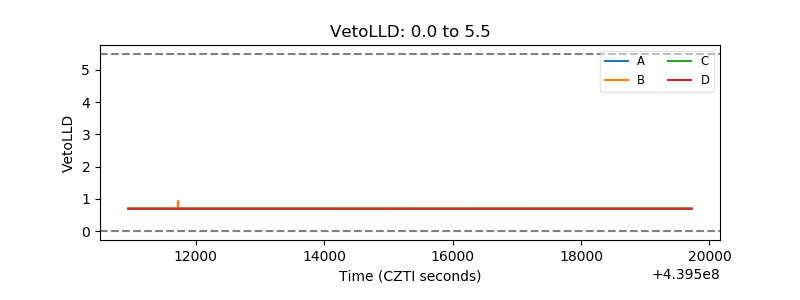 |
| Alpha Counter | 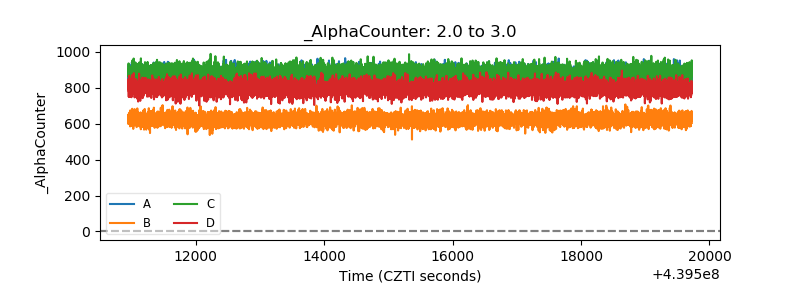 |
| _CPM_Rate | 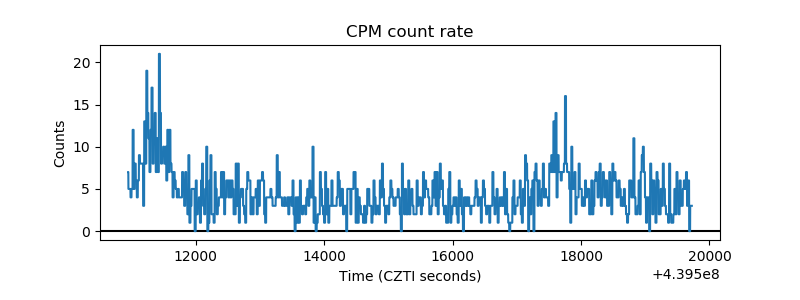 |
| CZT Counter | 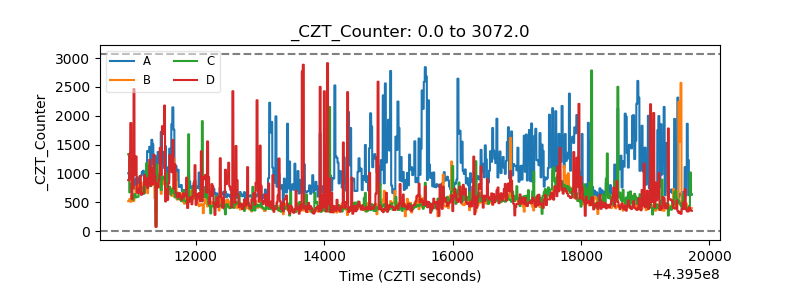 |
| +2.5 Volts monitor | 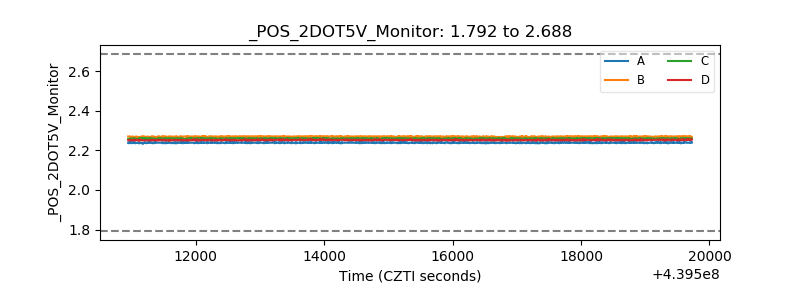 |
| +5 Volts monitor | 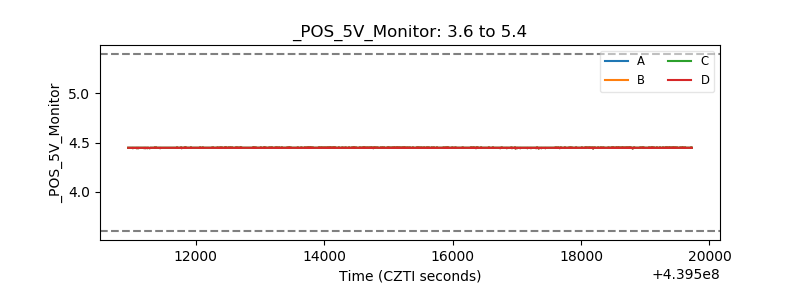 |
| _ROLL_ROT | 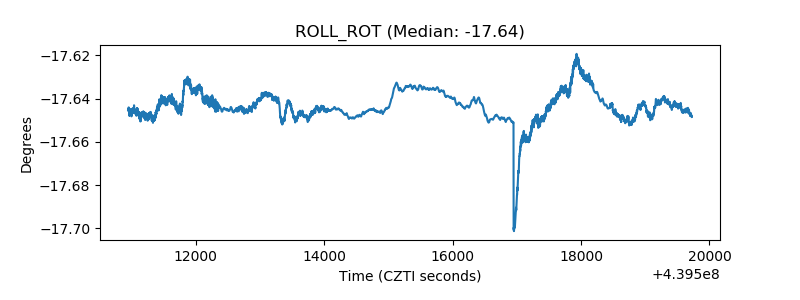 |
| _Roll_DEC | 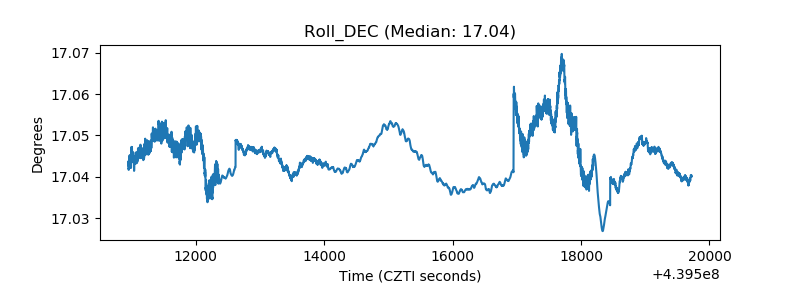 |
| _Roll_RA | 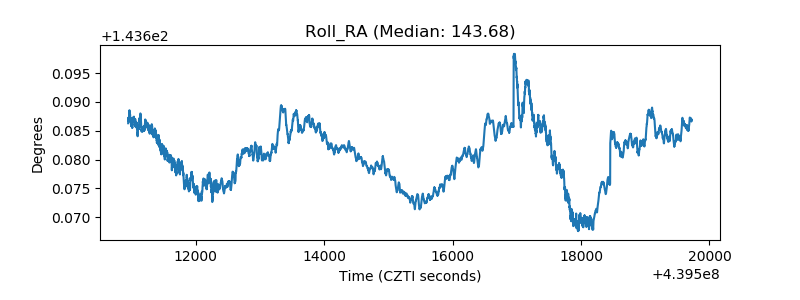 |
| Veto Counter | 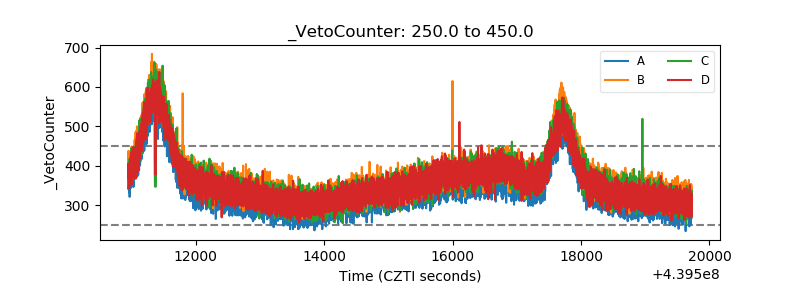 |