| Param | Original file | Final file |
|---|---|---|
| Filename | modeM0/AS1A13_077T01_9000005984_44279cztM0_level2.fits | modeM0/AS1A13_077T01_9000005984_44279cztM0_level2_quad_clean.evt |
| Size (bytes) | 1,377,904,320 | 297,054,720 |
| Size | 1.3 GB | 283.3 MB |
| Events in quadrant A | 15,096,833 | 1,995,512 |
| Events in quadrant B | 9,410,756 | 2,060,186 |
| Events in quadrant C | 11,392,107 | 1,960,081 |
| Events in quadrant D | 13,635,947 | 1,667,757 |
| Mode M0 | |||
|---|---|---|---|
| Quadrant | BADHDUFLAG | Total packets | Discarded packets |
| A | 0 | 59878 | 3 |
| B | 0 | 41009 | 3 |
| C | 0 | 47098 | 3 |
| D | 0 | 54068 | 3 |
| Mode M9 | |||
|---|---|---|---|
| Quadrant | BADHDUFLAG | Total packets | Discarded packets |
| A | 0 | 9 | 0 |
| B | 0 | 9 | 0 |
| C | 0 | 9 | 0 |
| D | 0 | 9 | 0 |
| Mode SS | |||
|---|---|---|---|
| Quadrant | BADHDUFLAG | Total packets | Discarded packets |
| A | 0 | 382 | 0 |
| B | 0 | 382 | 0 |
| C | 0 | 382 | 0 |
| D | 0 | 382 | 0 |
| Quadrant | Total seconds | Saturated seconds | Saturation percentage |
|---|---|---|---|
| A | 19019 | 713 | 3.748883% |
| B | 19020 | 335 | 1.761304% |
| C | 19020 | 335 | 1.761304% |
| D | 19020 | 1502 | 7.896951% |
Noise dominated data is calculated using 1-second bins in cleaned event files. If a bin has >2000 counts, and if more than 50% of those come from <1% of pixels, then it is considered to be noise-dominated and hence unusable.
| Quadrant | # 1 sec bins | Bins with >0 counts | Bins with >2000 counts | High rate bins dominated by noise | Noise dominated (total time) | Noise dominated (detector-on time) | Marked lightcurve |
|---|---|---|---|---|---|---|---|
| A | 19834 | 19022 | 318 | 318 | 1.60% | 1.67% | 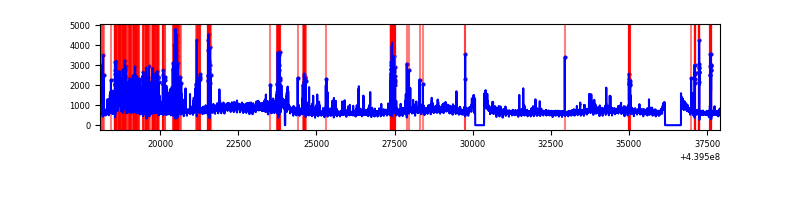 |
| B | 19835 | 19023 | 40 | 40 | 0.20% | 0.21% | 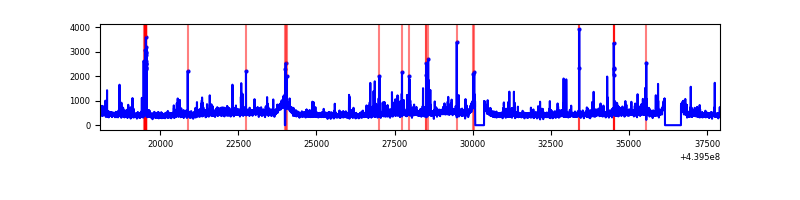 |
| C | 19835 | 19023 | 129 | 129 | 0.65% | 0.68% | 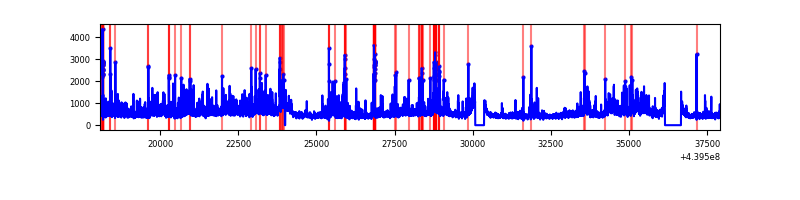 |
| D | 19835 | 19023 | 1101 | 1101 | 5.55% | 5.79% | 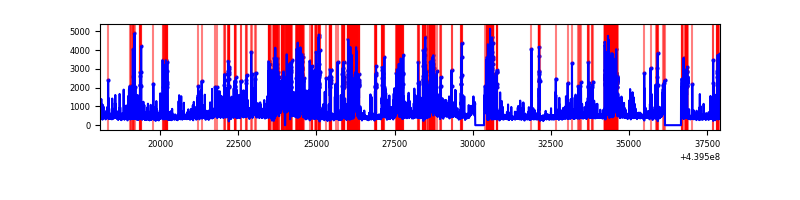 |
Top three noisy pixels from each quadrant. If the there are fewer than three noisy pixels in the level2.evt file, extra rows are filled as -1
| Pixel properties | Quadrant properties | ||||||
|---|---|---|---|---|---|---|---|
| Quadrant | DetID | PixID | Counts | Sigma | Mean | Median | Sigma |
| A | 10 | 83 | 3927532 | 8831.11 | 2150 | 2106 | 444.5 |
| A | 15 | 223 | 2503989 | 5628.54 | 2150 | 2106 | 444.5 |
| A | 13 | 248 | 193193 | 429.89 | 2150 | 2106 | 444.5 |
| B | 0 | 190 | 275670 | 644.96 | 2153 | 2082 | 424.2 |
| B | 0 | 219 | 223631 | 522.28 | 2153 | 2082 | 424.2 |
| B | 0 | 200 | 110944 | 256.63 | 2153 | 2082 | 424.2 |
| C | 3 | 233 | 2226241 | 4476.36 | 2101 | 2108 | 496.9 |
| C | 14 | 254 | 667516 | 1339.22 | 2101 | 2108 | 496.9 |
| C | 15 | 208 | 186545 | 371.2 | 2101 | 2108 | 496.9 |
| D | 1 | 52 | 1586319 | 2983.14 | 2053 | 1985 | 531.1 |
| D | 1 | 20 | 1106969 | 2080.57 | 2053 | 1985 | 531.1 |
| D | 2 | 249 | 970831 | 1824.24 | 2053 | 1985 | 531.1 |
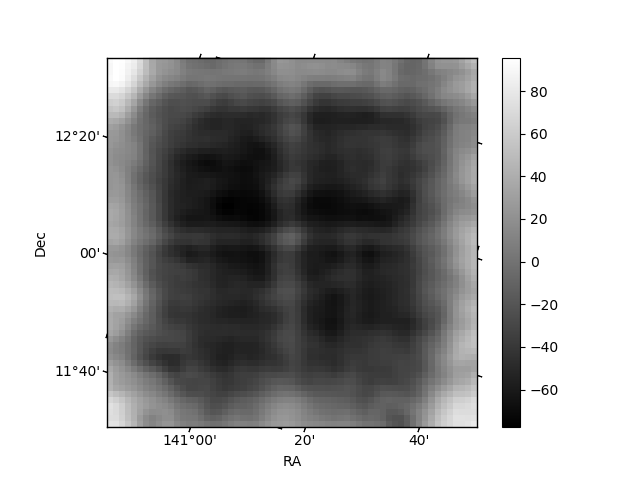
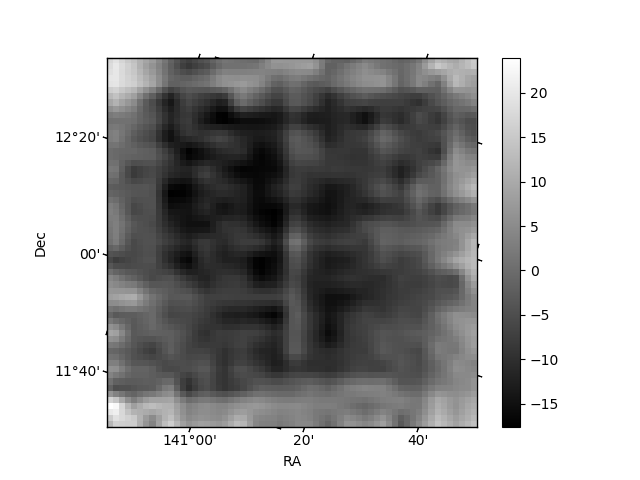
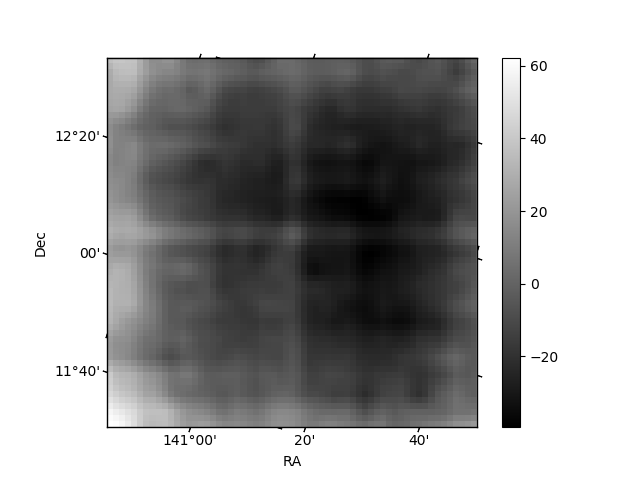
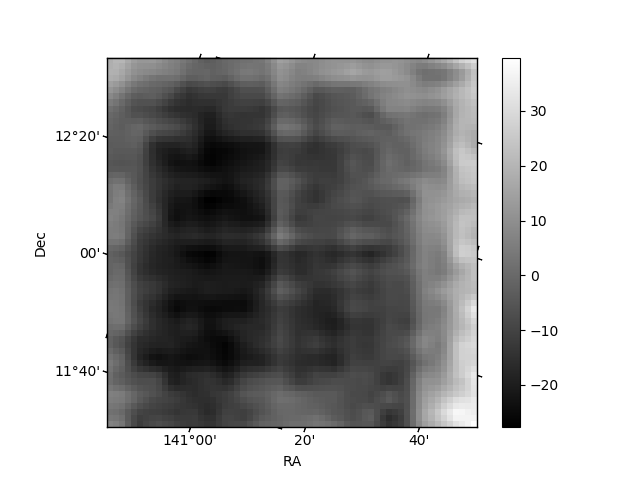
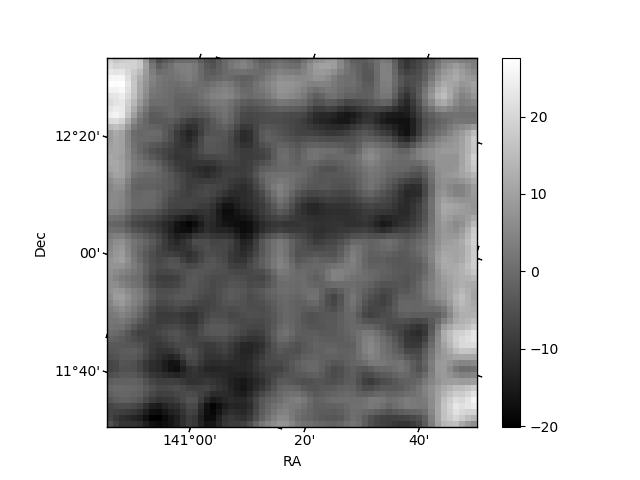
Histogram calculated using DETX and DETY for each event in the final _common_clean file
| Quadrant A | 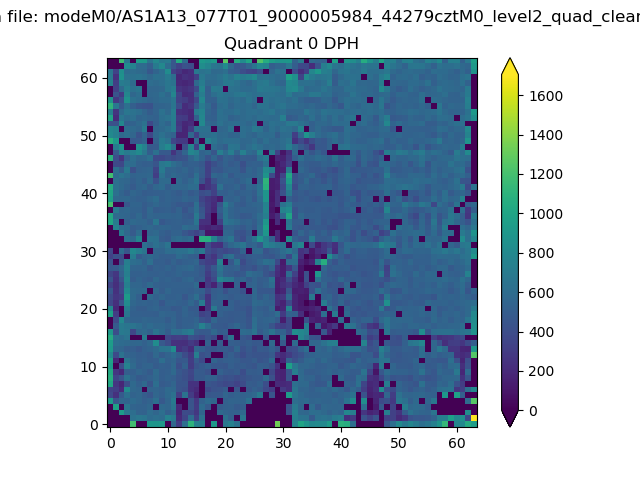 |
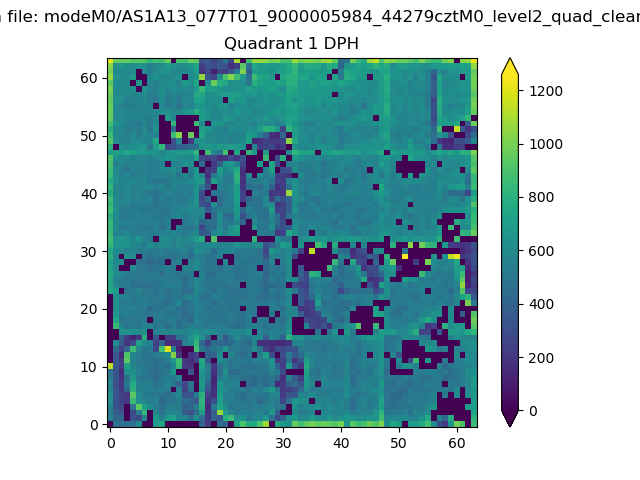 |
Quadrant B |
|---|---|---|---|
| Quadrant D | 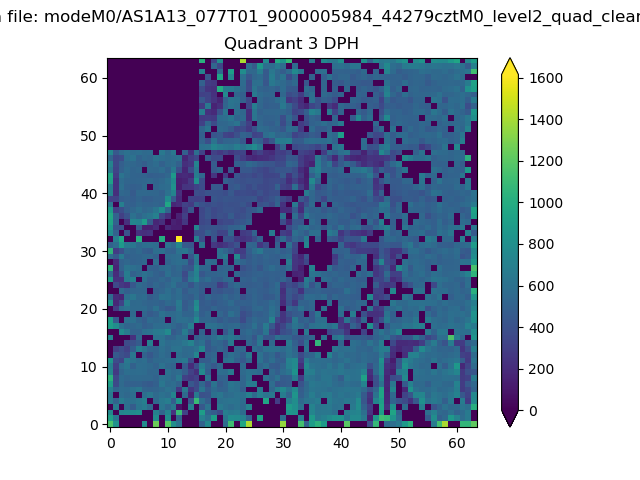 |
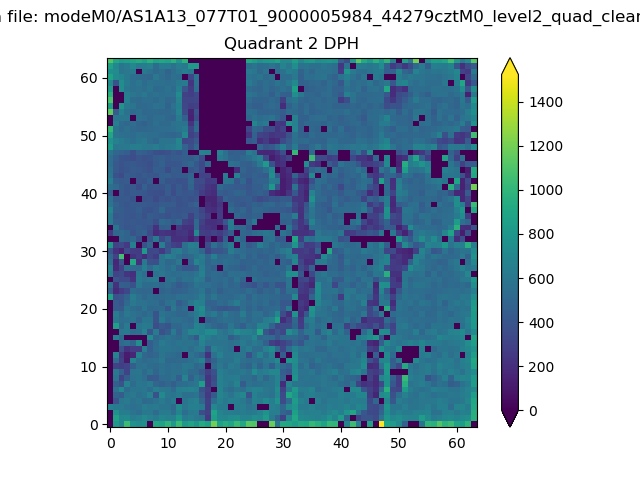 |
Quadrant C |
| Plot type | Count rate plots | Images |
|---|---|---|
| Comparison with Poisson distribution Blue bars denote a histogram of data divided into 1 sec bins. Red curve is a Poisson curve with rate = median count rate of data. |
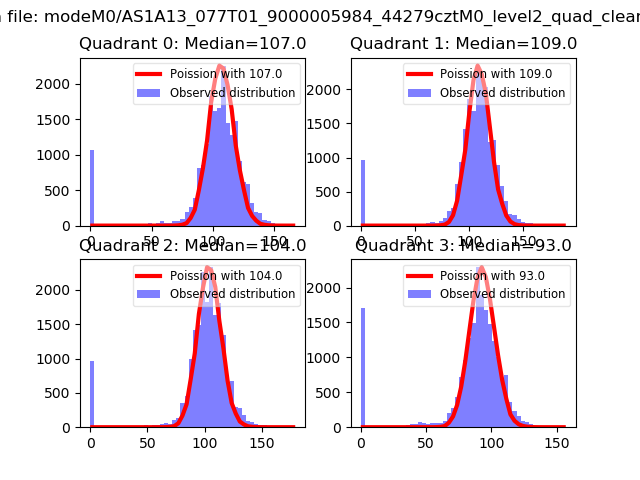 |
 |
| Quadrant-wise count rates Data is divided into 100 sec bins |
 |
|
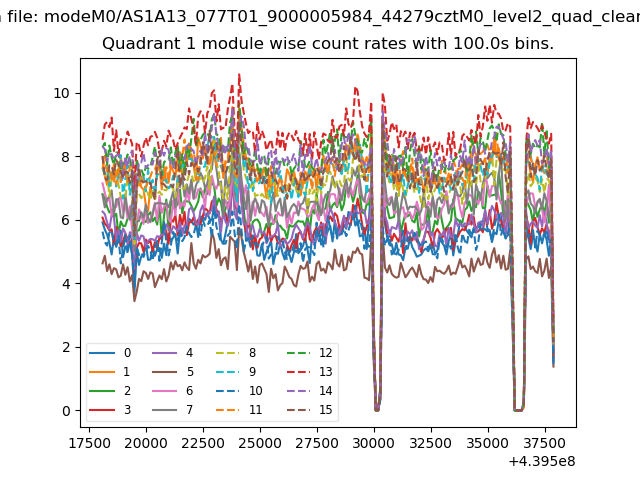
| Module-wise count rates for Quadrant A Data is divided into 100 sec bins |
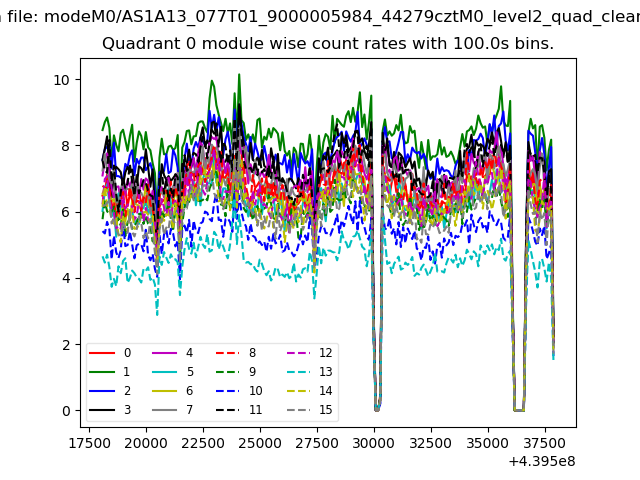 |
 |
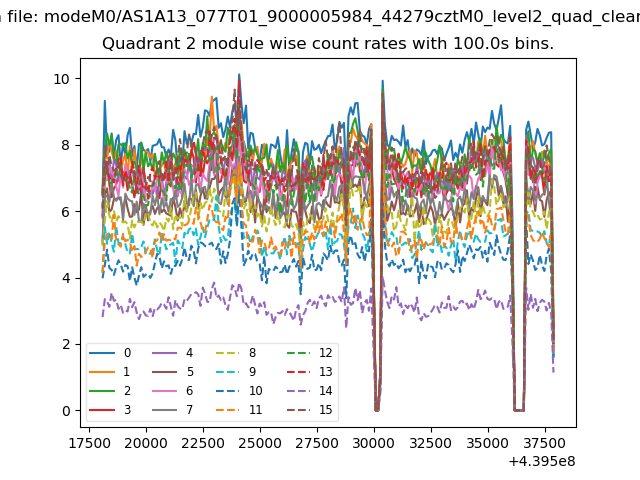
| Module-wise count rates for Quadrant B Data is divided into 100 sec bins |
 |
 |
| Module-wise count rates for Quadrant C Data is divided into 100 sec bins |
 |
 |
| Module-wise count rates for Quadrant D Data is divided into 100 sec bins |
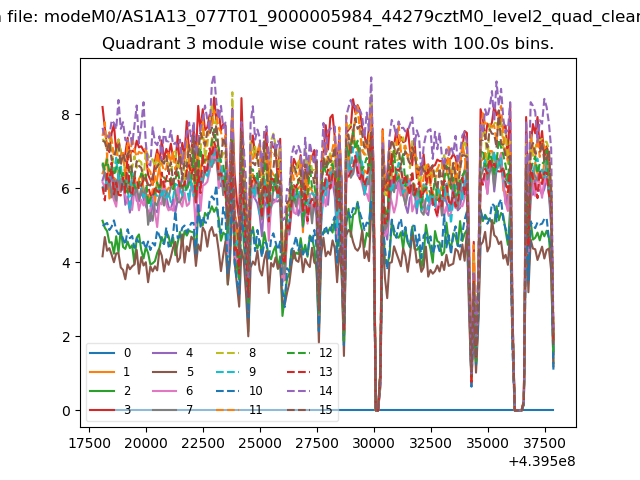 |
 |
| Parameter | Plot |
|---|---|
| CZT HV Monitor | 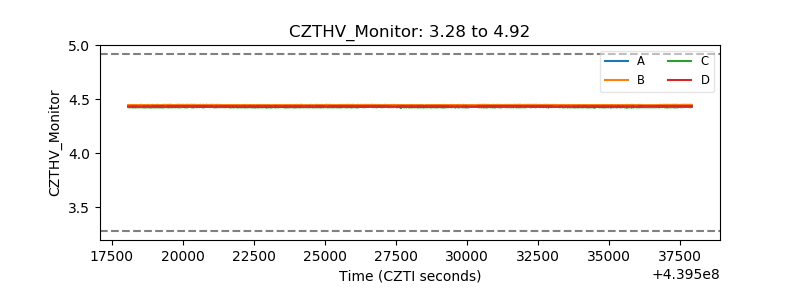 |
| D_VDD | 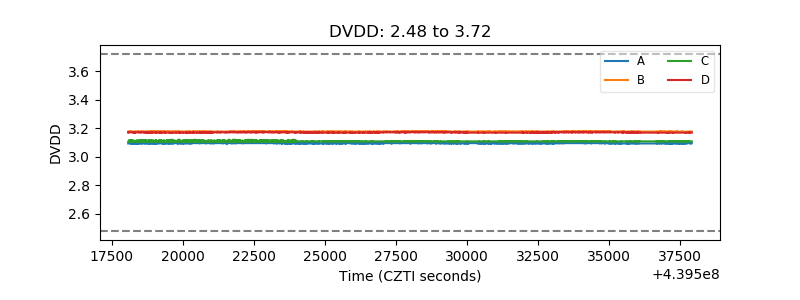 |
| Temperature 1 | 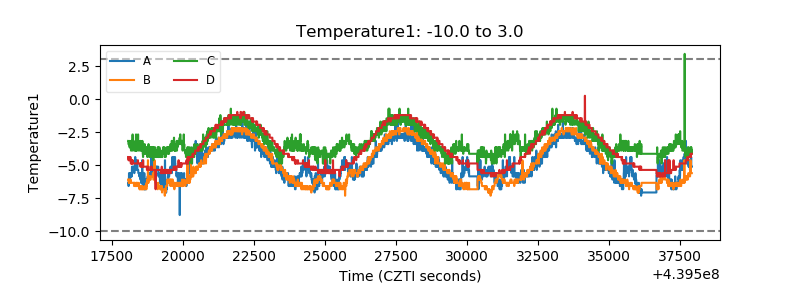 |
| Veto HV Monitor |  |
| Veto LLD | 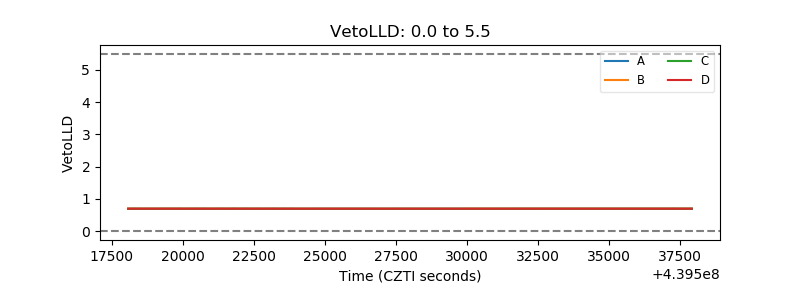 |
| Alpha Counter | 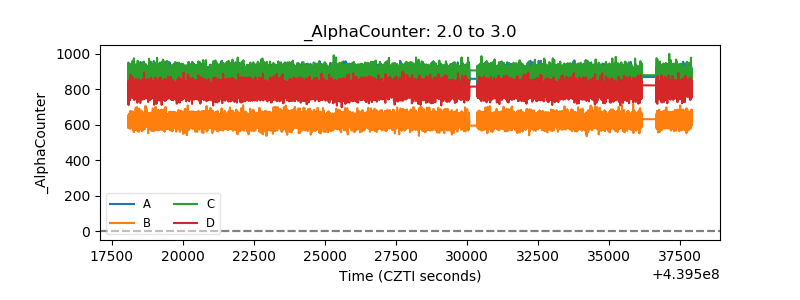 |
| _CPM_Rate | 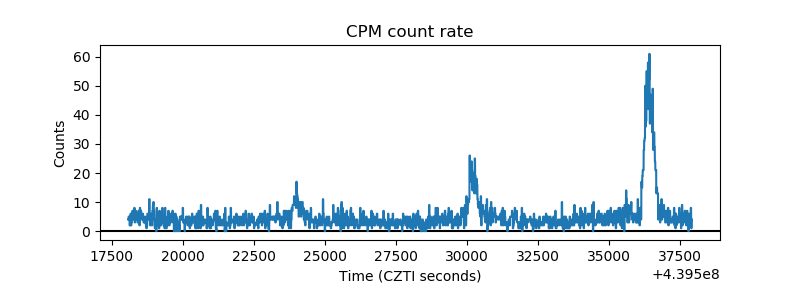 |
| CZT Counter | 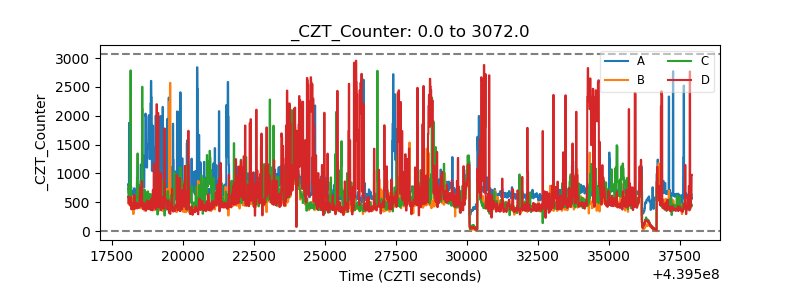 |
| +2.5 Volts monitor | 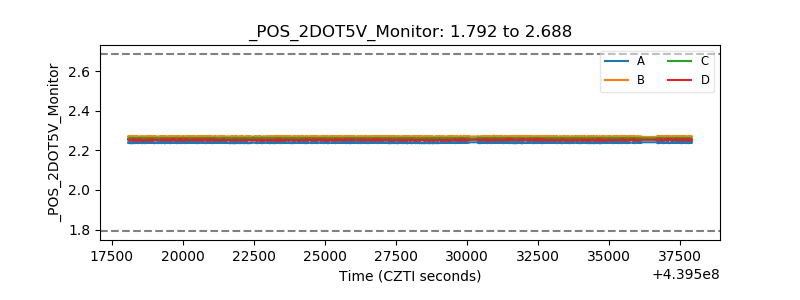 |
| +5 Volts monitor | 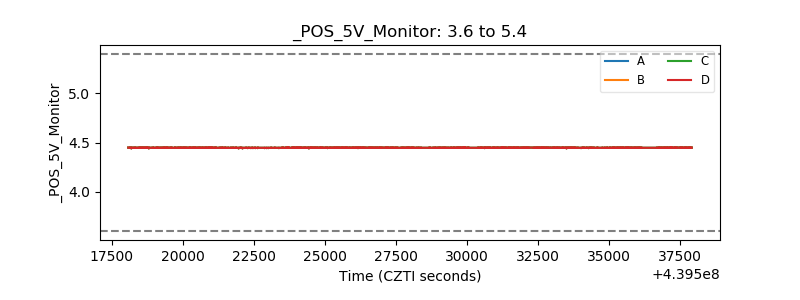 |
| _ROLL_ROT | 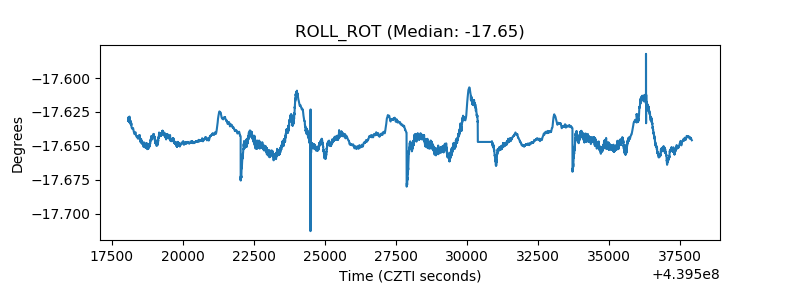 |
| _Roll_DEC | 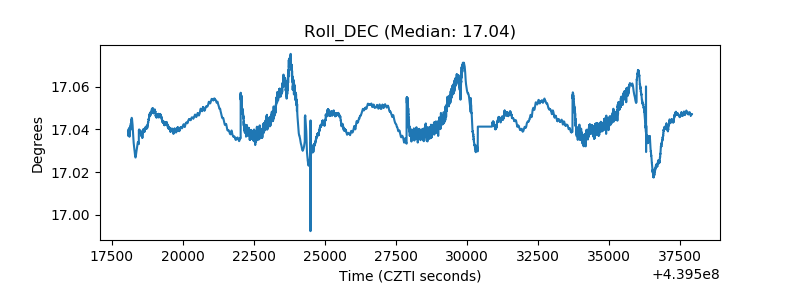 |
| _Roll_RA | 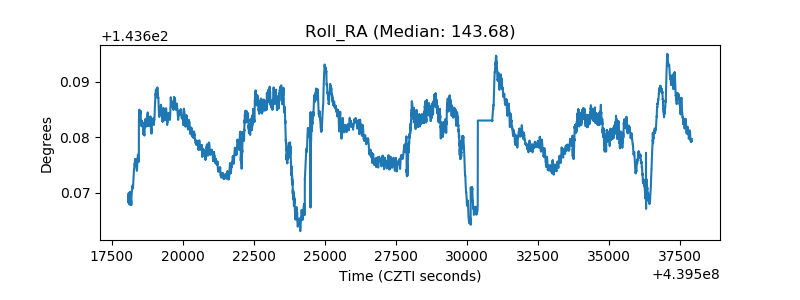 |
| Veto Counter | 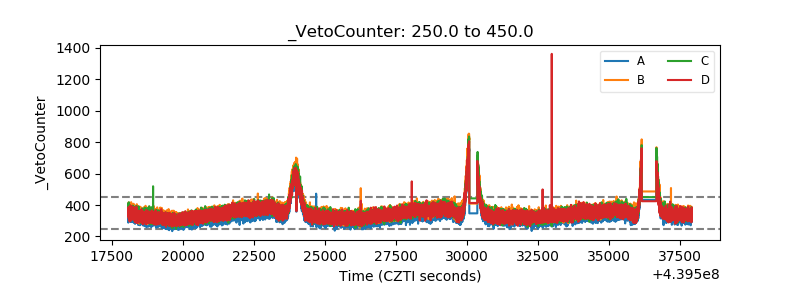 |