| Param | Original file | Final file |
|---|---|---|
| Filename | modeM0/AS1A13_077T01_9000005984_44281cztM0_level2.fits | modeM0/AS1A13_077T01_9000005984_44281cztM0_level2_quad_clean.evt |
| Size (bytes) | 477,483,840 | 99,492,480 |
| Size | 455.4 MB | 94.9 MB |
| Events in quadrant A | 4,907,123 | 660,307 |
| Events in quadrant B | 3,020,945 | 693,803 |
| Events in quadrant C | 3,325,554 | 654,733 |
| Events in quadrant D | 5,937,291 | 568,494 |
| Mode M0 | |||
|---|---|---|---|
| Quadrant | BADHDUFLAG | Total packets | Discarded packets |
| A | 0 | 20020 | 1 |
| B | 0 | 13134 | 1 |
| C | 0 | 13962 | 2 |
| D | 0 | 21985 | 1 |
| Mode M9 | |||
|---|---|---|---|
| Quadrant | BADHDUFLAG | Total packets | Discarded packets |
| A | 0 | 9 | 0 |
| B | 0 | 9 | 0 |
| C | 0 | 9 | 0 |
| D | 0 | 9 | 0 |
| Mode SS | |||
|---|---|---|---|
| Quadrant | BADHDUFLAG | Total packets | Discarded packets |
| A | 0 | 126 | 0 |
| B | 0 | 126 | 0 |
| C | 0 | 126 | 0 |
| D | 0 | 126 | 0 |
| Quadrant | Total seconds | Saturated seconds | Saturation percentage |
|---|---|---|---|
| A | 6235 | 263 | 4.218123% |
| B | 6236 | 104 | 1.667736% |
| C | 6235 | 115 | 1.844427% |
| D | 6235 | 560 | 8.981556% |
Noise dominated data is calculated using 1-second bins in cleaned event files. If a bin has >2000 counts, and if more than 50% of those come from <1% of pixels, then it is considered to be noise-dominated and hence unusable.
| Quadrant | # 1 sec bins | Bins with >0 counts | Bins with >2000 counts | High rate bins dominated by noise | Noise dominated (total time) | Noise dominated (detector-on time) | Marked lightcurve |
|---|---|---|---|---|---|---|---|
| A | 7115 | 6235 | 93 | 93 | 1.31% | 1.49% | 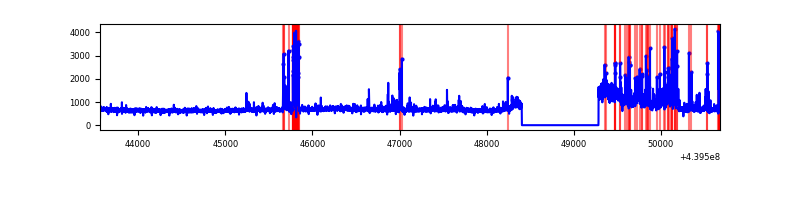 |
| B | 7116 | 6237 | 11 | 11 | 0.15% | 0.18% | 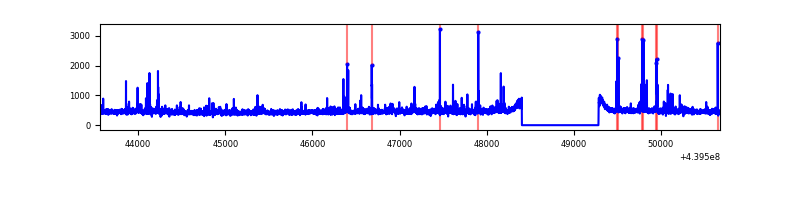 |
| C | 7115 | 6235 | 26 | 26 | 0.37% | 0.42% | 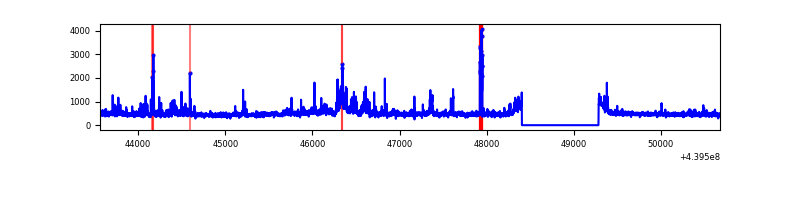 |
| D | 7115 | 6235 | 397 | 397 | 5.58% | 6.37% | 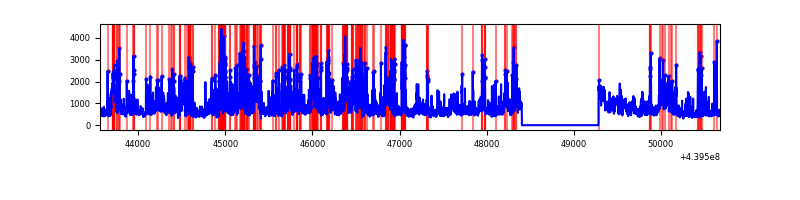 |
Top three noisy pixels from each quadrant. If the there are fewer than three noisy pixels in the level2.evt file, extra rows are filled as -1
| Pixel properties | Quadrant properties | ||||||
|---|---|---|---|---|---|---|---|
| Quadrant | DetID | PixID | Counts | Sigma | Mean | Median | Sigma |
| A | 10 | 83 | 1366504 | 9373.55 | 706 | 688 | 145.7 |
| A | 15 | 223 | 744543 | 5105.05 | 706 | 688 | 145.7 |
| A | 13 | 248 | 23241 | 154.78 | 706 | 688 | 145.7 |
| B | 0 | 219 | 98911 | 699.98 | 706 | 684 | 140.3 |
| B | 5 | 255 | 32928 | 229.77 | 706 | 684 | 140.3 |
| B | 0 | 190 | 30844 | 214.92 | 706 | 684 | 140.3 |
| C | 3 | 233 | 423446 | 2579.48 | 696 | 700 | 163.9 |
| C | 1 | 3 | 111040 | 673.26 | 696 | 700 | 163.9 |
| C | 14 | 254 | 76351 | 461.6 | 696 | 700 | 163.9 |
| D | 1 | 52 | 2340327 | 13581.82 | 680 | 658 | 172.3 |
| D | 5 | 235 | 292521 | 1694.27 | 680 | 658 | 172.3 |
| D | 13 | 249 | 257259 | 1489.57 | 680 | 658 | 172.3 |
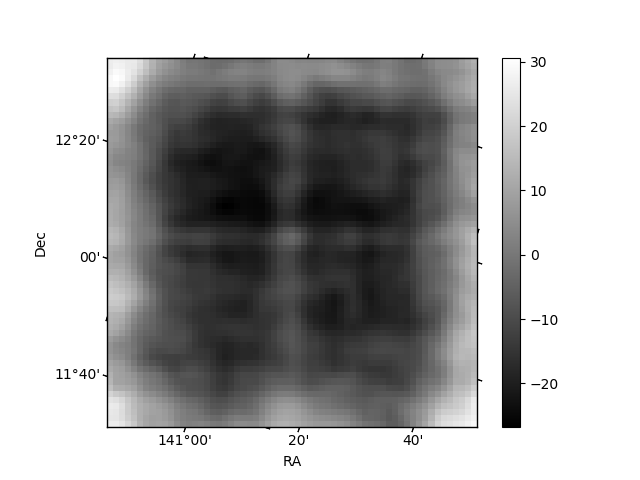
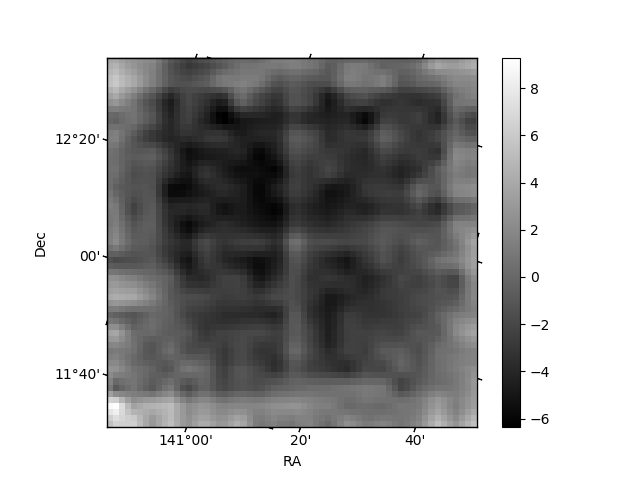
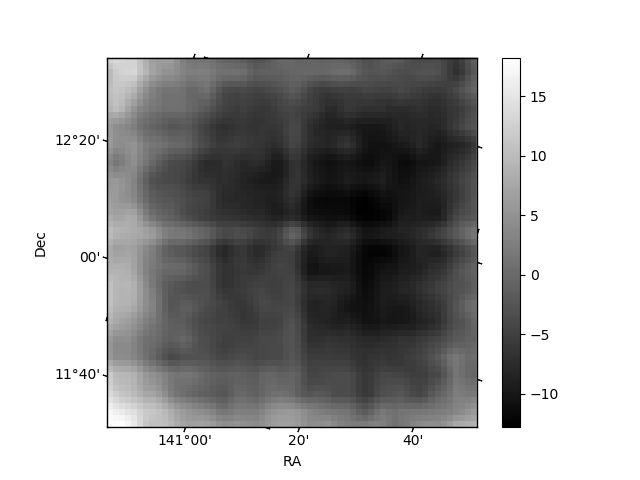
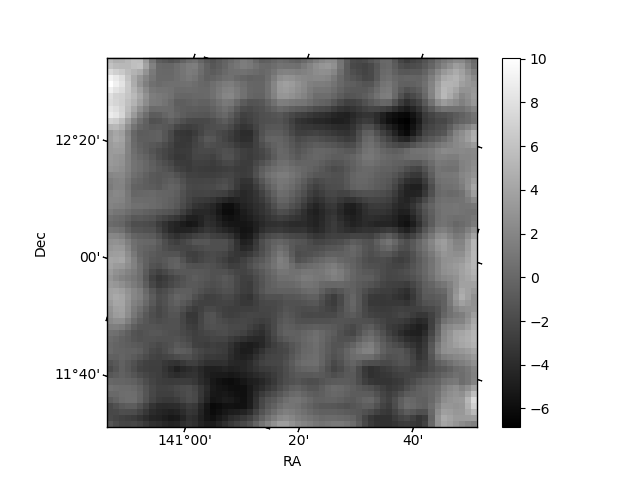
Histogram calculated using DETX and DETY for each event in the final _common_clean file
| Quadrant A | 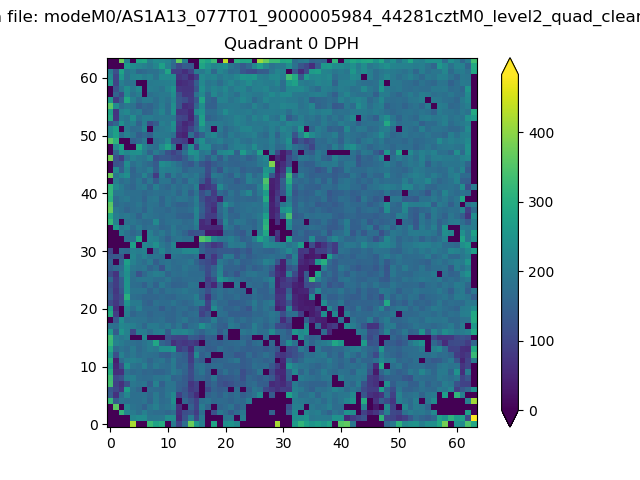 |
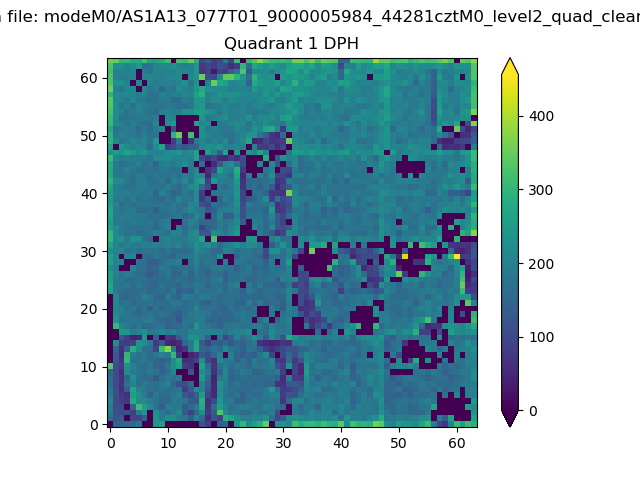 |
Quadrant B |
|---|---|---|---|
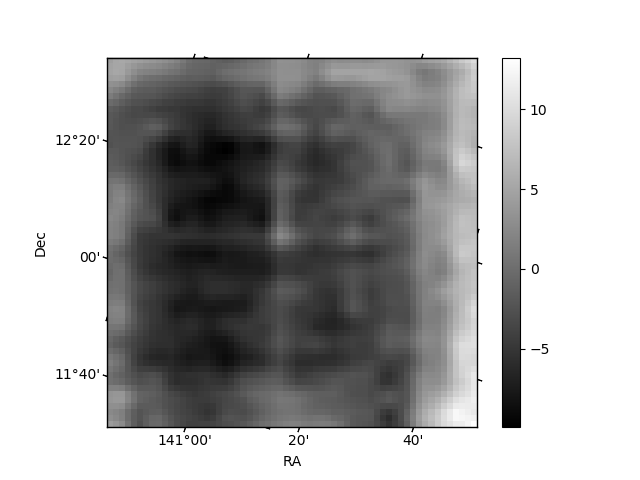
| Quadrant D | 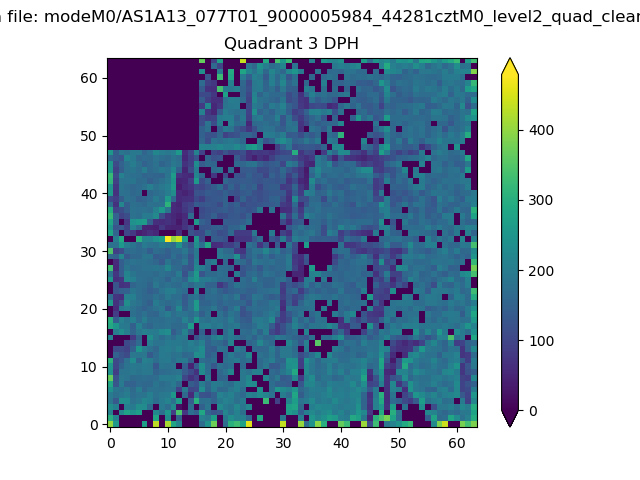 |
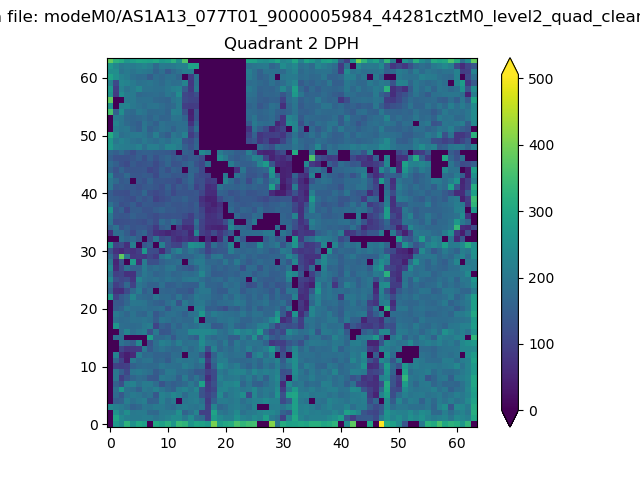 |
Quadrant C |
| Plot type | Count rate plots | Images |
|---|---|---|
| Comparison with Poisson distribution Blue bars denote a histogram of data divided into 1 sec bins. Red curve is a Poisson curve with rate = median count rate of data. |
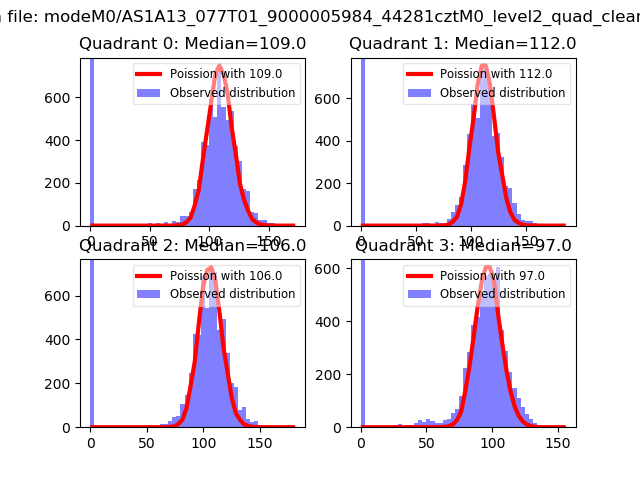 |
 |
| Quadrant-wise count rates Data is divided into 100 sec bins |
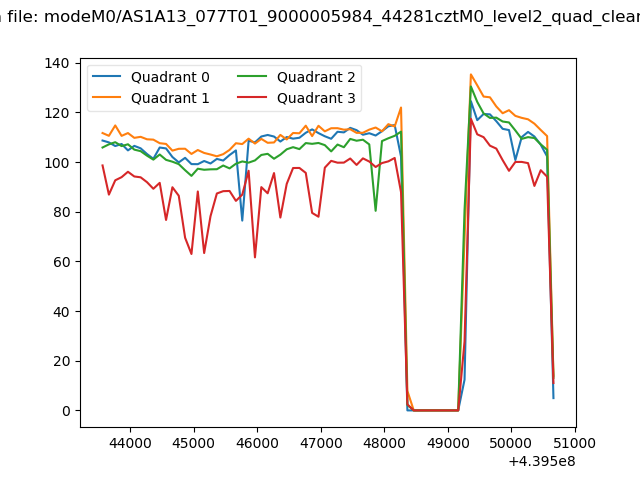 |
|
| Module-wise count rates for Quadrant A Data is divided into 100 sec bins |
 |
 |
| Module-wise count rates for Quadrant B Data is divided into 100 sec bins |
 |
 |
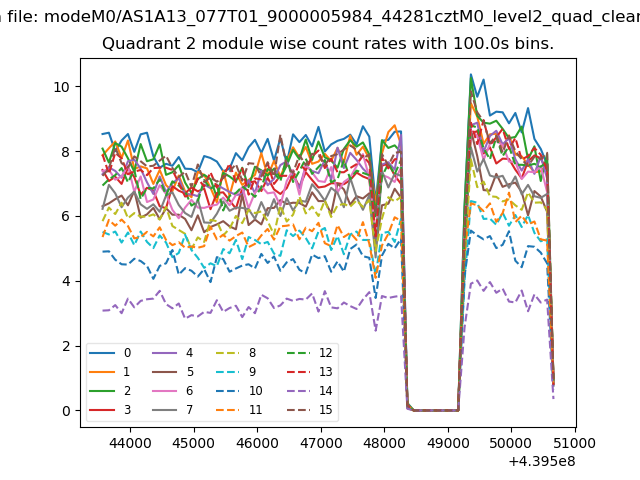
| Module-wise count rates for Quadrant C Data is divided into 100 sec bins |
 |
 |
| Module-wise count rates for Quadrant D Data is divided into 100 sec bins |
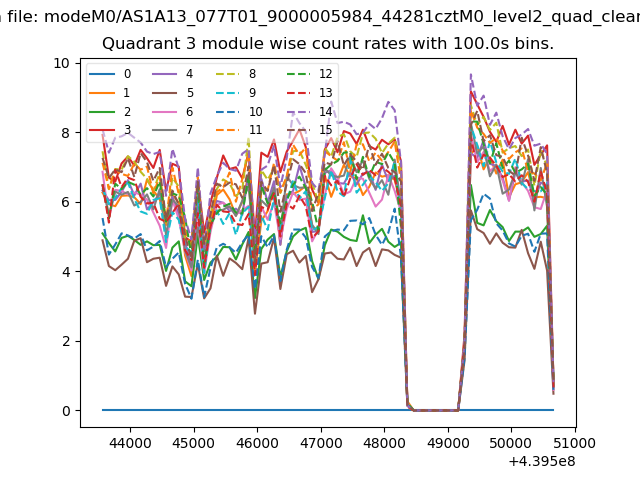 |
 |
| Parameter | Plot |
|---|---|
| CZT HV Monitor | 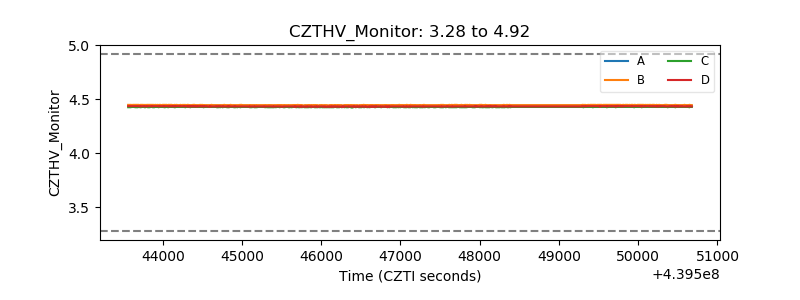 |
| D_VDD | 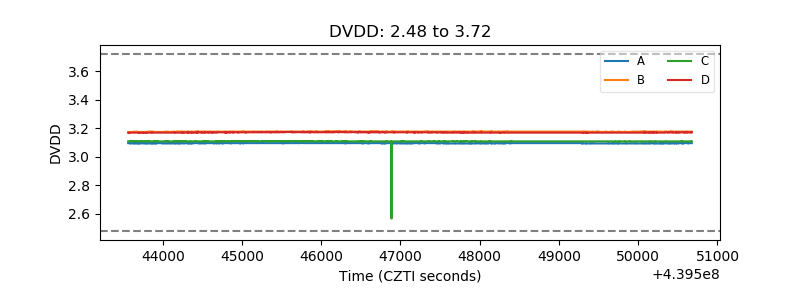 |
| Temperature 1 | 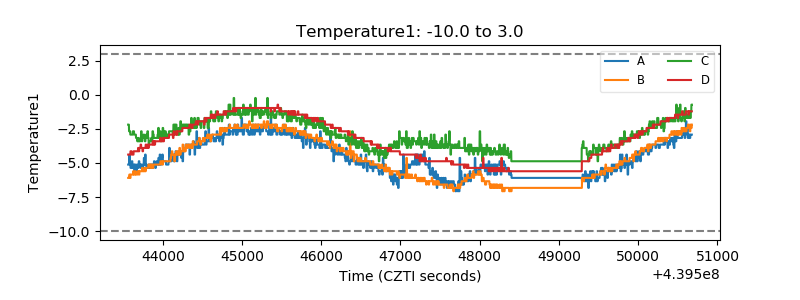 |
| Veto HV Monitor | 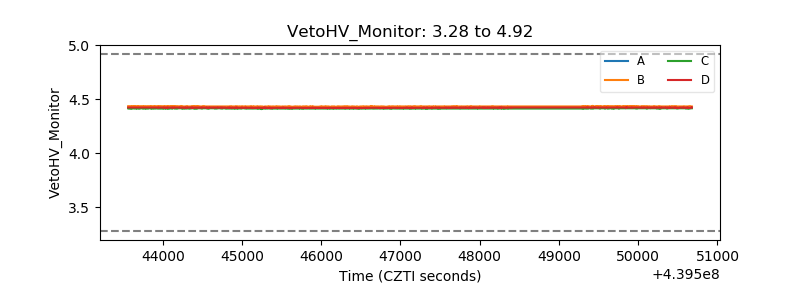 |
| Veto LLD | 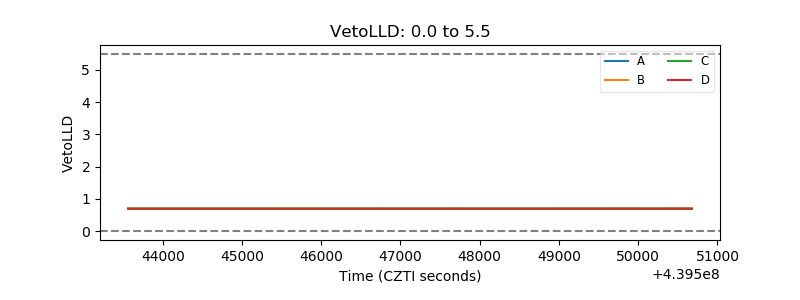 |
| Alpha Counter | 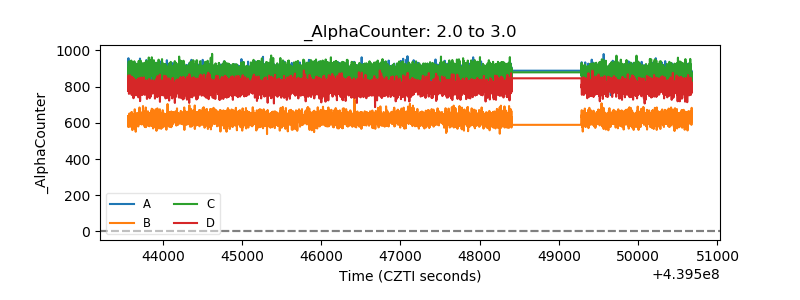 |
| _CPM_Rate | 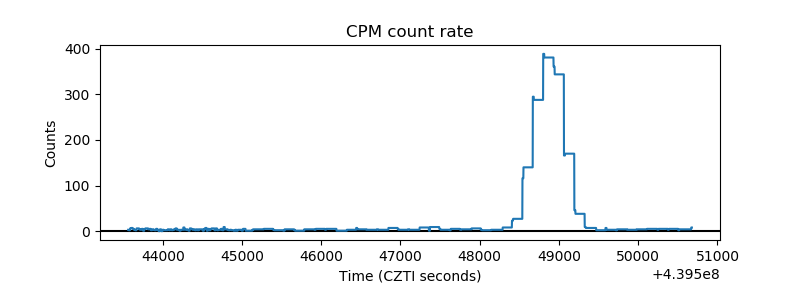 |
| CZT Counter | 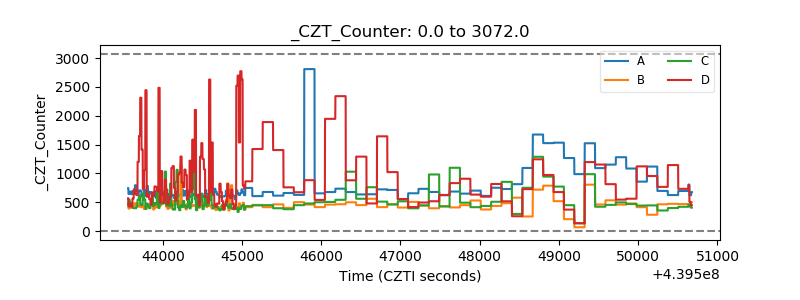 |
| +2.5 Volts monitor | 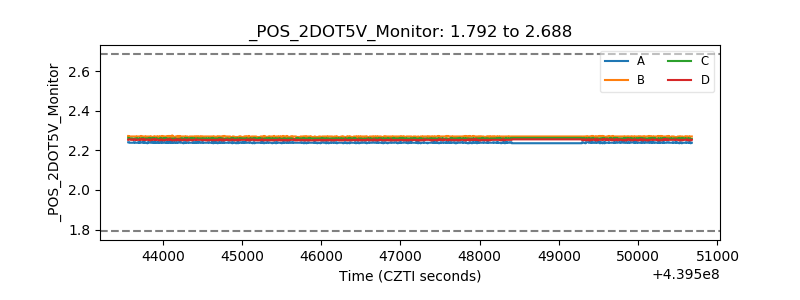 |
| +5 Volts monitor | 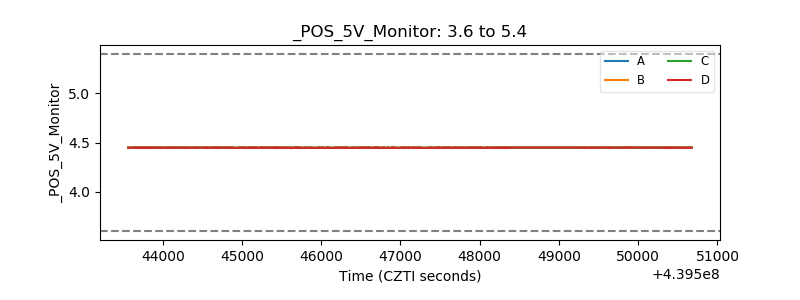 |
| _ROLL_ROT | 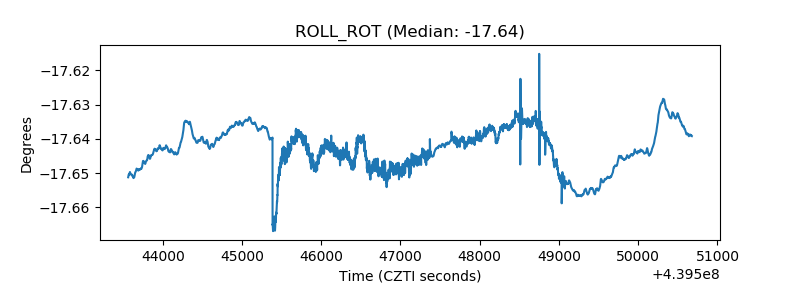 |
| _Roll_DEC | 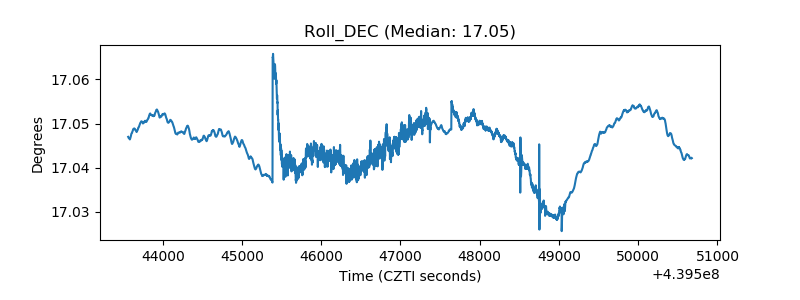 |
| _Roll_RA | 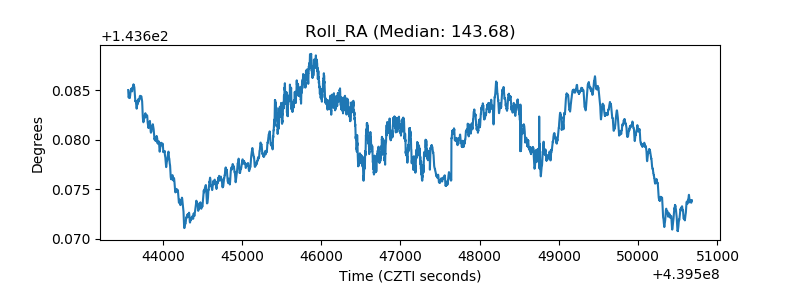 |
| Veto Counter |  |