| Param | Original file | Final file |
|---|---|---|
| Filename | modeM0/AS1A13_077T01_9000005984_44284cztM0_level2.fits | modeM0/AS1A13_077T01_9000005984_44284cztM0_level2_quad_clean.evt |
| Size (bytes) | 511,119,360 | 116,858,880 |
| Size | 487.4 MB | 111.4 MB |
| Events in quadrant A | 5,991,241 | 765,108 |
| Events in quadrant B | 3,945,087 | 820,634 |
| Events in quadrant C | 3,450,773 | 783,399 |
| Events in quadrant D | 5,013,605 | 702,882 |
| Mode M0 | |||
|---|---|---|---|
| Quadrant | BADHDUFLAG | Total packets | Discarded packets |
| A | 0 | 23182 | 2 |
| B | 0 | 15981 | 2 |
| C | 0 | 14565 | 2 |
| D | 0 | 19401 | 2 |
| Mode M9 | |||
|---|---|---|---|
| Quadrant | BADHDUFLAG | Total packets | Discarded packets |
| A | 0 | 11 | 0 |
| B | 0 | 11 | 0 |
| C | 0 | 11 | 0 |
| D | 0 | 11 | 0 |
| Mode SS | |||
|---|---|---|---|
| Quadrant | BADHDUFLAG | Total packets | Discarded packets |
| A | 0 | 136 | 0 |
| B | 0 | 136 | 0 |
| C | 0 | 136 | 0 |
| D | 0 | 136 | 0 |
| Quadrant | Total seconds | Saturated seconds | Saturation percentage |
|---|---|---|---|
| A | 6693 | 572 | 8.546242% |
| B | 6694 | 147 | 2.195996% |
| C | 6694 | 71 | 1.060651% |
| D | 6693 | 338 | 5.050052% |
Noise dominated data is calculated using 1-second bins in cleaned event files. If a bin has >2000 counts, and if more than 50% of those come from <1% of pixels, then it is considered to be noise-dominated and hence unusable.
| Quadrant | # 1 sec bins | Bins with >0 counts | Bins with >2000 counts | High rate bins dominated by noise | Noise dominated (total time) | Noise dominated (detector-on time) | Marked lightcurve |
|---|---|---|---|---|---|---|---|
| A | 7853 | 6693 | 342 | 342 | 4.36% | 5.11% | 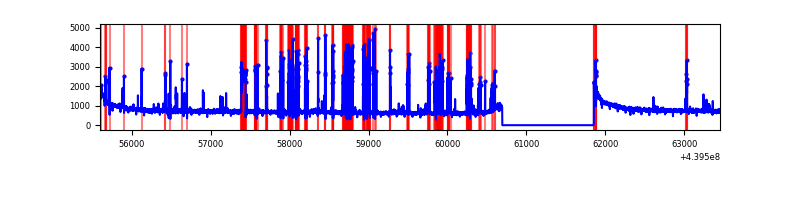 |
| B | 7854 | 6695 | 53 | 53 | 0.67% | 0.79% | 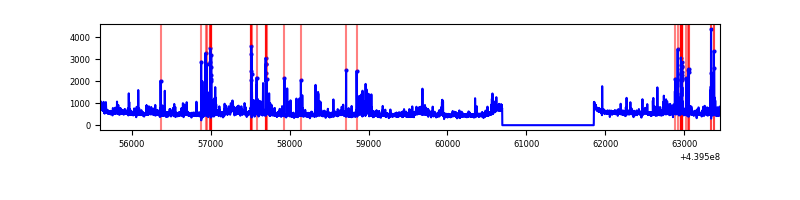 |
| C | 7854 | 6695 | 18 | 18 | 0.23% | 0.27% | 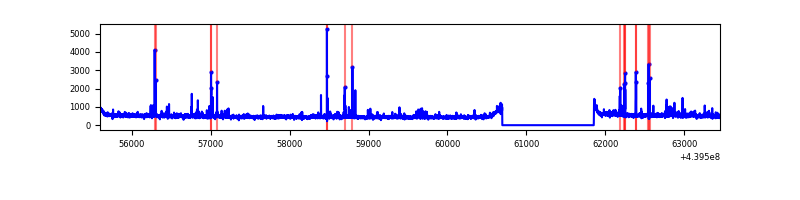 |
| D | 7853 | 6694 | 246 | 246 | 3.13% | 3.67% | 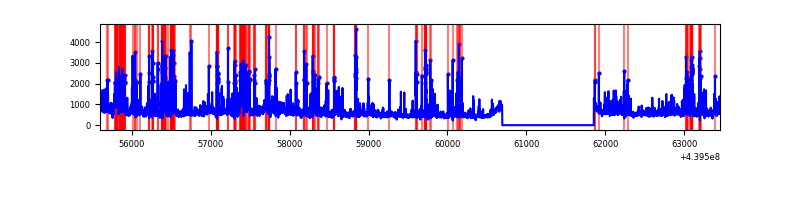 |
Top three noisy pixels from each quadrant. If the there are fewer than three noisy pixels in the level2.evt file, extra rows are filled as -1
| Pixel properties | Quadrant properties | ||||||
|---|---|---|---|---|---|---|---|
| Quadrant | DetID | PixID | Counts | Sigma | Mean | Median | Sigma |
| A | 10 | 83 | 1672700 | 10268.34 | 800 | 787 | 162.8 |
| A | 15 | 223 | 1099410 | 6747.38 | 800 | 787 | 162.8 |
| A | 7 | 3 | 40382 | 243.18 | 800 | 787 | 162.8 |
| B | 0 | 219 | 308378 | 1935.68 | 811 | 788 | 158.9 |
| B | 0 | 155 | 161847 | 1013.55 | 811 | 788 | 158.9 |
| B | 5 | 235 | 68112 | 423.67 | 811 | 788 | 158.9 |
| C | 3 | 233 | 115671 | 606.0 | 805 | 811 | 189.5 |
| C | 14 | 254 | 96403 | 504.34 | 805 | 811 | 189.5 |
| C | 1 | 3 | 51562 | 267.76 | 805 | 811 | 189.5 |
| D | 1 | 52 | 857068 | 4297.82 | 796 | 774 | 199.2 |
| D | 5 | 235 | 234918 | 1175.19 | 796 | 774 | 199.2 |
| D | 1 | 20 | 177675 | 887.88 | 796 | 774 | 199.2 |
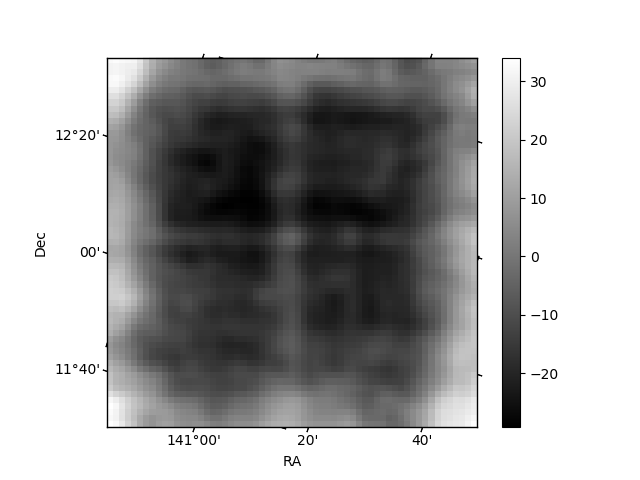
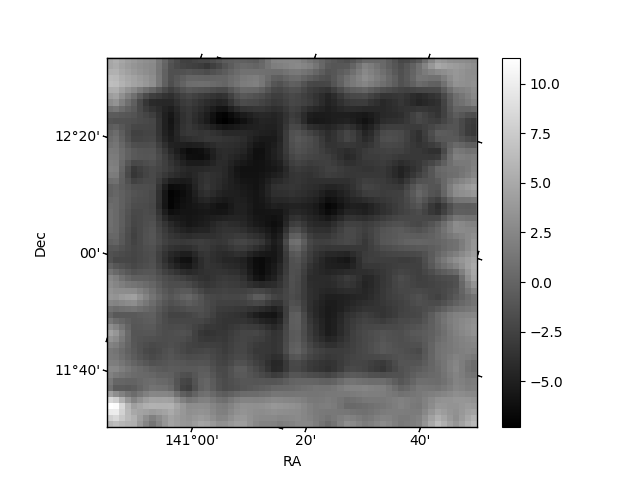
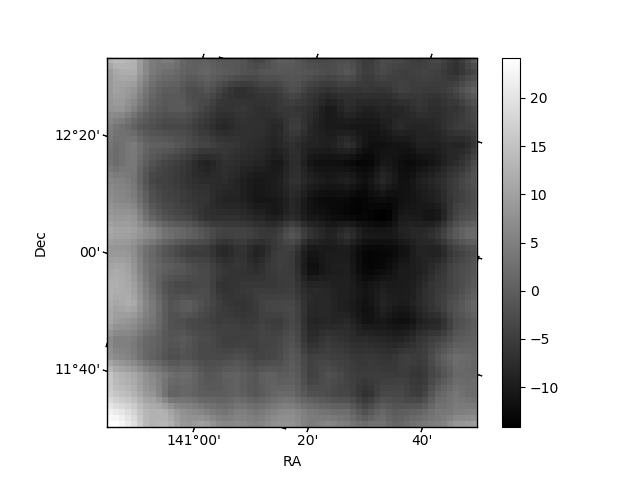
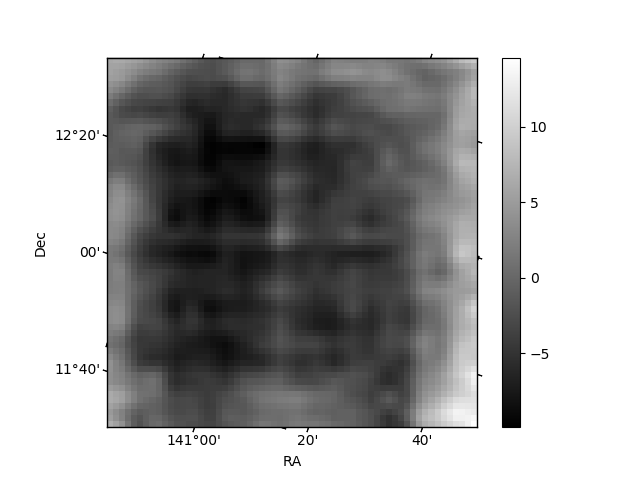
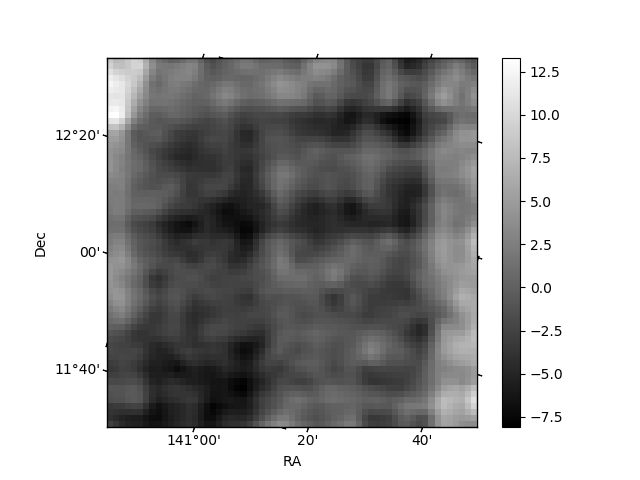
Histogram calculated using DETX and DETY for each event in the final _common_clean file
| Quadrant A | 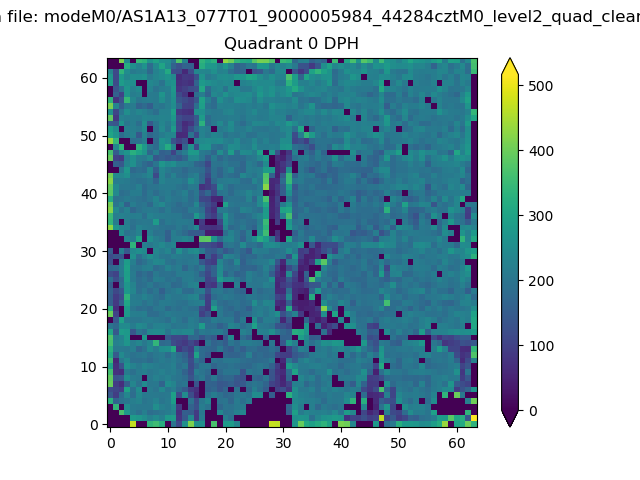 |
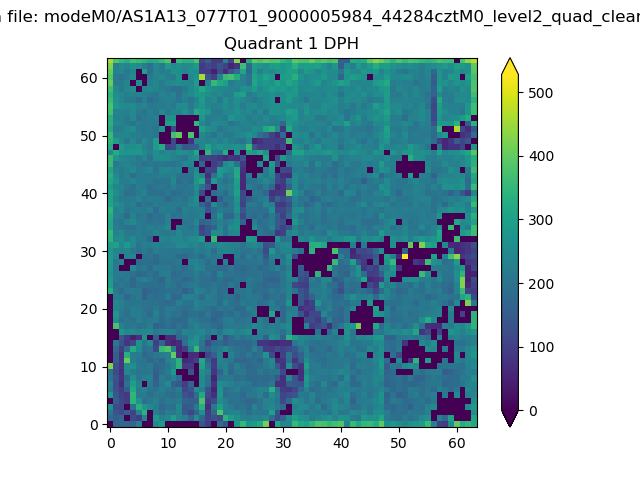 |
Quadrant B |
|---|---|---|---|
| Quadrant D | 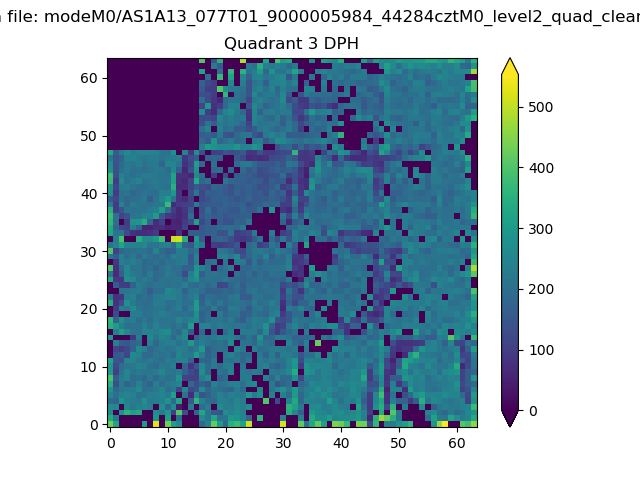 |
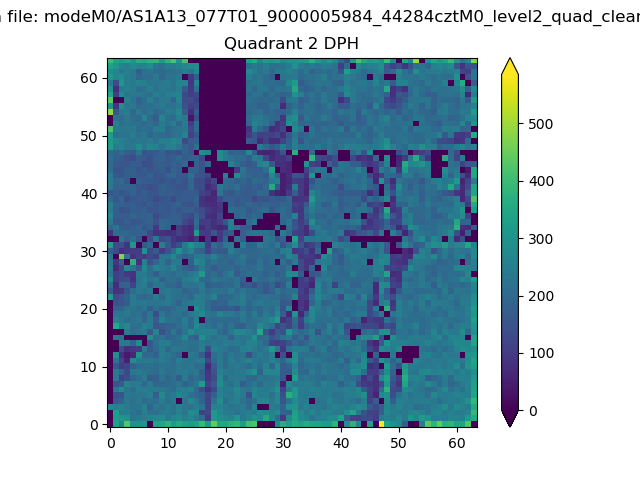 |
Quadrant C |
| Plot type | Count rate plots | Images |
|---|---|---|
| Comparison with Poisson distribution Blue bars denote a histogram of data divided into 1 sec bins. Red curve is a Poisson curve with rate = median count rate of data. |
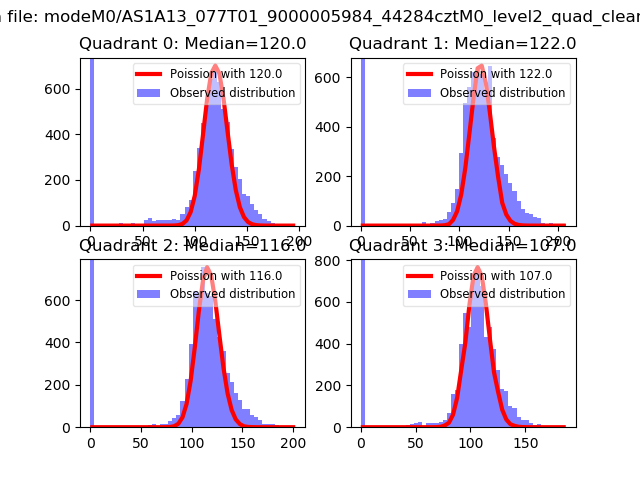 |
 |
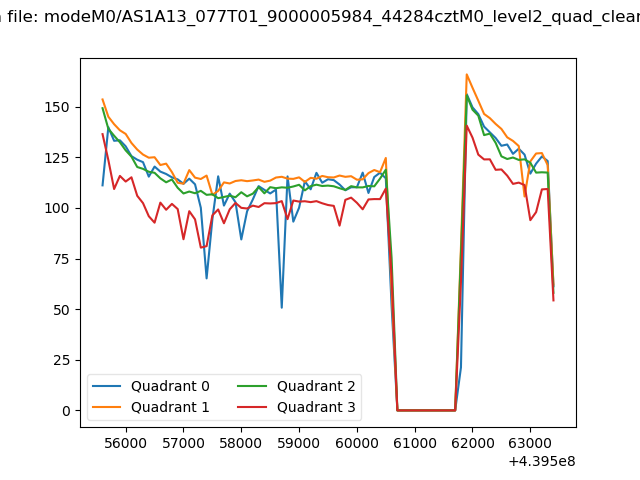
| Quadrant-wise count rates Data is divided into 100 sec bins |
 |
|
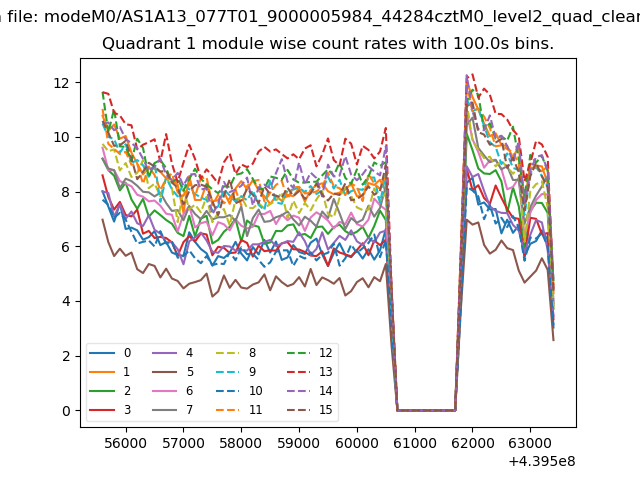
| Module-wise count rates for Quadrant A Data is divided into 100 sec bins |
 |
 |
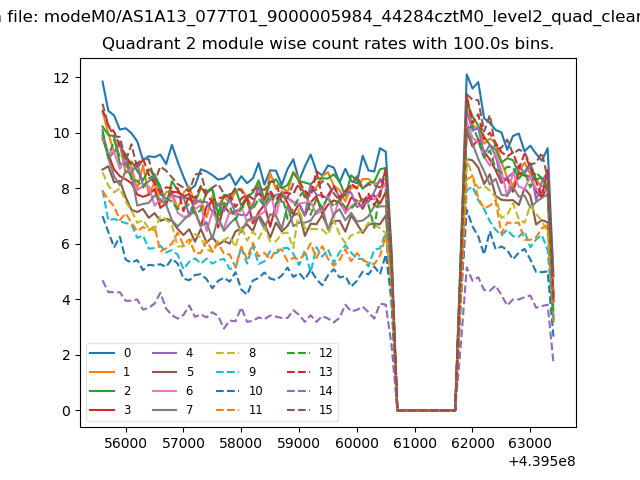
| Module-wise count rates for Quadrant B Data is divided into 100 sec bins |
 |
 |
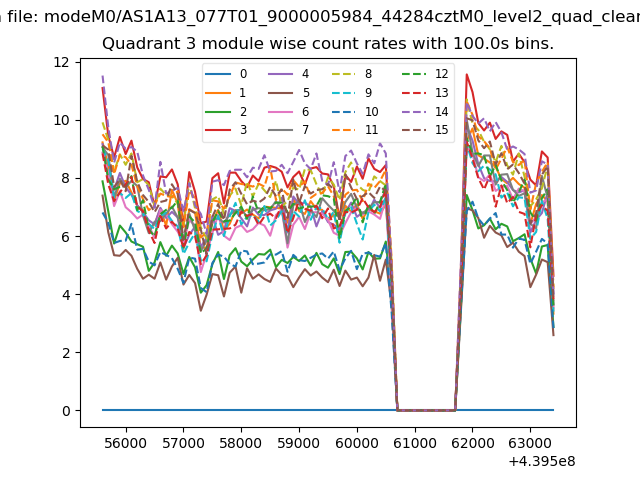
| Module-wise count rates for Quadrant C Data is divided into 100 sec bins |
 |
 |
| Module-wise count rates for Quadrant D Data is divided into 100 sec bins |
 |
 |
| Parameter | Plot |
|---|---|
| CZT HV Monitor |  |
| D_VDD | 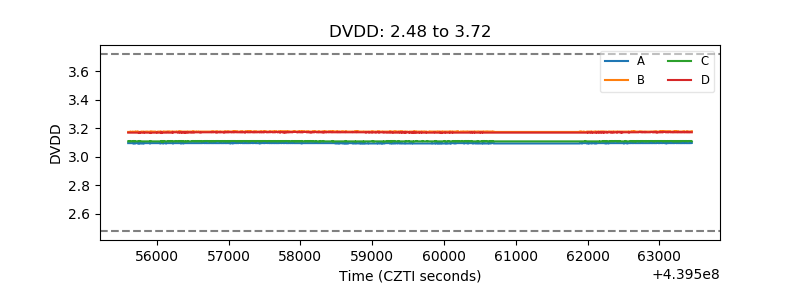 |
| Temperature 1 | 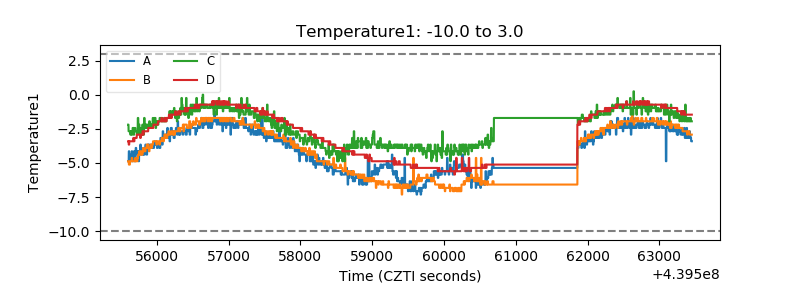 |
| Veto HV Monitor | 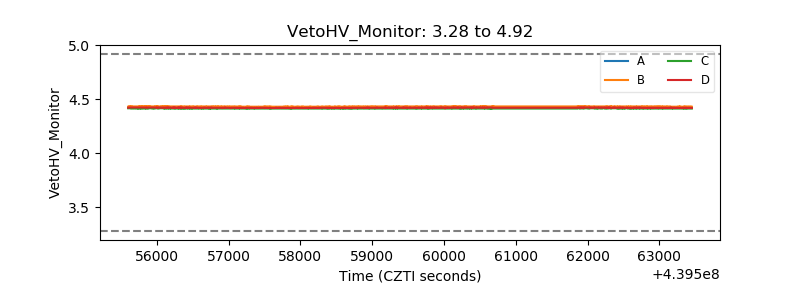 |
| Veto LLD | 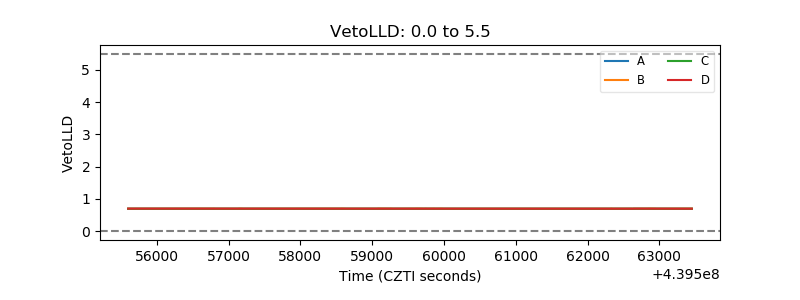 |
| Alpha Counter | 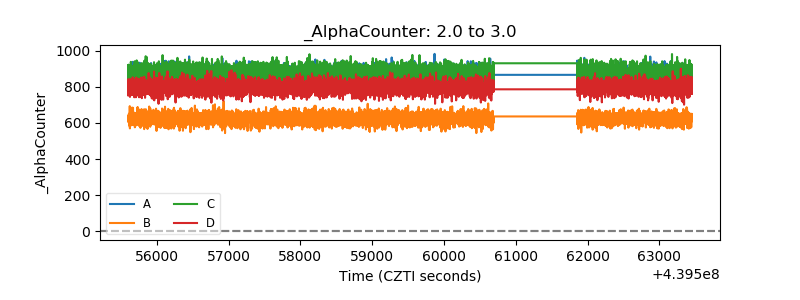 |
| _CPM_Rate | 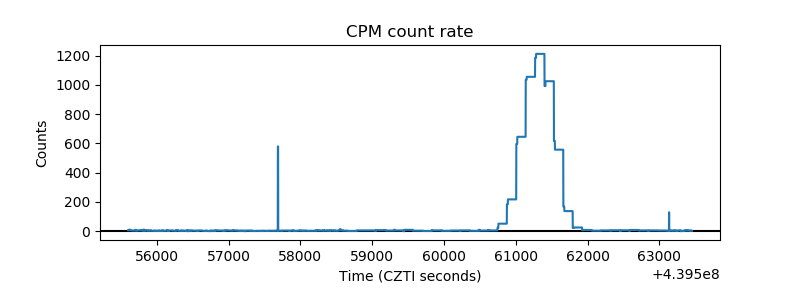 |
| CZT Counter | 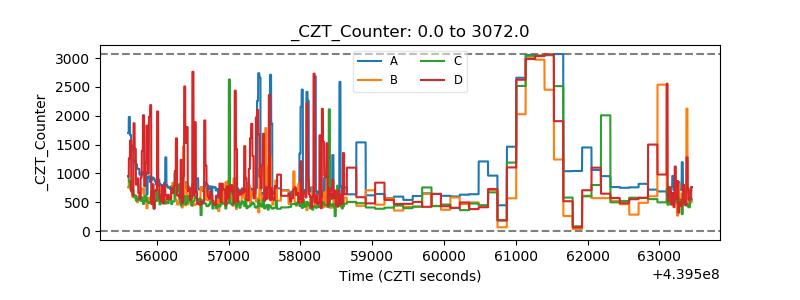 |
| +2.5 Volts monitor | 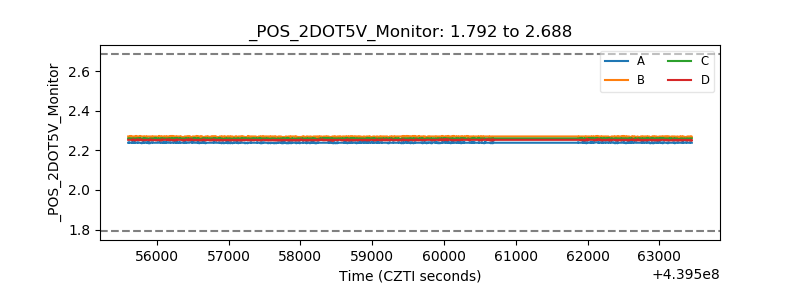 |
| +5 Volts monitor | 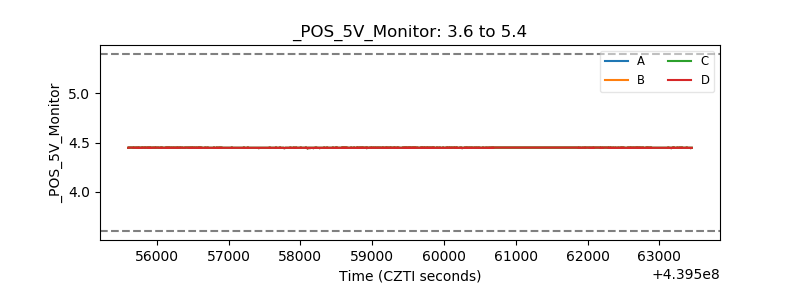 |
| _ROLL_ROT | 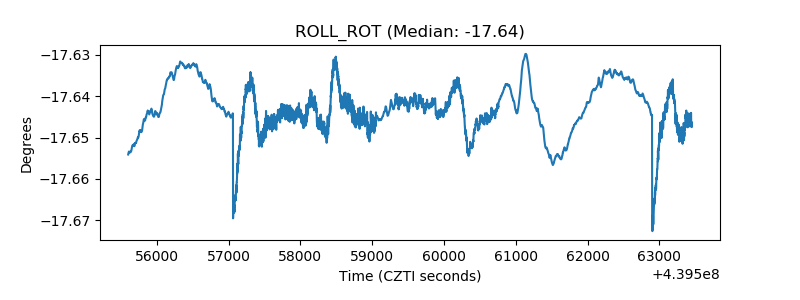 |
| _Roll_DEC | 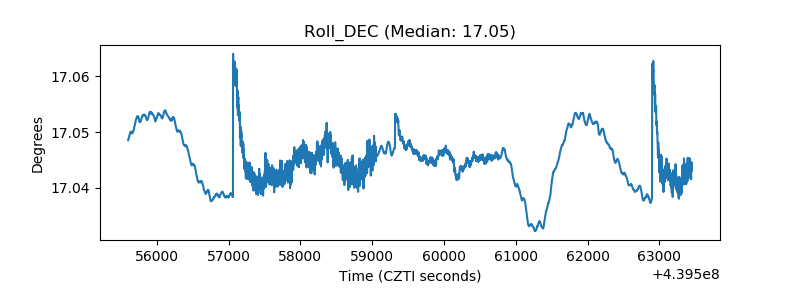 |
| _Roll_RA | 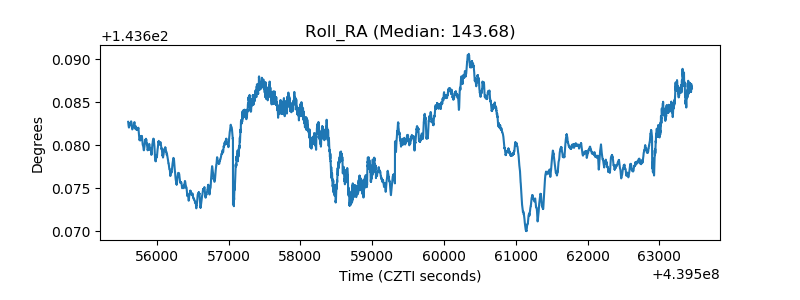 |
| Veto Counter | 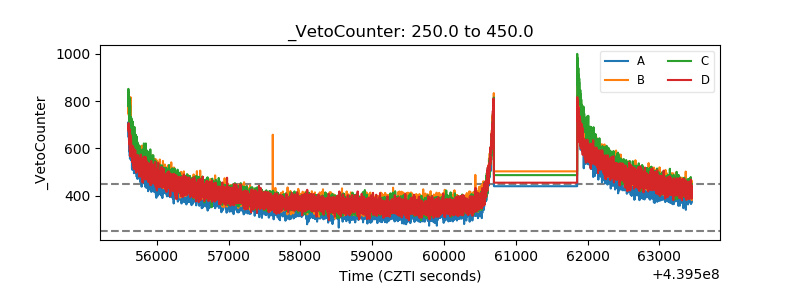 |