| Param | Original file | Final file |
|---|---|---|
| Filename | modeM0/AS1A13_077T01_9000005984_44286cztM0_level2.fits | modeM0/AS1A13_077T01_9000005984_44286cztM0_level2_quad_clean.evt |
| Size (bytes) | 510,952,320 | 114,287,040 |
| Size | 487.3 MB | 109.0 MB |
| Events in quadrant A | 6,463,708 | 738,354 |
| Events in quadrant B | 3,747,353 | 809,050 |
| Events in quadrant C | 3,479,403 | 772,984 |
| Events in quadrant D | 4,727,266 | 694,248 |
| Mode M0 | |||
|---|---|---|---|
| Quadrant | BADHDUFLAG | Total packets | Discarded packets |
| A | 0 | 24035 | 2 |
| B | 0 | 15248 | 2 |
| C | 0 | 14407 | 2 |
| D | 0 | 18303 | 2 |
| Mode M9 | |||
|---|---|---|---|
| Quadrant | BADHDUFLAG | Total packets | Discarded packets |
| A | 0 | 12 | 0 |
| B | 0 | 12 | 0 |
| C | 0 | 12 | 0 |
| D | 0 | 12 | 0 |
| Mode SS | |||
|---|---|---|---|
| Quadrant | BADHDUFLAG | Total packets | Discarded packets |
| A | 0 | 130 | 0 |
| B | 0 | 130 | 0 |
| C | 0 | 130 | 0 |
| D | 0 | 130 | 0 |
| Quadrant | Total seconds | Saturated seconds | Saturation percentage |
|---|---|---|---|
| A | 6392 | 794 | 12.421777% |
| B | 6393 | 157 | 2.455811% |
| C | 6393 | 109 | 1.704990% |
| D | 6392 | 330 | 5.162703% |
Noise dominated data is calculated using 1-second bins in cleaned event files. If a bin has >2000 counts, and if more than 50% of those come from <1% of pixels, then it is considered to be noise-dominated and hence unusable.
| Quadrant | # 1 sec bins | Bins with >0 counts | Bins with >2000 counts | High rate bins dominated by noise | Noise dominated (total time) | Noise dominated (detector-on time) | Marked lightcurve |
|---|---|---|---|---|---|---|---|
| A | 7602 | 6393 | 477 | 477 | 6.27% | 7.46% | 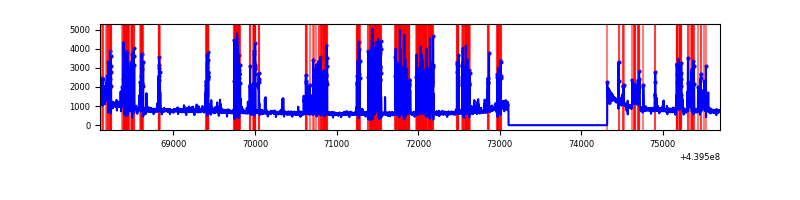 |
| B | 7603 | 6394 | 39 | 39 | 0.51% | 0.61% | 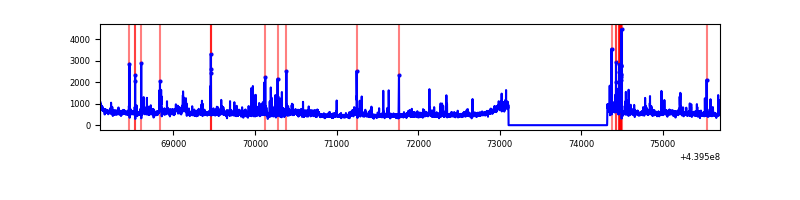 |
| C | 7603 | 6393 | 30 | 30 | 0.39% | 0.47% | 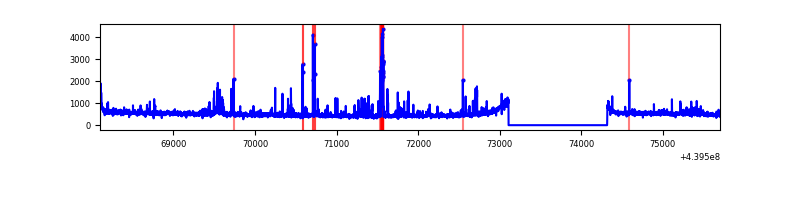 |
| D | 7602 | 6393 | 214 | 214 | 2.82% | 3.35% | 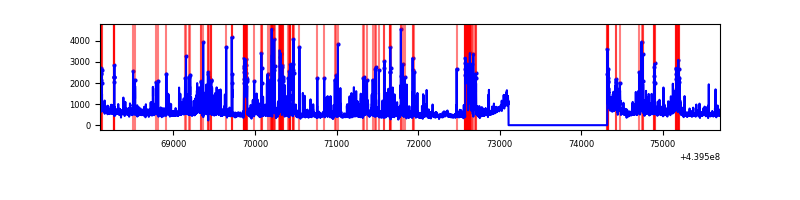 |
Top three noisy pixels from each quadrant. If the there are fewer than three noisy pixels in the level2.evt file, extra rows are filled as -1
| Pixel properties | Quadrant properties | ||||||
|---|---|---|---|---|---|---|---|
| Quadrant | DetID | PixID | Counts | Sigma | Mean | Median | Sigma |
| A | 15 | 223 | 1771922 | 11097.99 | 775 | 759 | 159.6 |
| A | 10 | 83 | 1655802 | 10370.39 | 775 | 759 | 159.6 |
| A | 7 | 3 | 14729 | 87.53 | 775 | 759 | 159.6 |
| B | 0 | 219 | 177664 | 1130.44 | 794 | 772 | 156.5 |
| B | 0 | 200 | 97034 | 615.17 | 794 | 772 | 156.5 |
| B | 0 | 155 | 86101 | 545.3 | 794 | 772 | 156.5 |
| C | 14 | 254 | 273461 | 1467.99 | 790 | 796 | 185.7 |
| C | 3 | 233 | 55347 | 293.69 | 790 | 796 | 185.7 |
| C | 1 | 3 | 39101 | 206.23 | 790 | 796 | 185.7 |
| D | 1 | 52 | 580444 | 2974.09 | 779 | 757 | 194.9 |
| D | 13 | 249 | 458748 | 2349.73 | 779 | 757 | 194.9 |
| D | 2 | 120 | 224051 | 1145.61 | 779 | 757 | 194.9 |
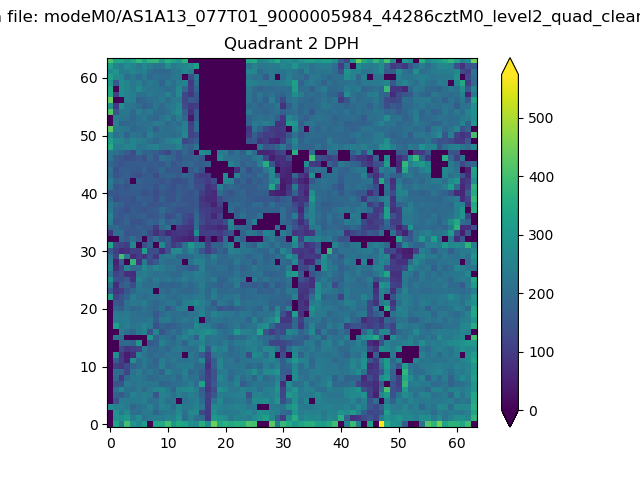
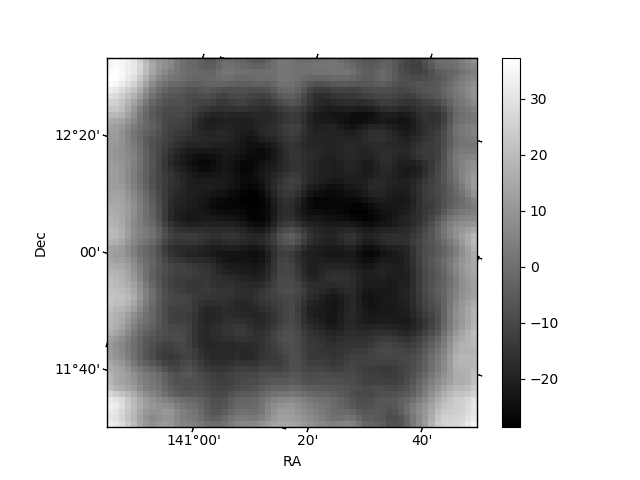
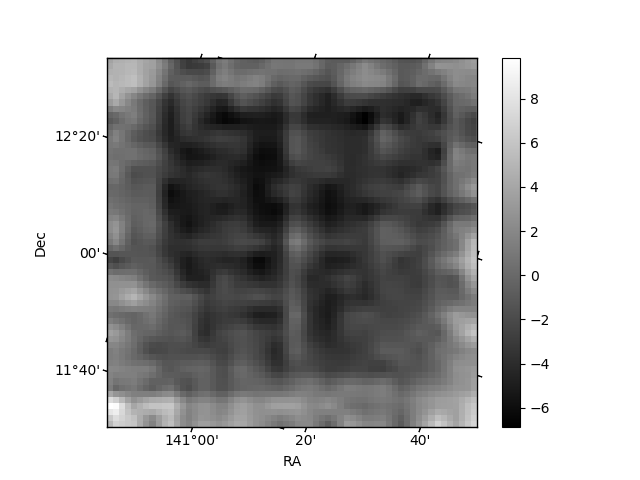
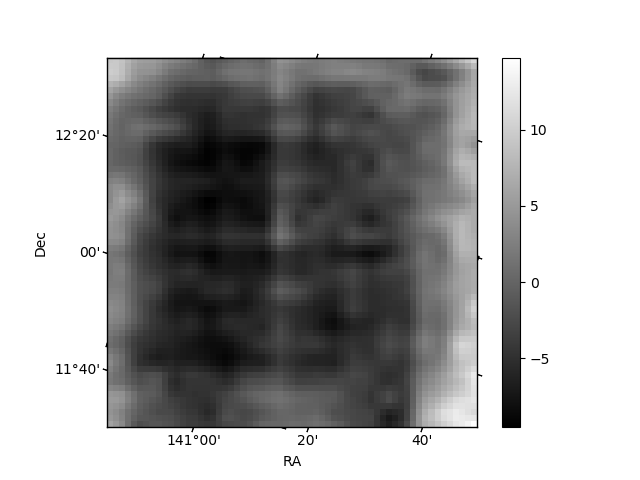
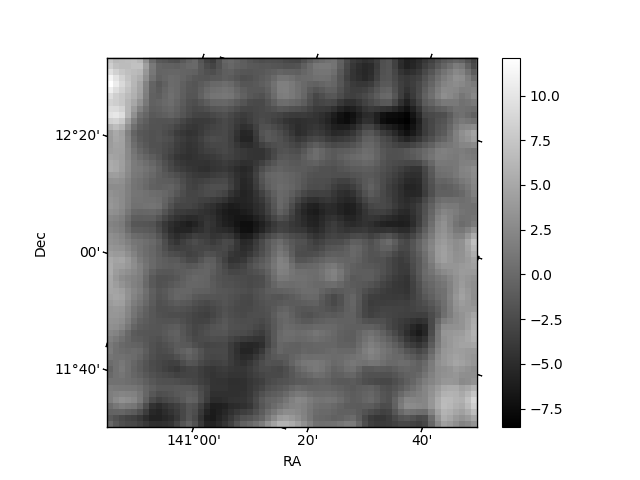
Histogram calculated using DETX and DETY for each event in the final _common_clean file
| Quadrant A | 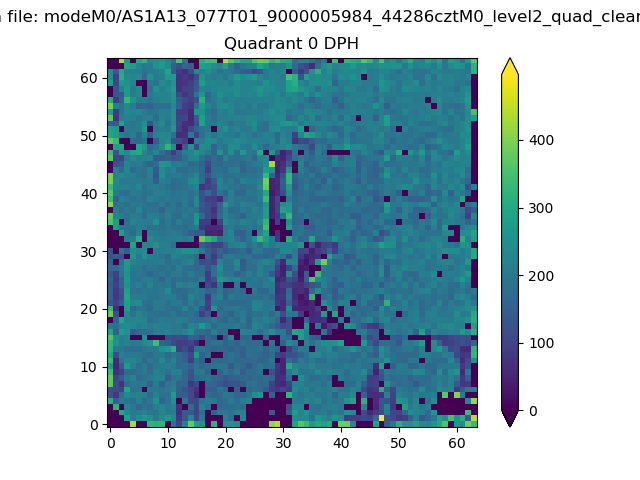 |
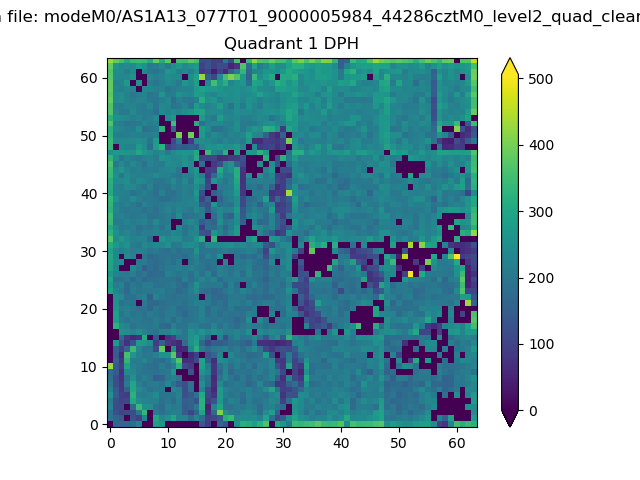 |
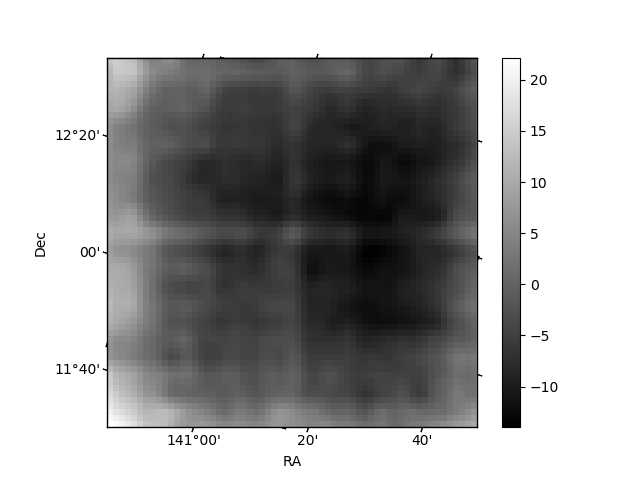
Quadrant B |
|---|---|---|---|
| Quadrant D | 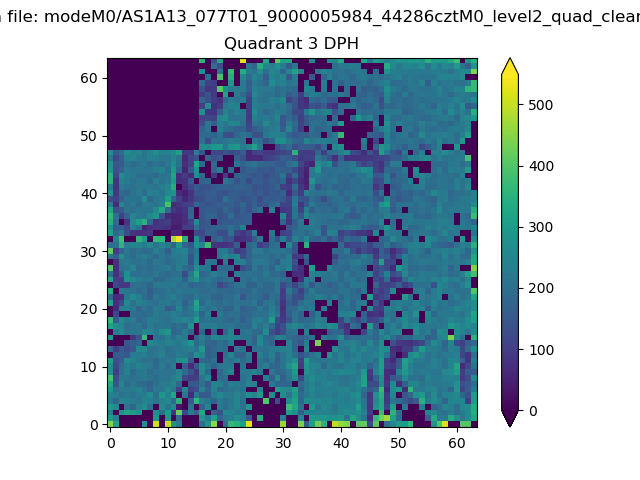 |
 |
Quadrant C |
| Plot type | Count rate plots | Images |
|---|---|---|
| Comparison with Poisson distribution Blue bars denote a histogram of data divided into 1 sec bins. Red curve is a Poisson curve with rate = median count rate of data. |
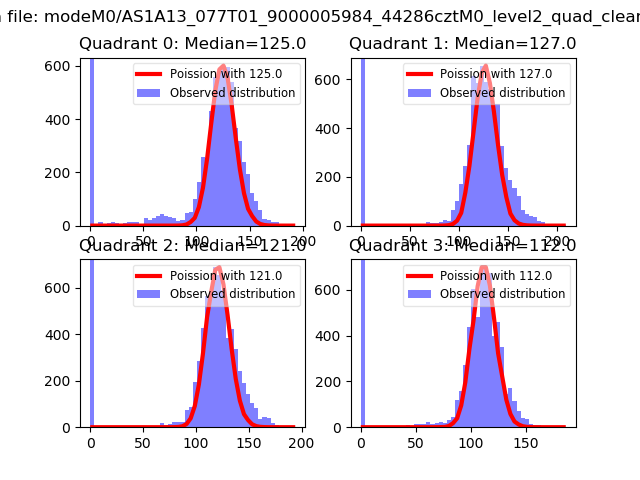 |
 |
| Quadrant-wise count rates Data is divided into 100 sec bins |
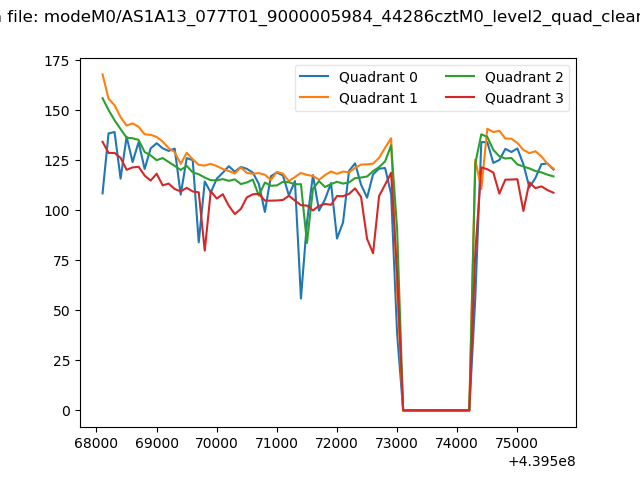 |
|
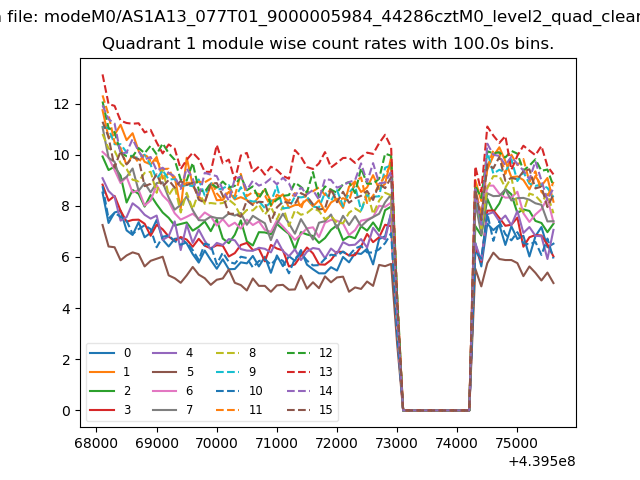
| Module-wise count rates for Quadrant A Data is divided into 100 sec bins |
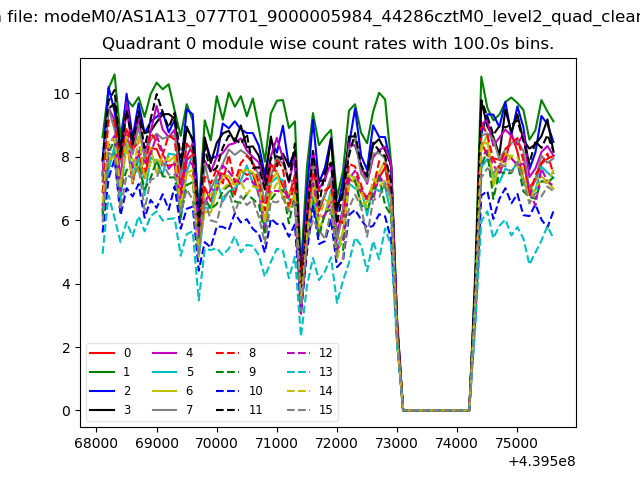 |
 |
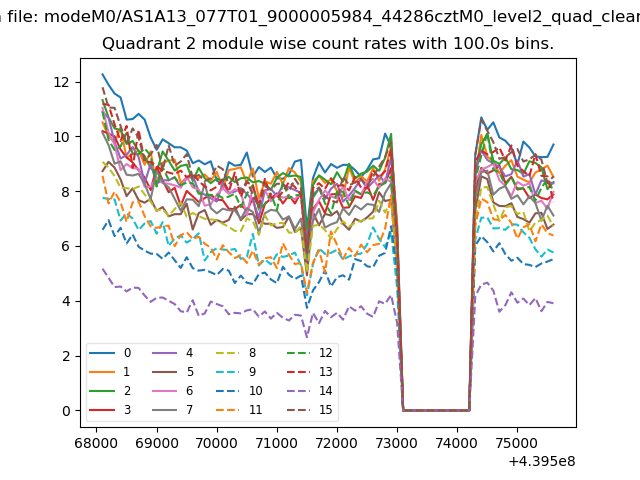
| Module-wise count rates for Quadrant B Data is divided into 100 sec bins |
 |
 |
| Module-wise count rates for Quadrant C Data is divided into 100 sec bins |
 |
 |
| Module-wise count rates for Quadrant D Data is divided into 100 sec bins |
 |
 |
| Parameter | Plot |
|---|---|
| CZT HV Monitor | 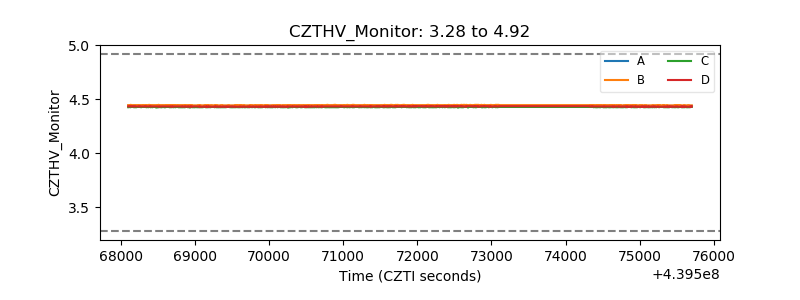 |
| D_VDD | 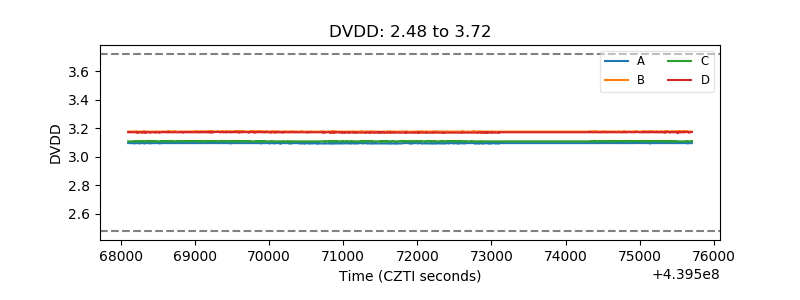 |
| Temperature 1 | 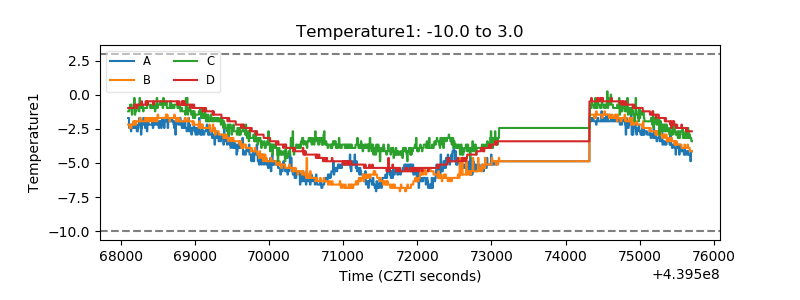 |
| Veto HV Monitor | 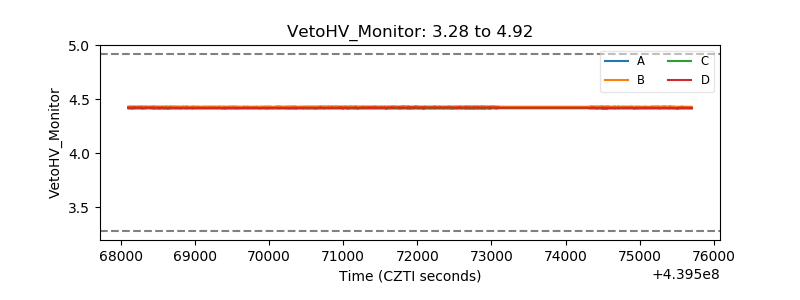 |
| Veto LLD | 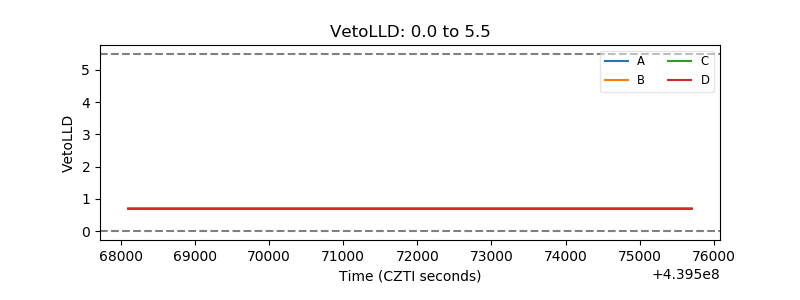 |
| Alpha Counter | 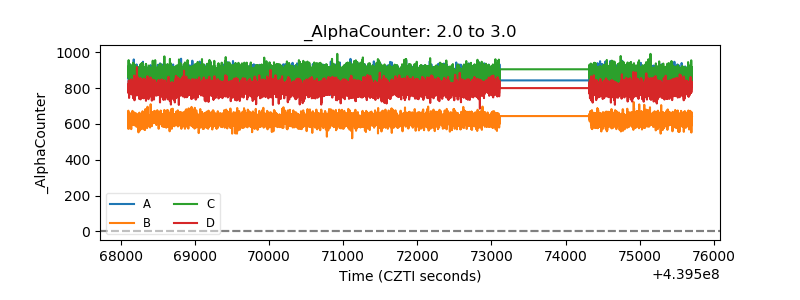 |
| _CPM_Rate | 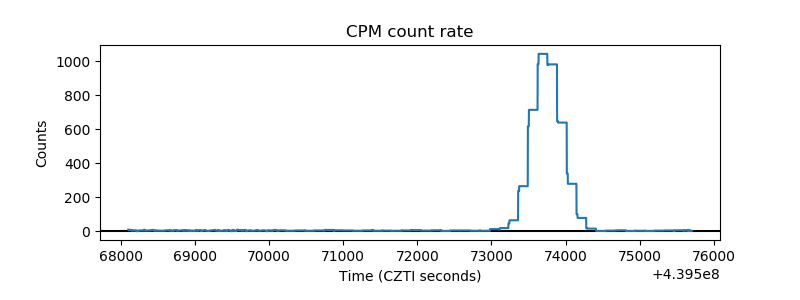 |
| CZT Counter | 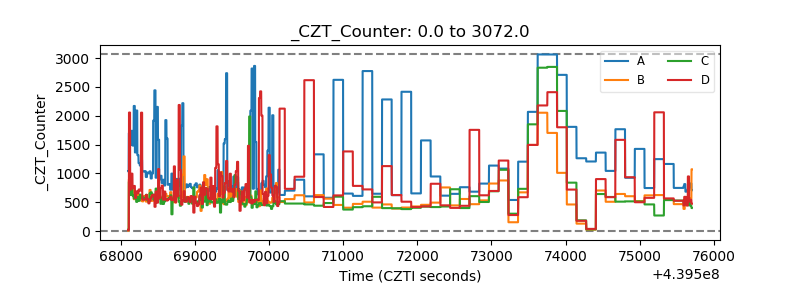 |
| +2.5 Volts monitor | 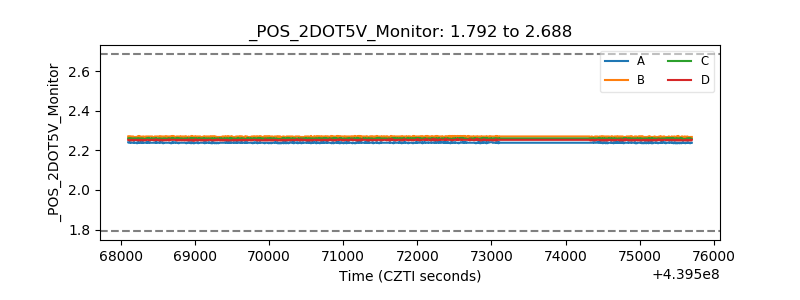 |
| +5 Volts monitor | 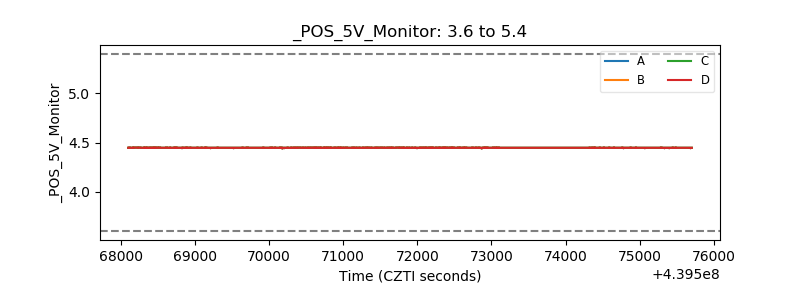 |
| _ROLL_ROT | 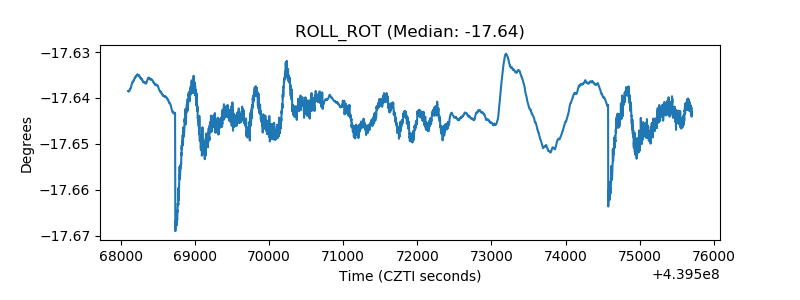 |
| _Roll_DEC | 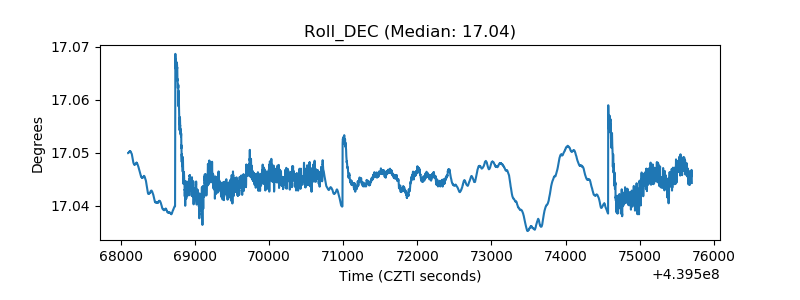 |
| _Roll_RA | 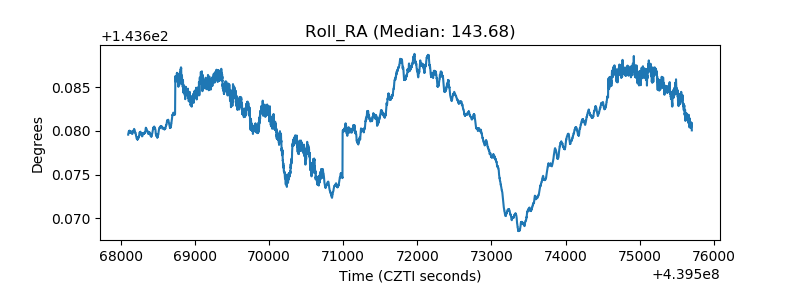 |
| Veto Counter | 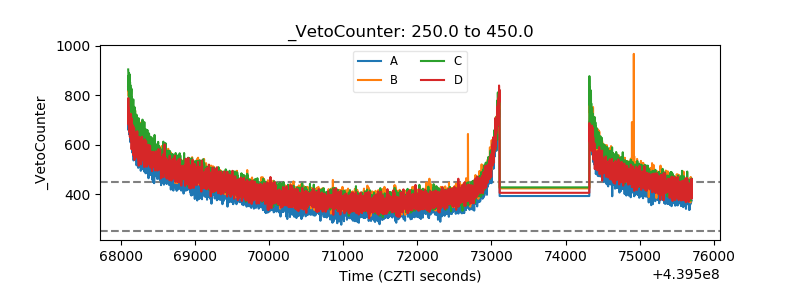 |