| Param | Original file | Final file |
|---|---|---|
| Filename | modeM0/AS1A13_077T01_9000005984_44458cztM0_level2.fits | modeM0/AS1A13_077T01_9000005984_44458cztM0_level2_quad_clean.evt |
| Size (bytes) | 463,184,640 | 104,071,680 |
| Size | 441.7 MB | 99.3 MB |
| Events in quadrant A | 4,381,052 | 717,646 |
| Events in quadrant B | 3,218,002 | 733,506 |
| Events in quadrant C | 5,433,236 | 634,169 |
| Events in quadrant D | 3,628,322 | 630,572 |
| Mode M0 | |||
|---|---|---|---|
| Quadrant | BADHDUFLAG | Total packets | Discarded packets |
| A | 0 | 18288 | 1 |
| B | 0 | 13918 | 1 |
| C | 0 | 20416 | 1 |
| D | 0 | 15277 | 1 |
| Mode M9 | |||
|---|---|---|---|
| Quadrant | BADHDUFLAG | Total packets | Discarded packets |
| A | 0 | 12 | 0 |
| B | 0 | 12 | 0 |
| C | 0 | 12 | 0 |
| D | 0 | 12 | 0 |
| Mode SS | |||
|---|---|---|---|
| Quadrant | BADHDUFLAG | Total packets | Discarded packets |
| A | 0 | 126 | 0 |
| B | 0 | 126 | 0 |
| C | 0 | 126 | 0 |
| D | 0 | 126 | 0 |
| Quadrant | Total seconds | Saturated seconds | Saturation percentage |
|---|---|---|---|
| A | 6240 | 69 | 1.105769% |
| B | 6241 | 156 | 2.499599% |
| C | 6241 | 798 | 12.786412% |
| D | 6241 | 141 | 2.259253% |
Noise dominated data is calculated using 1-second bins in cleaned event files. If a bin has >2000 counts, and if more than 50% of those come from <1% of pixels, then it is considered to be noise-dominated and hence unusable.
| Quadrant | # 1 sec bins | Bins with >0 counts | Bins with >2000 counts | High rate bins dominated by noise | Noise dominated (total time) | Noise dominated (detector-on time) | Marked lightcurve |
|---|---|---|---|---|---|---|---|
| A | 7425 | 6241 | 2 | 2 | 0.03% | 0.03% | 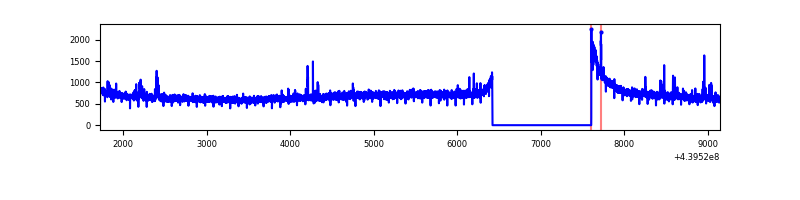 |
| B | 7426 | 6242 | 74 | 74 | 1.00% | 1.19% | 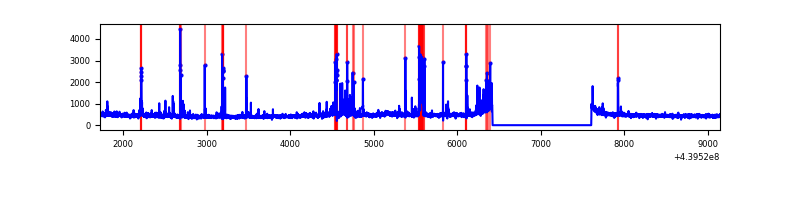 |
| C | 7426 | 6242 | 665 | 665 | 8.96% | 10.65% | 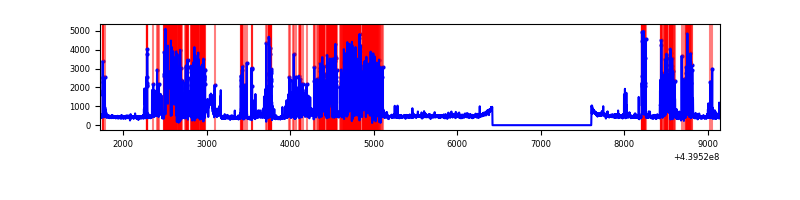 |
| D | 7426 | 6242 | 113 | 113 | 1.52% | 1.81% | 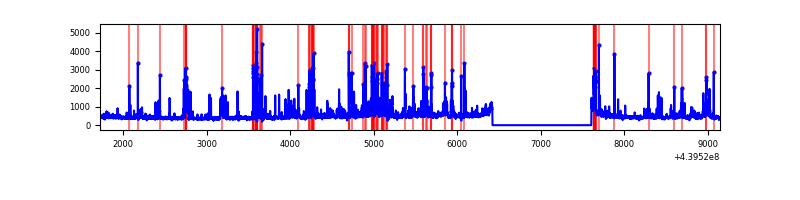 |
Top three noisy pixels from each quadrant. If the there are fewer than three noisy pixels in the level2.evt file, extra rows are filled as -1
| Pixel properties | Quadrant properties | ||||||
|---|---|---|---|---|---|---|---|
| Quadrant | DetID | PixID | Counts | Sigma | Mean | Median | Sigma |
| A | 10 | 83 | 1590677 | 10920.11 | 705 | 692 | 145.6 |
| A | 14 | 238 | 55648 | 377.44 | 705 | 692 | 145.6 |
| A | 7 | 3 | 9154 | 58.12 | 705 | 692 | 145.6 |
| B | 4 | 170 | 418132 | 3055.37 | 697 | 675 | 136.6 |
| B | 5 | 172 | 24714 | 175.94 | 697 | 675 | 136.6 |
| B | 0 | 190 | 17711 | 124.69 | 697 | 675 | 136.6 |
| C | 12 | 16 | 2814686 | 18658.81 | 648 | 651 | 150.8 |
| C | 14 | 254 | 70144 | 460.78 | 648 | 651 | 150.8 |
| C | 12 | 2 | 9766 | 60.44 | 648 | 651 | 150.8 |
| D | 5 | 235 | 239377 | 1411.37 | 678 | 658 | 169.1 |
| D | 13 | 249 | 233995 | 1379.55 | 678 | 658 | 169.1 |
| D | 1 | 52 | 174409 | 1027.26 | 678 | 658 | 169.1 |
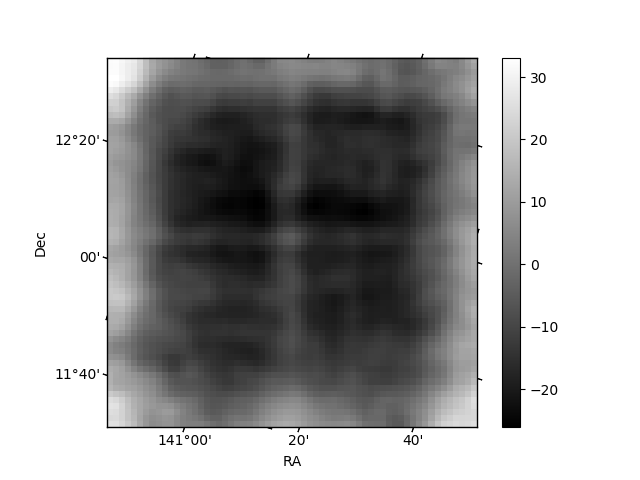
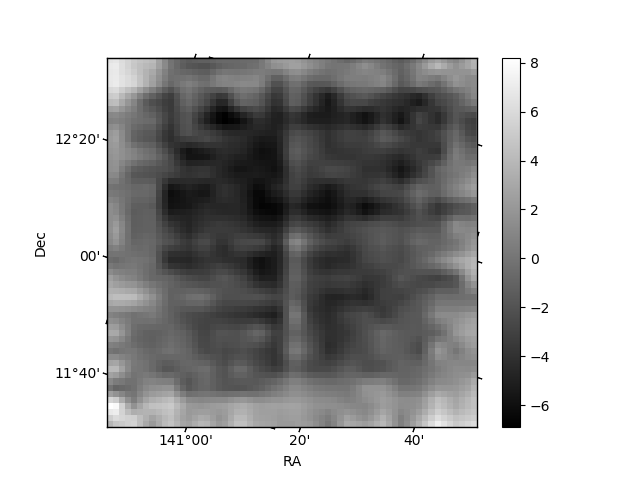
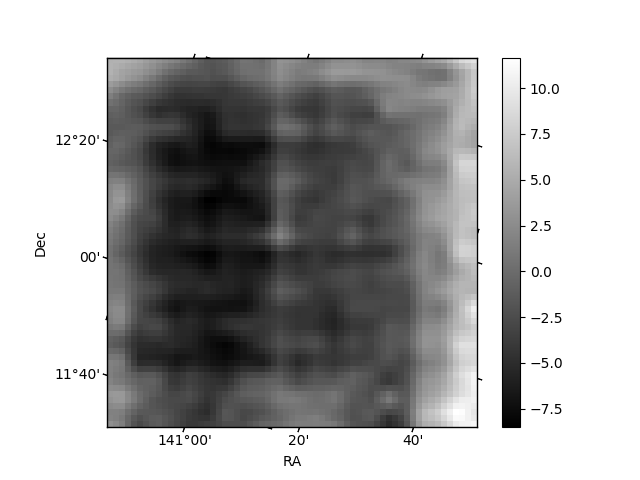
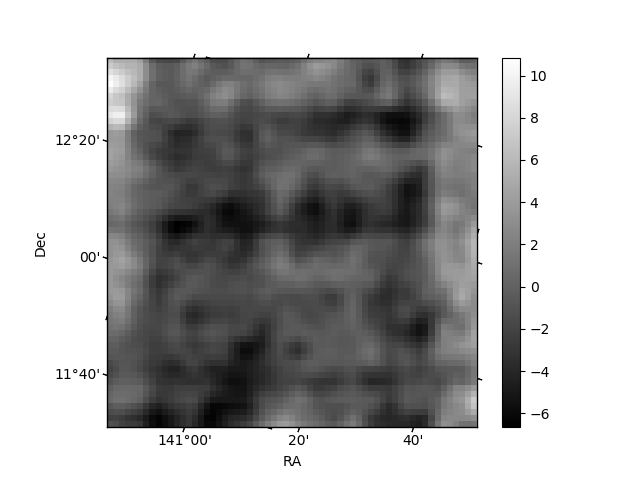
Histogram calculated using DETX and DETY for each event in the final _common_clean file
| Quadrant A | 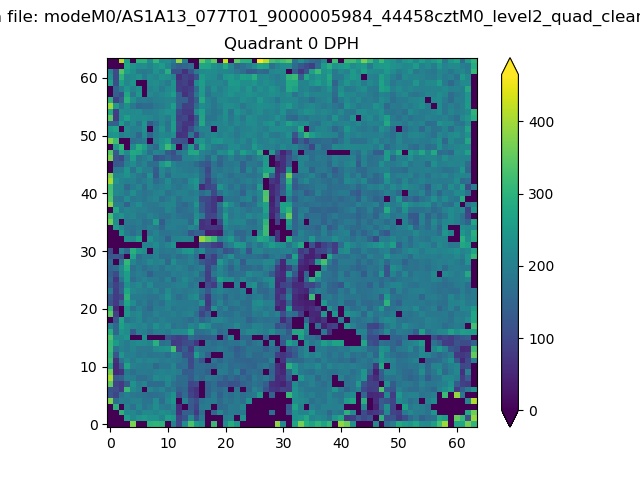 |
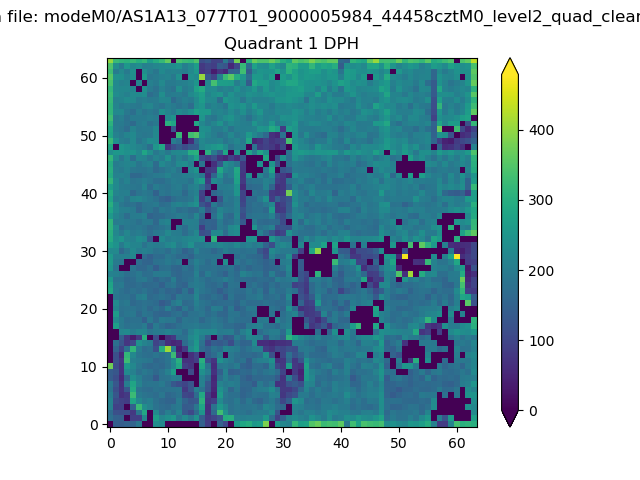 |
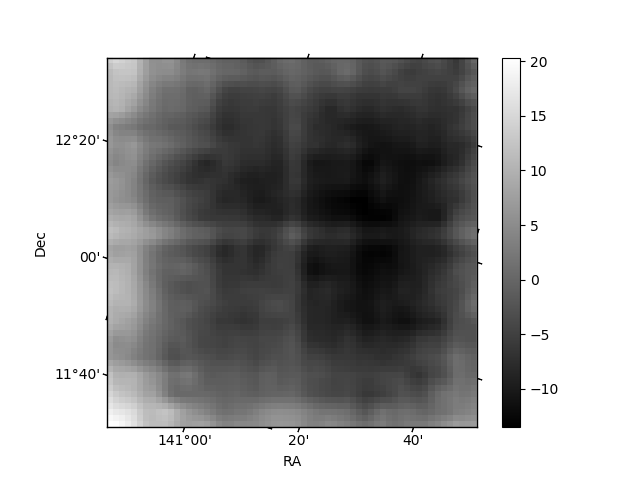
Quadrant B |
|---|---|---|---|
| Quadrant D | 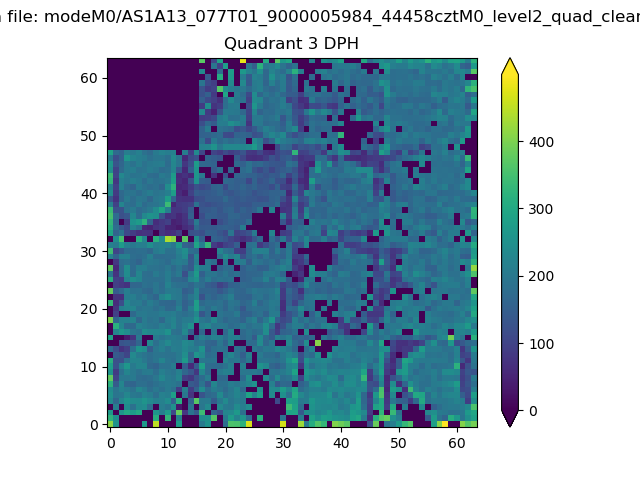 |
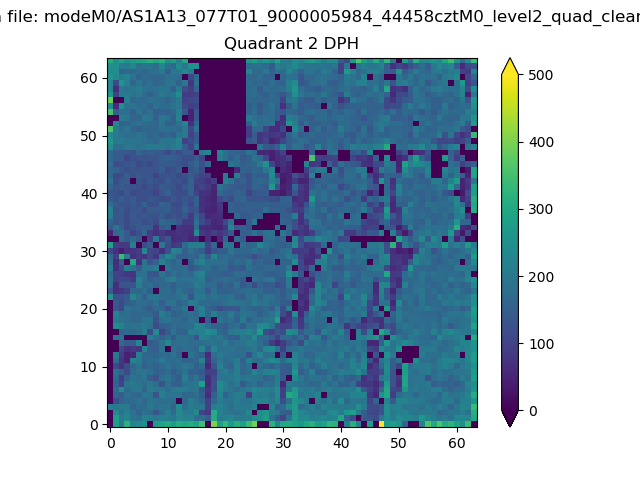 |
Quadrant C |
| Plot type | Count rate plots | Images |
|---|---|---|
| Comparison with Poisson distribution Blue bars denote a histogram of data divided into 1 sec bins. Red curve is a Poisson curve with rate = median count rate of data. |
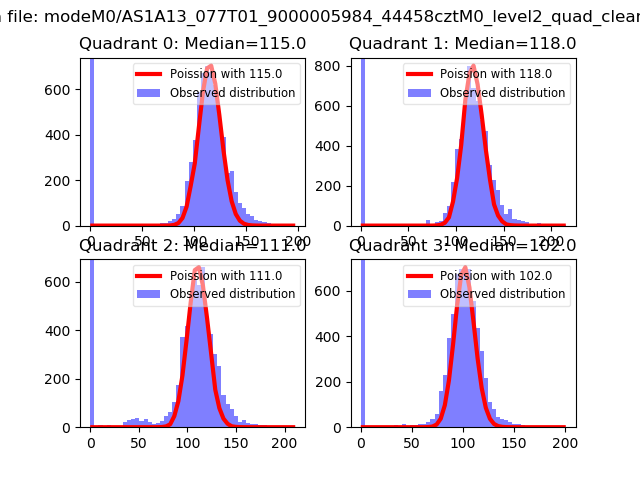 |
 |
| Quadrant-wise count rates Data is divided into 100 sec bins |
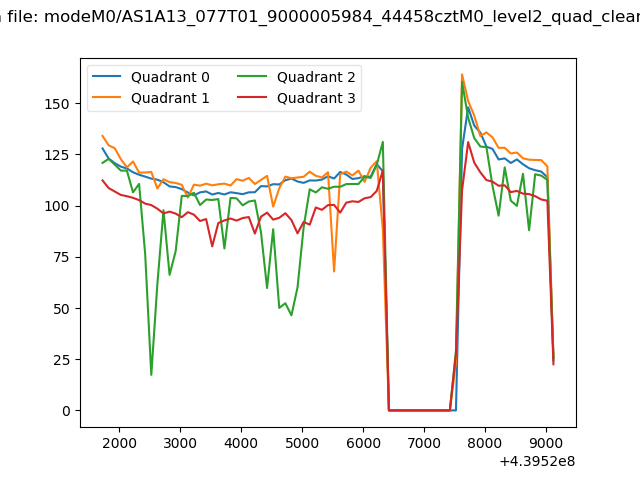 |
|
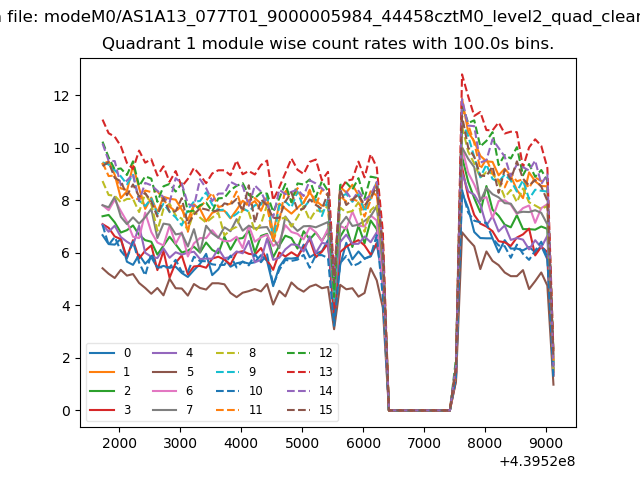
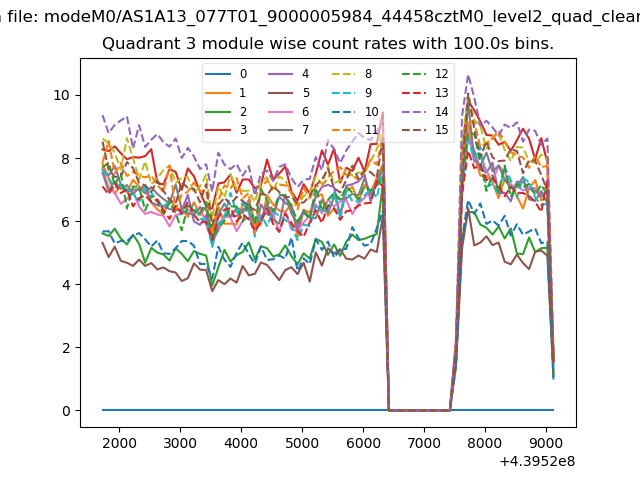
| Module-wise count rates for Quadrant A Data is divided into 100 sec bins |
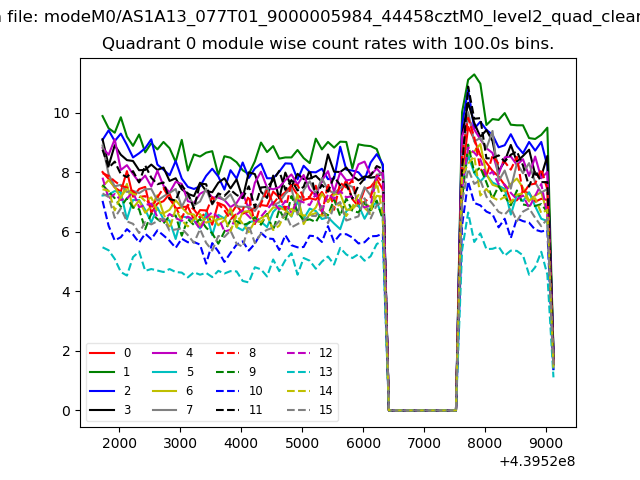 |
 |
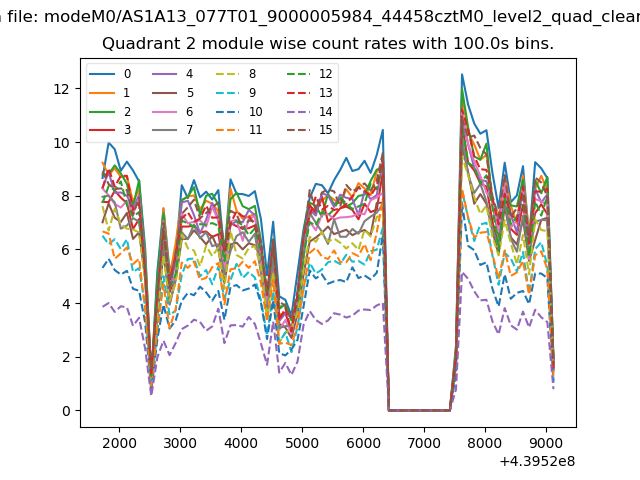
| Module-wise count rates for Quadrant B Data is divided into 100 sec bins |
 |
 |
| Module-wise count rates for Quadrant C Data is divided into 100 sec bins |
 |
 |
| Module-wise count rates for Quadrant D Data is divided into 100 sec bins |
 |
 |
| Parameter | Plot |
|---|---|
| CZT HV Monitor | 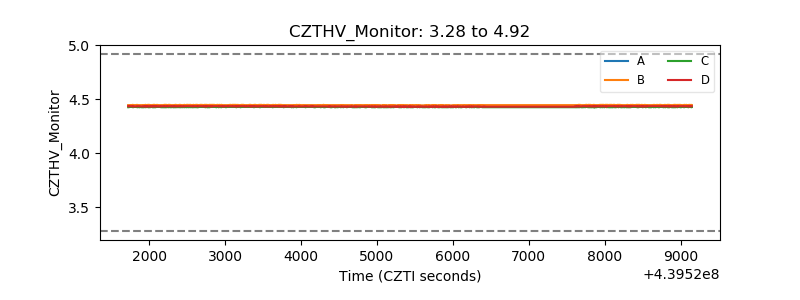 |
| D_VDD | 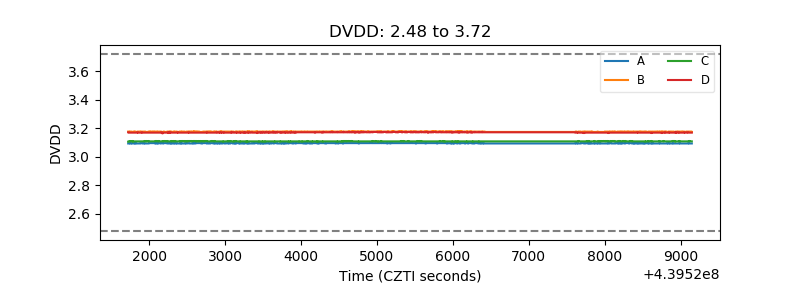 |
| Temperature 1 | 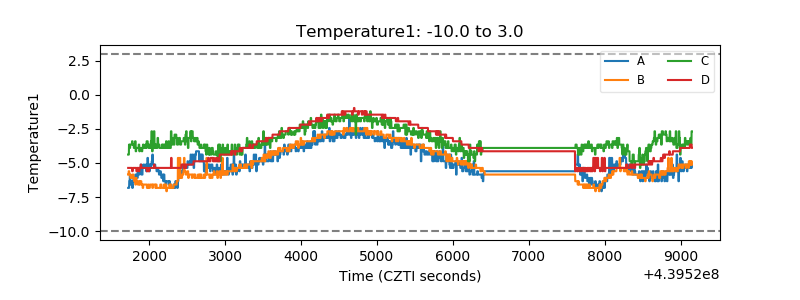 |
| Veto HV Monitor |  |
| Veto LLD | 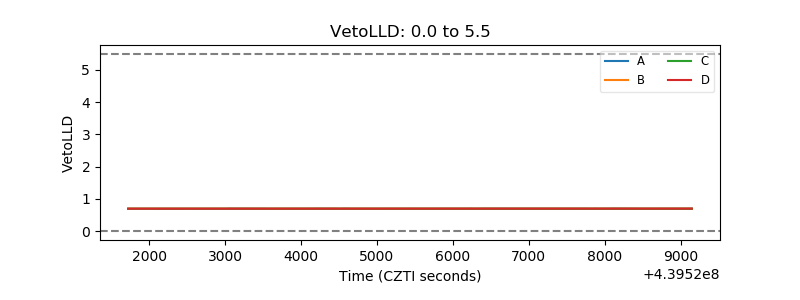 |
| Alpha Counter | 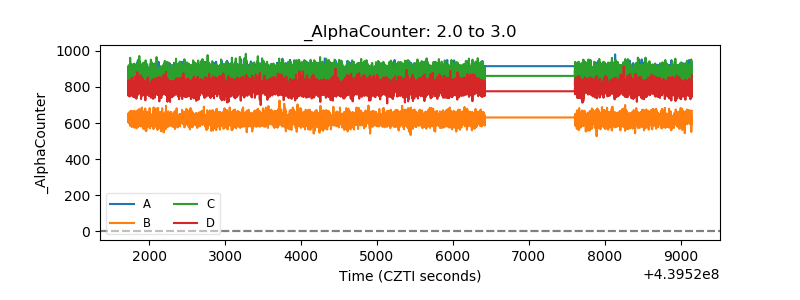 |
| _CPM_Rate | 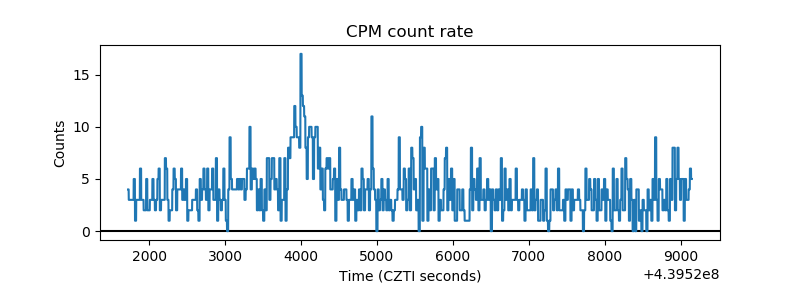 |
| CZT Counter | 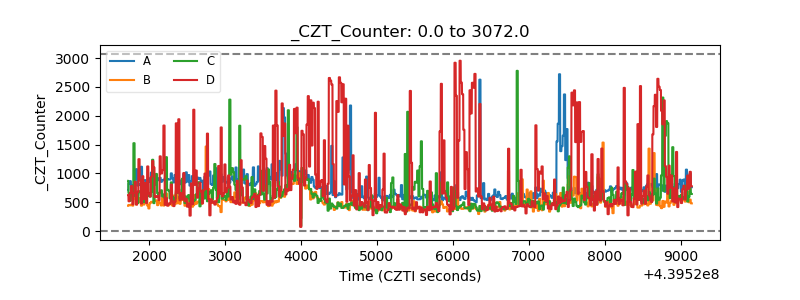 |
| +2.5 Volts monitor | 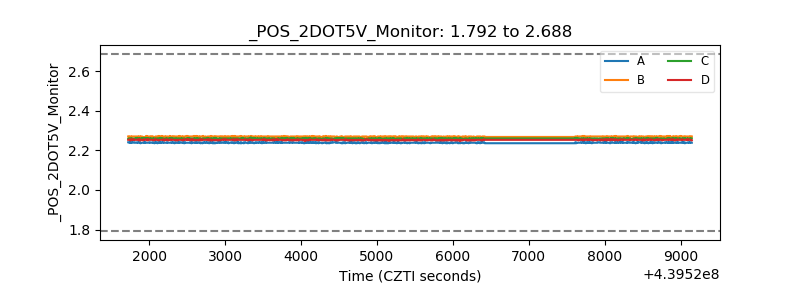 |
| +5 Volts monitor | 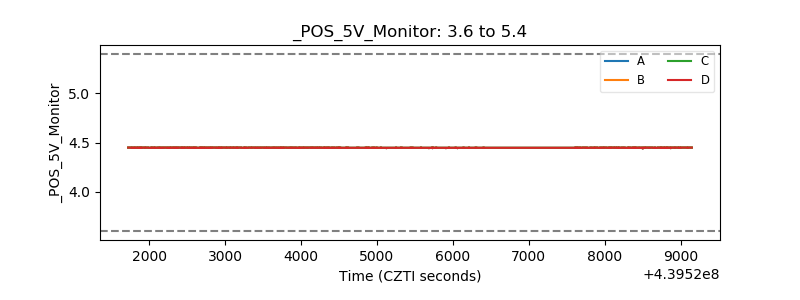 |
| _ROLL_ROT | 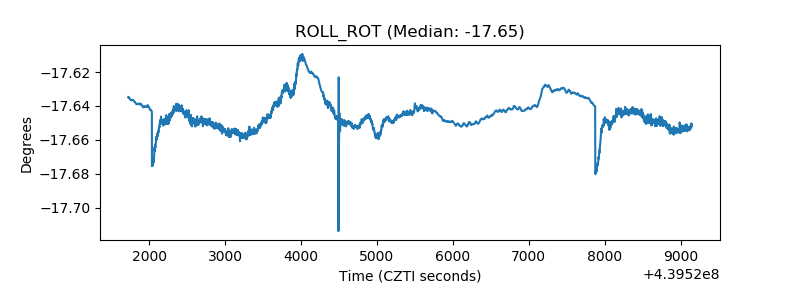 |
| _Roll_DEC | 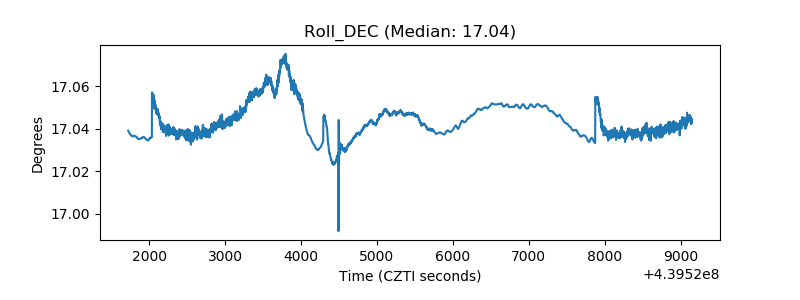 |
| _Roll_RA | 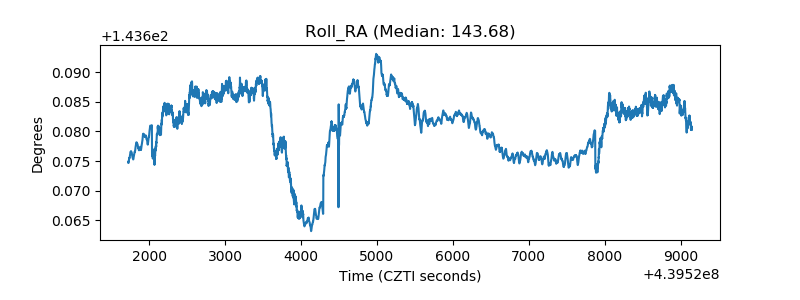 |
| Veto Counter | 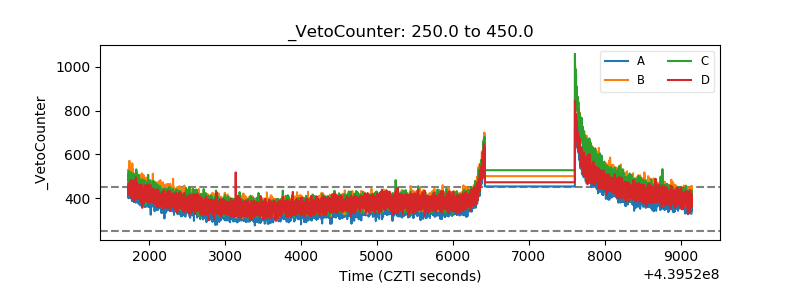 |