| Param | Original file | Final file |
|---|---|---|
| Filename | modeM0/AS1A13_077T01_9000005984_44459cztM0_level2.fits | modeM0/AS1A13_077T01_9000005984_44459cztM0_level2_quad_clean.evt |
| Size (bytes) | 489,968,640 | 112,291,200 |
| Size | 467.3 MB | 107.1 MB |
| Events in quadrant A | 4,764,968 | 770,740 |
| Events in quadrant B | 3,428,229 | 785,696 |
| Events in quadrant C | 4,714,516 | 723,951 |
| Events in quadrant D | 4,723,198 | 665,176 |
| Mode M0 | |||
|---|---|---|---|
| Quadrant | BADHDUFLAG | Total packets | Discarded packets |
| A | 0 | 19731 | 2 |
| B | 0 | 14602 | 3 |
| C | 0 | 18510 | 2 |
| D | 0 | 18507 | 2 |
| Mode M9 | |||
|---|---|---|---|
| Quadrant | BADHDUFLAG | Total packets | Discarded packets |
| A | 0 | 12 | 0 |
| B | 0 | 12 | 0 |
| C | 0 | 12 | 0 |
| D | 0 | 12 | 0 |
| Mode SS | |||
|---|---|---|---|
| Quadrant | BADHDUFLAG | Total packets | Discarded packets |
| A | 0 | 132 | 0 |
| B | 0 | 132 | 0 |
| C | 0 | 132 | 0 |
| D | 0 | 132 | 0 |
| Quadrant | Total seconds | Saturated seconds | Saturation percentage |
|---|---|---|---|
| A | 6522 | 114 | 1.747930% |
| B | 6521 | 213 | 3.266370% |
| C | 6522 | 438 | 6.715731% |
| D | 6522 | 365 | 5.596443% |
Noise dominated data is calculated using 1-second bins in cleaned event files. If a bin has >2000 counts, and if more than 50% of those come from <1% of pixels, then it is considered to be noise-dominated and hence unusable.
| Quadrant | # 1 sec bins | Bins with >0 counts | Bins with >2000 counts | High rate bins dominated by noise | Noise dominated (total time) | Noise dominated (detector-on time) | Marked lightcurve |
|---|---|---|---|---|---|---|---|
| A | 7687 | 6523 | 3 | 3 | 0.04% | 0.05% | 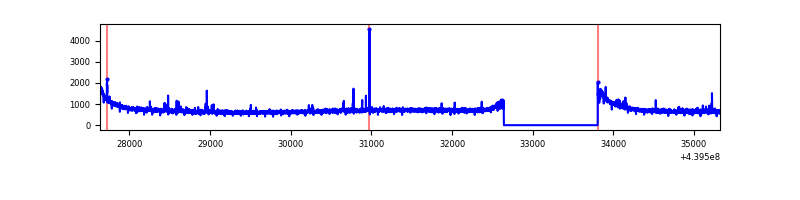 |
| B | 7686 | 6522 | 124 | 124 | 1.61% | 1.90% | 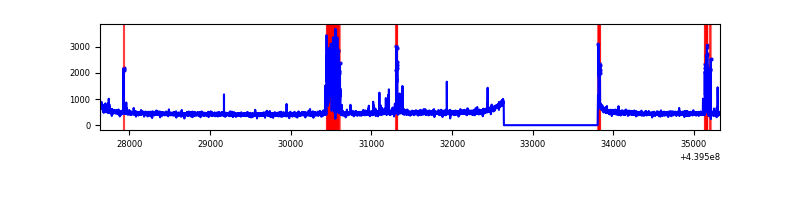 |
| C | 7687 | 6523 | 343 | 343 | 4.46% | 5.26% | 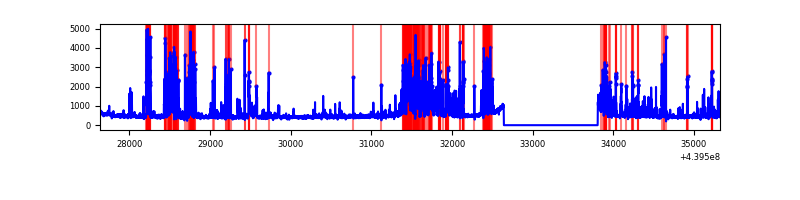 |
| D | 7687 | 6523 | 260 | 260 | 3.38% | 3.99% | 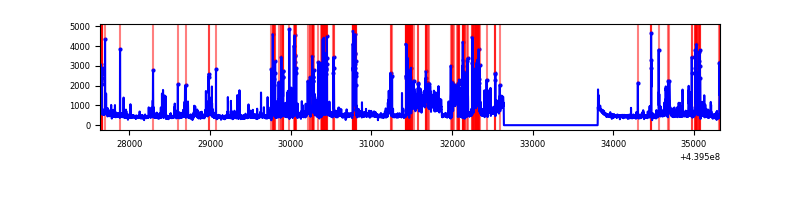 |
Top three noisy pixels from each quadrant. If the there are fewer than three noisy pixels in the level2.evt file, extra rows are filled as -1
| Pixel properties | Quadrant properties | ||||||
|---|---|---|---|---|---|---|---|
| Quadrant | DetID | PixID | Counts | Sigma | Mean | Median | Sigma |
| A | 10 | 83 | 1740631 | 11073.75 | 763 | 749 | 157.1 |
| A | 14 | 238 | 48304 | 302.67 | 763 | 749 | 157.1 |
| A | 7 | 3 | 17151 | 104.39 | 763 | 749 | 157.1 |
| B | 5 | 172 | 441276 | 3030.57 | 750 | 730 | 145.4 |
| B | 12 | 111 | 18243 | 120.47 | 750 | 730 | 145.4 |
| B | 11 | 111 | 16836 | 110.8 | 750 | 730 | 145.4 |
| C | 12 | 16 | 1371327 | 8083.35 | 726 | 730 | 169.6 |
| C | 14 | 254 | 462502 | 2723.39 | 726 | 730 | 169.6 |
| C | 3 | 233 | 29343 | 168.75 | 726 | 730 | 169.6 |
| D | 13 | 138 | 683414 | 3833.05 | 725 | 705 | 178.1 |
| D | 1 | 52 | 319996 | 1792.65 | 725 | 705 | 178.1 |
| D | 5 | 235 | 164487 | 919.55 | 725 | 705 | 178.1 |
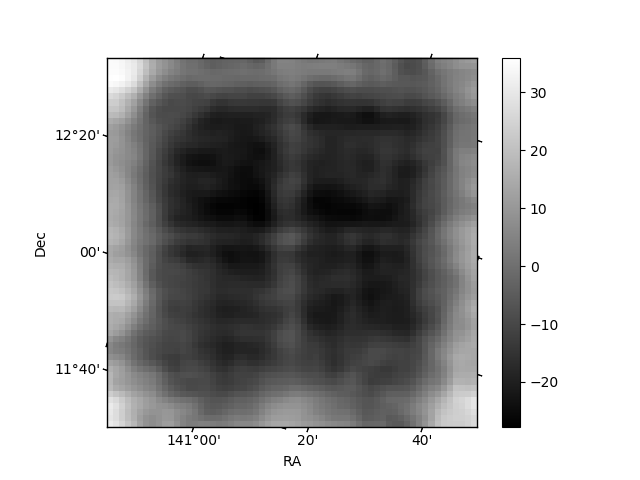
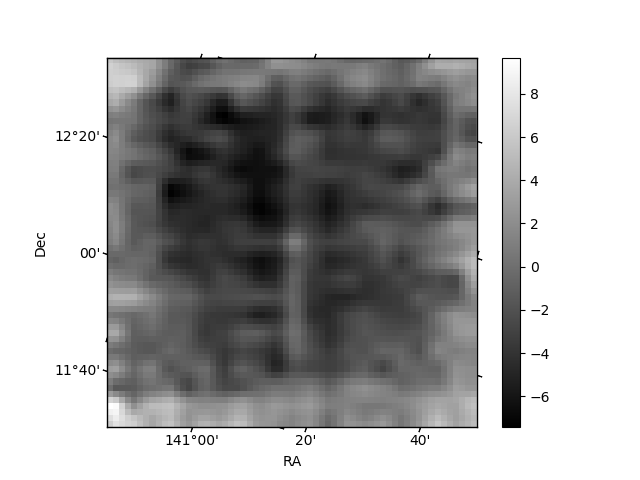
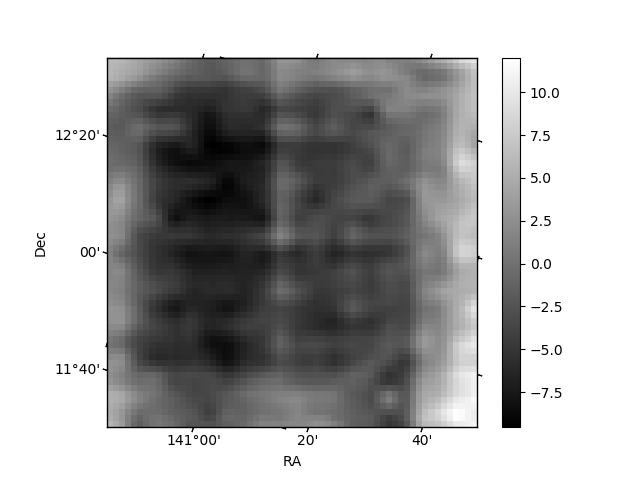
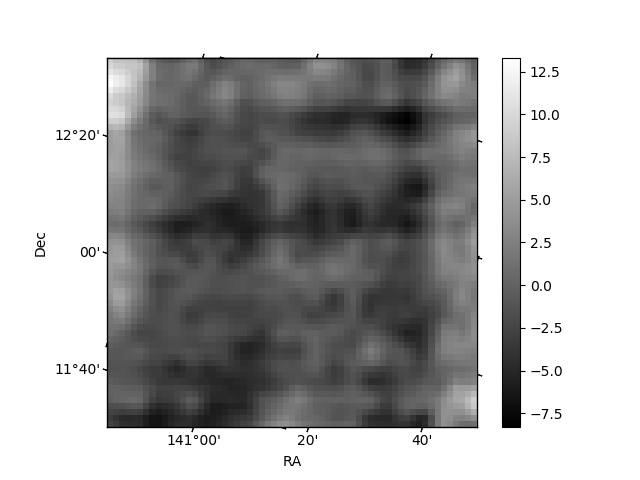
Histogram calculated using DETX and DETY for each event in the final _common_clean file
| Quadrant A | 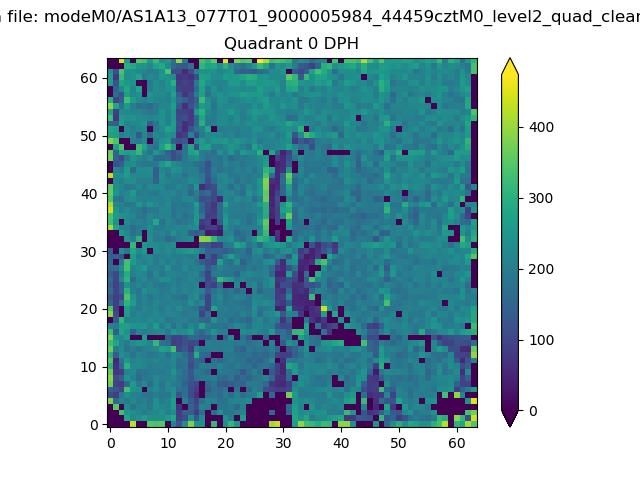 |
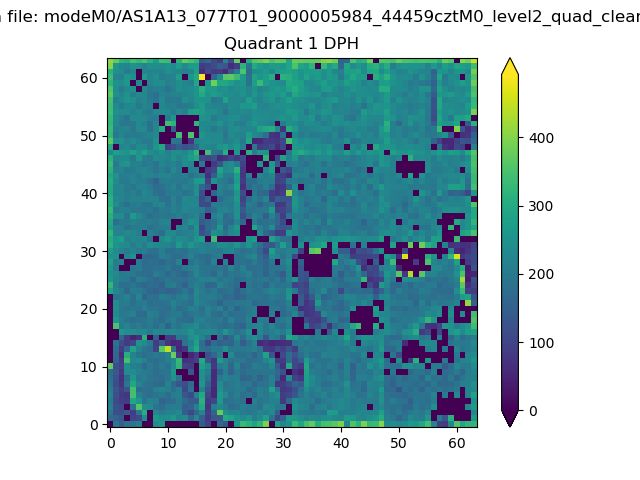 |
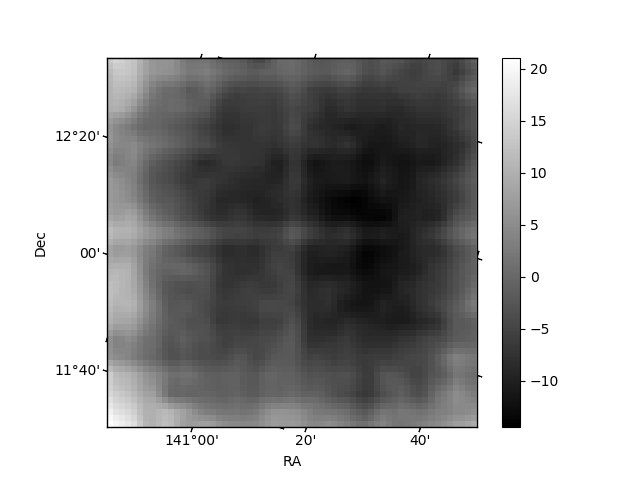
Quadrant B |
|---|---|---|---|
| Quadrant D | 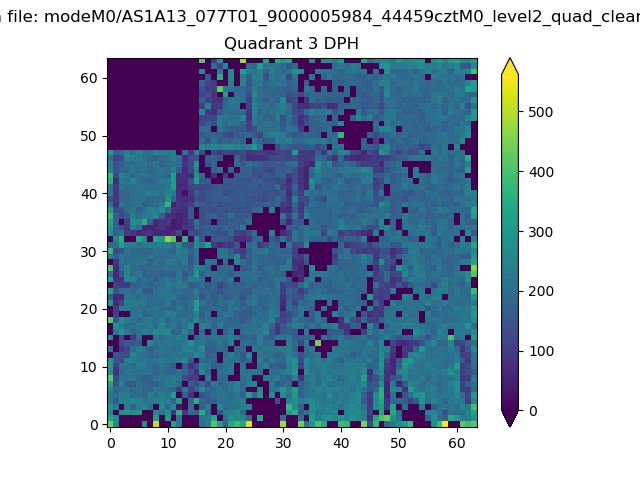 |
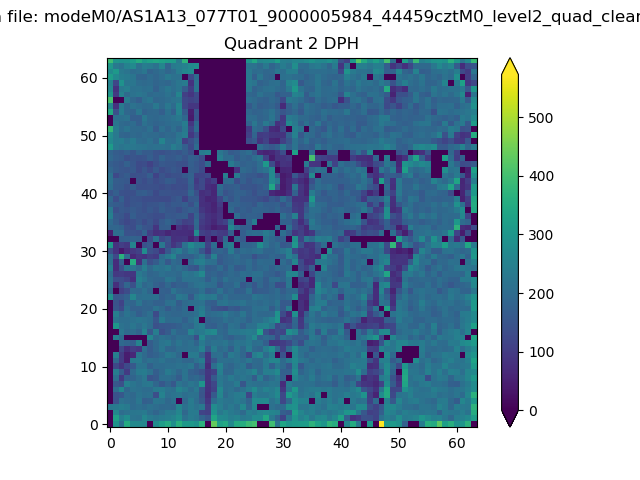 |
Quadrant C |
| Plot type | Count rate plots | Images |
|---|---|---|
| Comparison with Poisson distribution Blue bars denote a histogram of data divided into 1 sec bins. Red curve is a Poisson curve with rate = median count rate of data. |
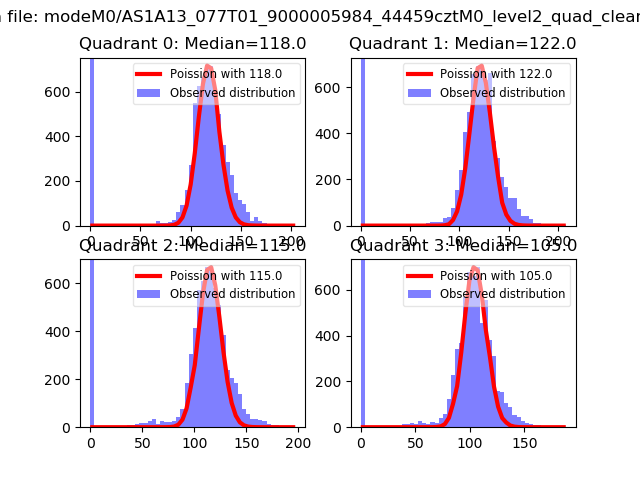 |
 |
| Quadrant-wise count rates Data is divided into 100 sec bins |
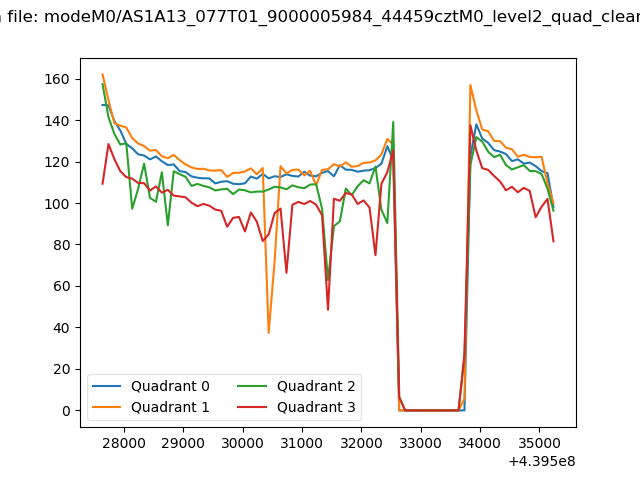 |
|
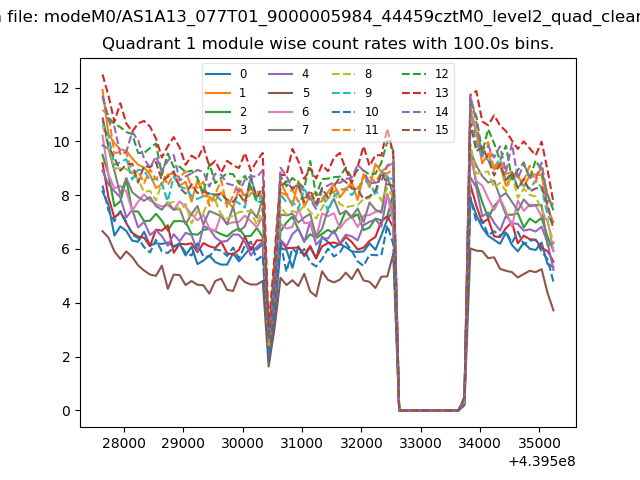
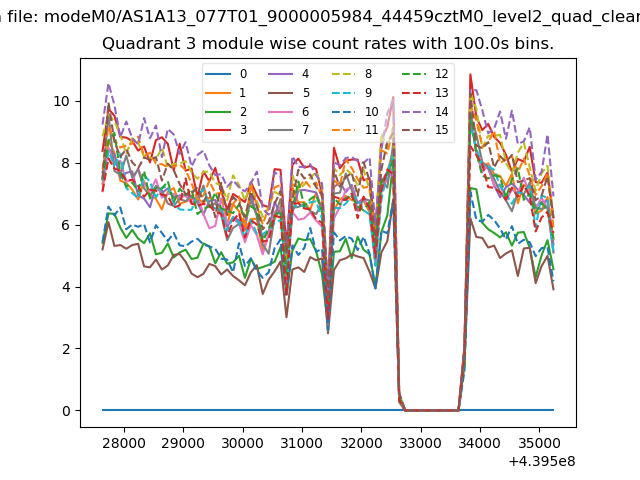
| Module-wise count rates for Quadrant A Data is divided into 100 sec bins |
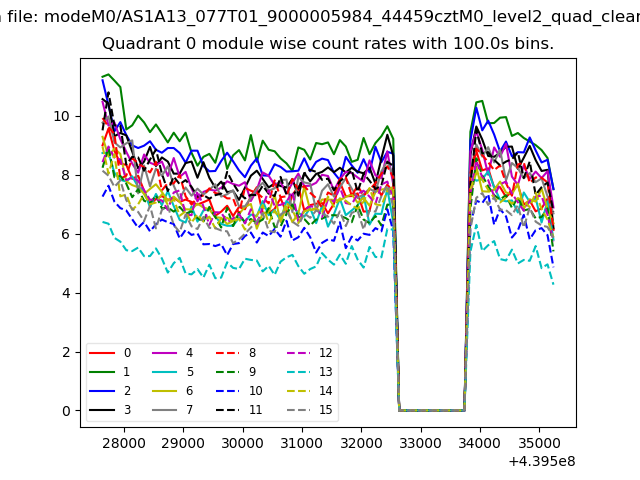 |
 |
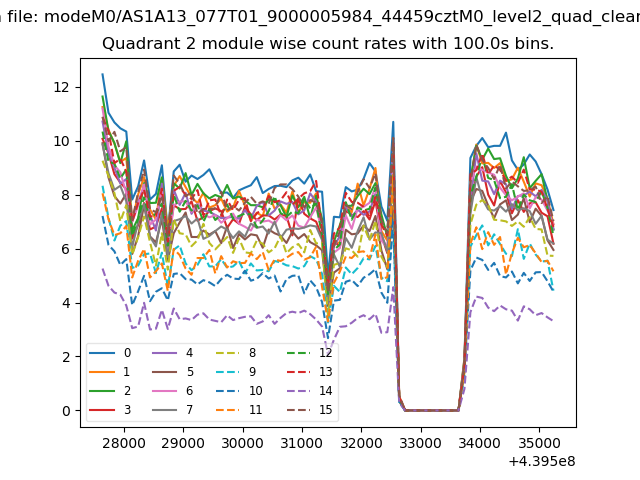
| Module-wise count rates for Quadrant B Data is divided into 100 sec bins |
 |
 |
| Module-wise count rates for Quadrant C Data is divided into 100 sec bins |
 |
 |
| Module-wise count rates for Quadrant D Data is divided into 100 sec bins |
 |
 |
| Parameter | Plot |
|---|---|
| CZT HV Monitor | 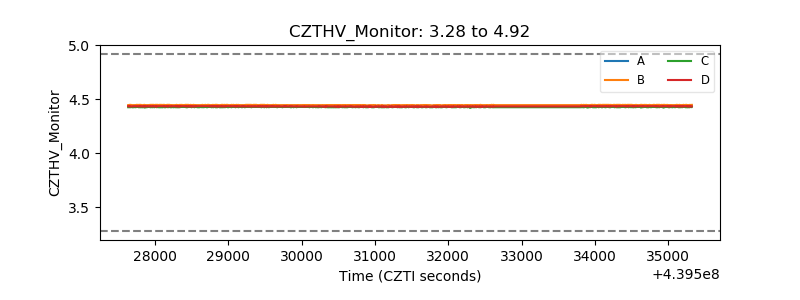 |
| D_VDD | 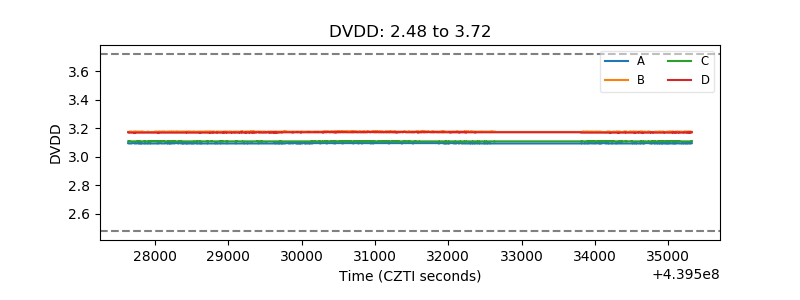 |
| Temperature 1 | 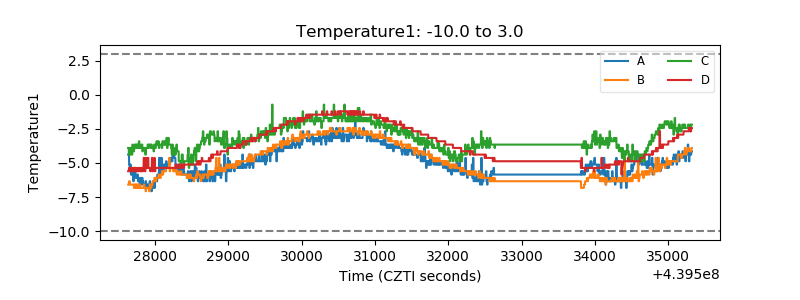 |
| Veto HV Monitor |  |
| Veto LLD | 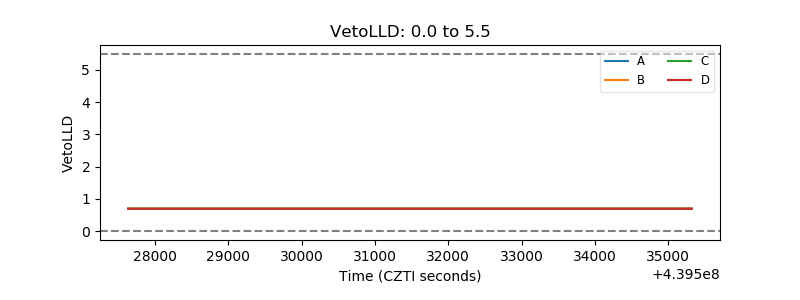 |
| Alpha Counter | 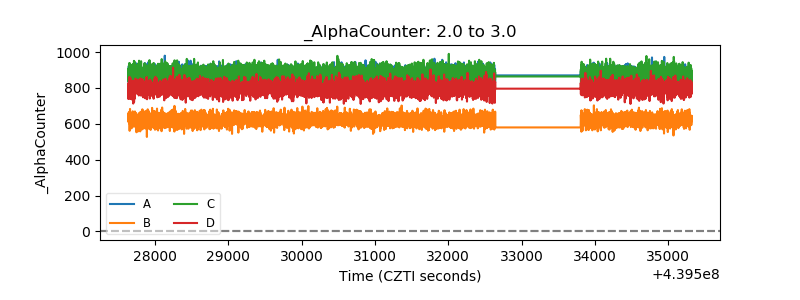 |
| _CPM_Rate | 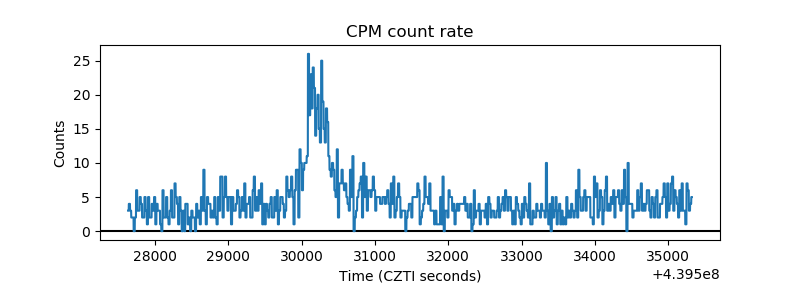 |
| CZT Counter | 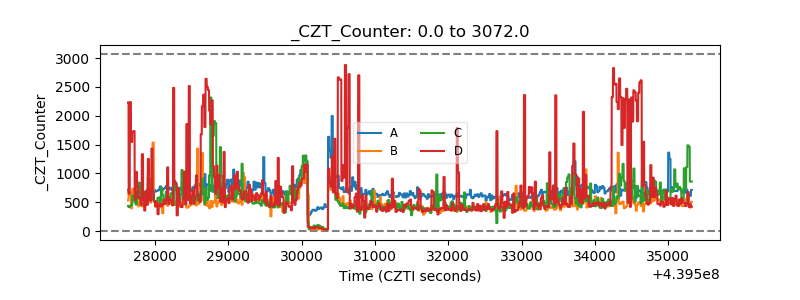 |
| +2.5 Volts monitor | 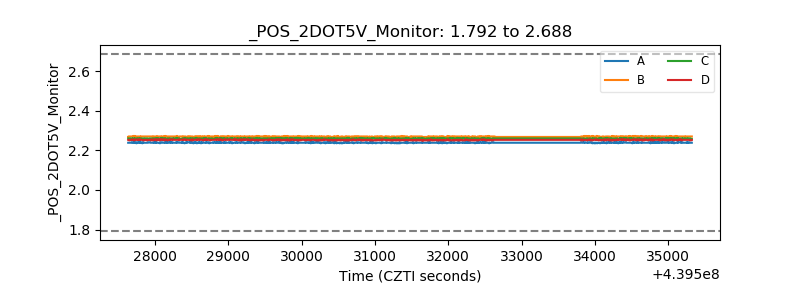 |
| +5 Volts monitor | 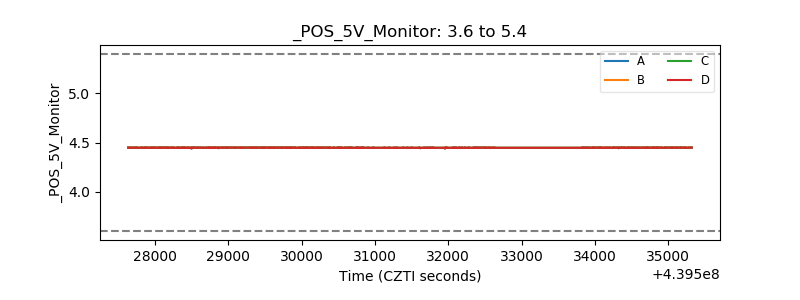 |
| _ROLL_ROT | 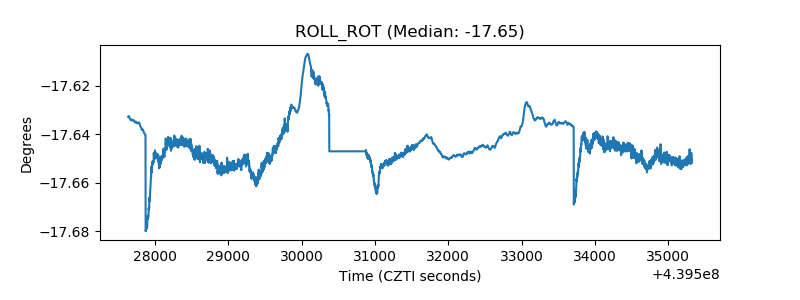 |
| _Roll_DEC | 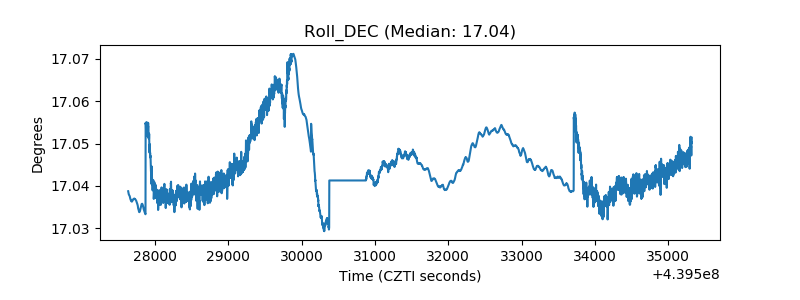 |
| _Roll_RA | 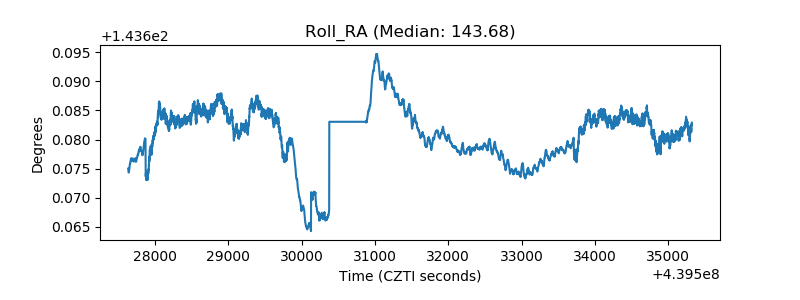 |
| Veto Counter | 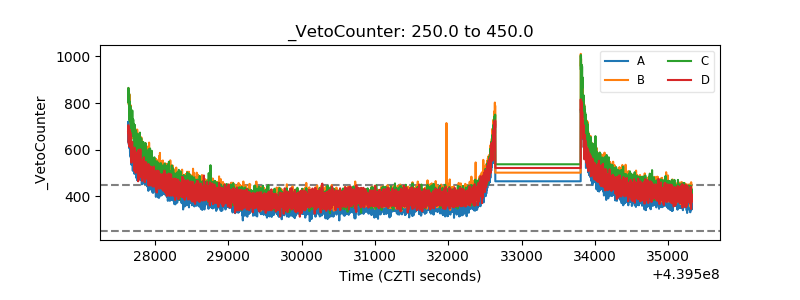 |