| Param | Original file | Final file |
|---|---|---|
| Filename | modeM0/AS1A13_077T01_9000005984_44460cztM0_level2.fits | modeM0/AS1A13_077T01_9000005984_44460cztM0_level2_quad_clean.evt |
| Size (bytes) | 416,836,800 | 99,711,360 |
| Size | 397.5 MB | 95.1 MB |
| Events in quadrant A | 4,176,897 | 673,703 |
| Events in quadrant B | 2,916,384 | 695,020 |
| Events in quadrant C | 4,027,389 | 645,711 |
| Events in quadrant D | 3,852,621 | 593,836 |
| Mode M0 | |||
|---|---|---|---|
| Quadrant | BADHDUFLAG | Total packets | Discarded packets |
| A | 0 | 17737 | 1 |
| B | 0 | 12652 | 1 |
| C | 0 | 15982 | 1 |
| D | 0 | 15408 | 1 |
| Mode M9 | |||
|---|---|---|---|
| Quadrant | BADHDUFLAG | Total packets | Discarded packets |
| A | 0 | 11 | 0 |
| B | 0 | 11 | 0 |
| C | 0 | 11 | 0 |
| D | 0 | 11 | 0 |
| Mode SS | |||
|---|---|---|---|
| Quadrant | BADHDUFLAG | Total packets | Discarded packets |
| A | 0 | 122 | 0 |
| B | 0 | 122 | 0 |
| C | 0 | 122 | 0 |
| D | 0 | 122 | 0 |
| Quadrant | Total seconds | Saturated seconds | Saturation percentage |
|---|---|---|---|
| A | 5875 | 107 | 1.821277% |
| B | 5876 | 102 | 1.735875% |
| C | 5876 | 239 | 4.067393% |
| D | 5876 | 208 | 3.539823% |
Noise dominated data is calculated using 1-second bins in cleaned event files. If a bin has >2000 counts, and if more than 50% of those come from <1% of pixels, then it is considered to be noise-dominated and hence unusable.
| Quadrant | # 1 sec bins | Bins with >0 counts | Bins with >2000 counts | High rate bins dominated by noise | Noise dominated (total time) | Noise dominated (detector-on time) | Marked lightcurve |
|---|---|---|---|---|---|---|---|
| A | 7015 | 5876 | 1 | 1 | 0.01% | 0.02% | 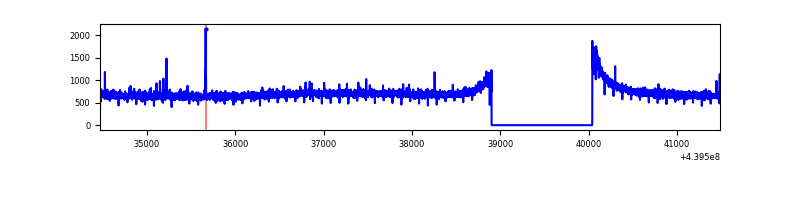 |
| B | 7016 | 5877 | 31 | 31 | 0.44% | 0.53% | 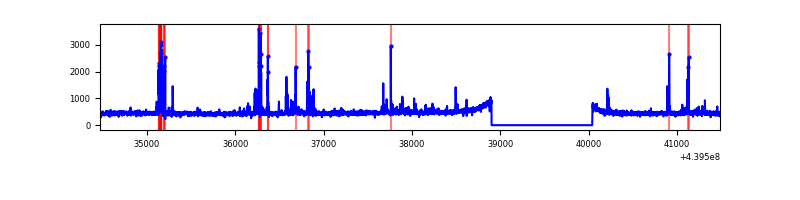 |
| C | 7016 | 5877 | 202 | 202 | 2.88% | 3.44% | 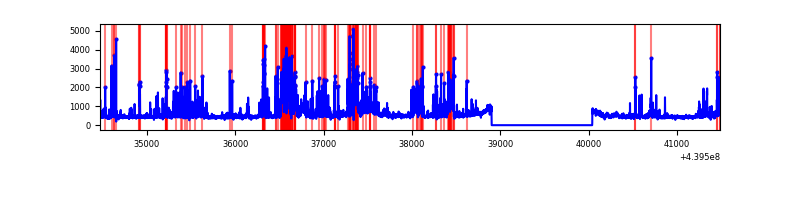 |
| D | 7016 | 5877 | 138 | 138 | 1.97% | 2.35% | 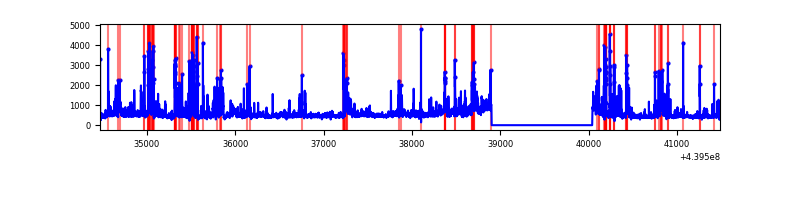 |
Top three noisy pixels from each quadrant. If the there are fewer than three noisy pixels in the level2.evt file, extra rows are filled as -1
| Pixel properties | Quadrant properties | ||||||
|---|---|---|---|---|---|---|---|
| Quadrant | DetID | PixID | Counts | Sigma | Mean | Median | Sigma |
| A | 10 | 83 | 1507717 | 10628.32 | 685 | 672 | 141.8 |
| A | 7 | 3 | 12543 | 83.72 | 685 | 672 | 141.8 |
| A | 3 | 137 | 7507 | 48.2 | 685 | 672 | 141.8 |
| B | 5 | 172 | 164512 | 1228.45 | 677 | 658 | 133.4 |
| B | 0 | 229 | 58696 | 435.12 | 677 | 658 | 133.4 |
| B | 12 | 111 | 16494 | 118.73 | 677 | 658 | 133.4 |
| C | 12 | 16 | 1049417 | 6729.8 | 660 | 664 | 155.8 |
| C | 14 | 254 | 329697 | 2111.39 | 660 | 664 | 155.8 |
| C | 3 | 233 | 41545 | 262.33 | 660 | 664 | 155.8 |
| D | 5 | 235 | 342612 | 2044.39 | 663 | 641 | 167.3 |
| D | 1 | 52 | 273297 | 1630.01 | 663 | 641 | 167.3 |
| D | 13 | 249 | 257445 | 1535.24 | 663 | 641 | 167.3 |
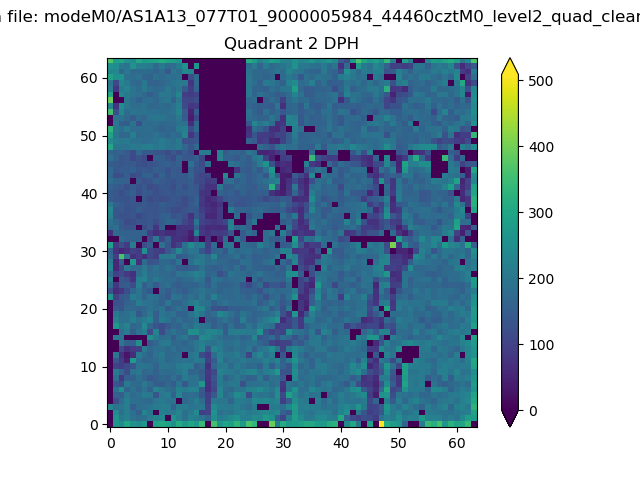
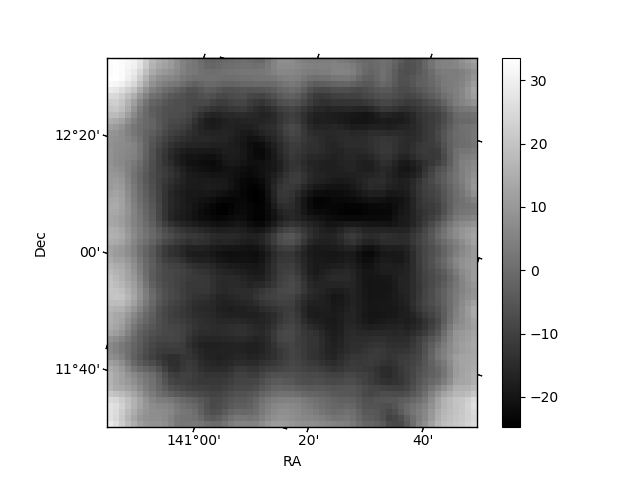
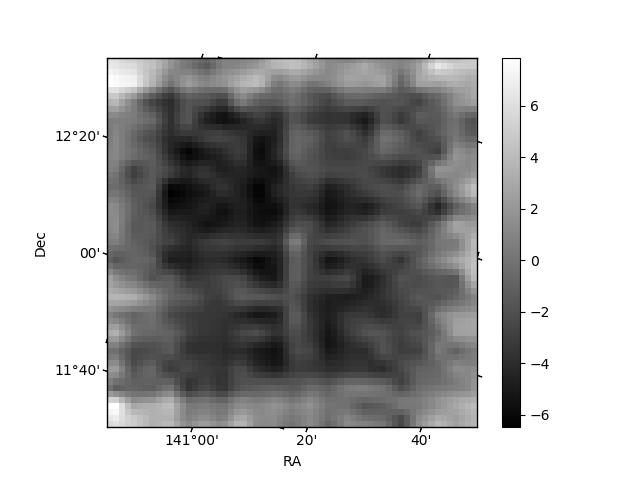
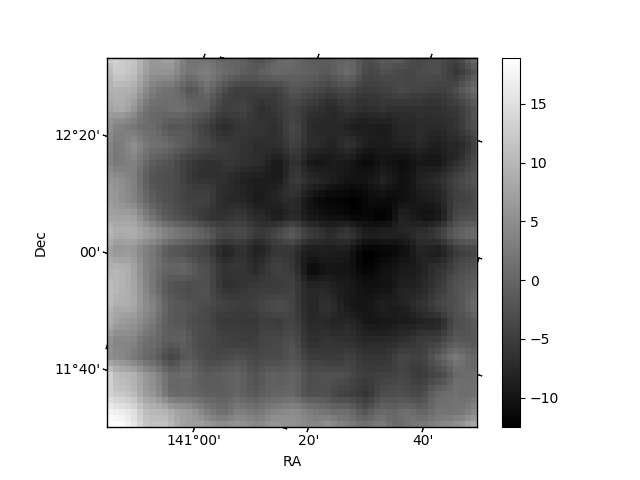
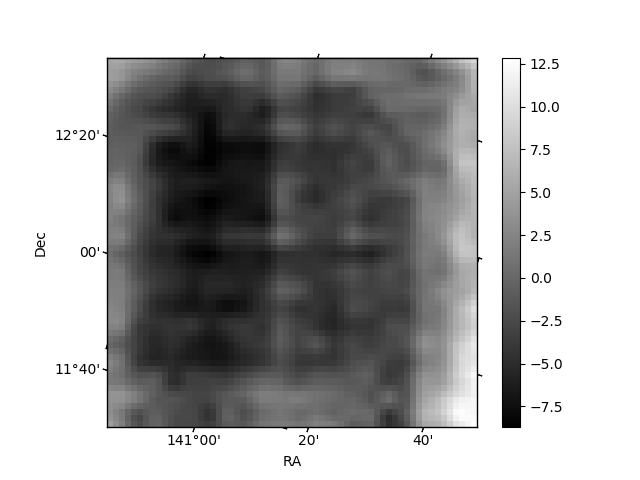
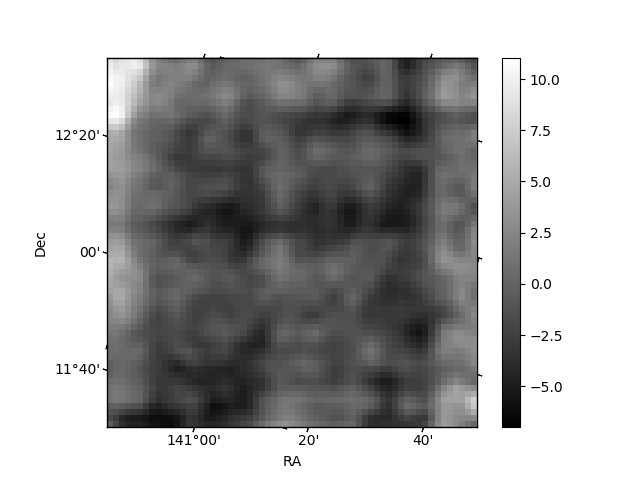
Histogram calculated using DETX and DETY for each event in the final _common_clean file
| Quadrant A | 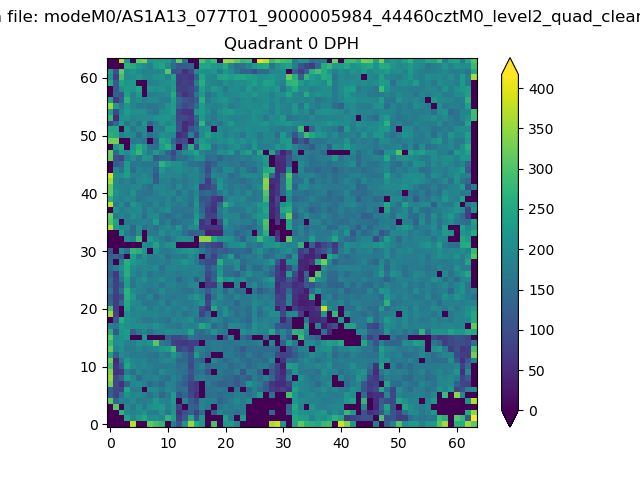 |
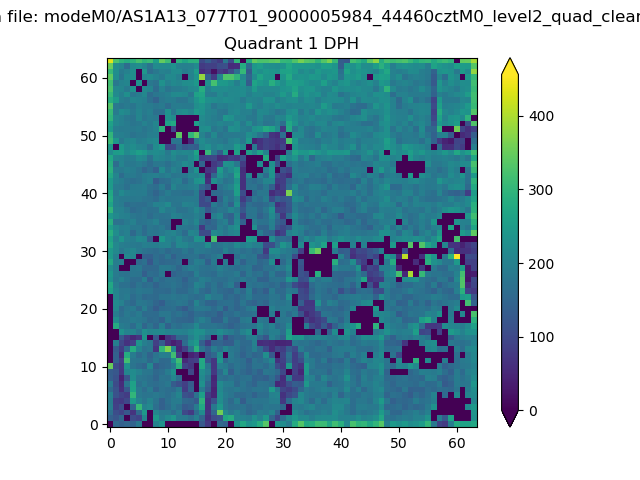 |
Quadrant B |
|---|---|---|---|
| Quadrant D | 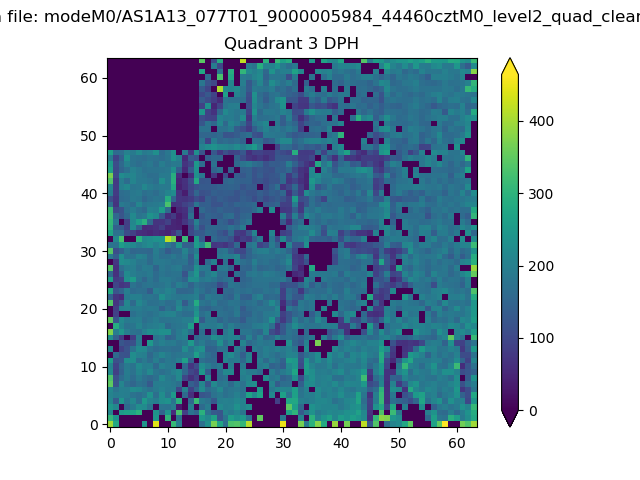 |
 |
Quadrant C |
| Plot type | Count rate plots | Images |
|---|---|---|
| Comparison with Poisson distribution Blue bars denote a histogram of data divided into 1 sec bins. Red curve is a Poisson curve with rate = median count rate of data. |
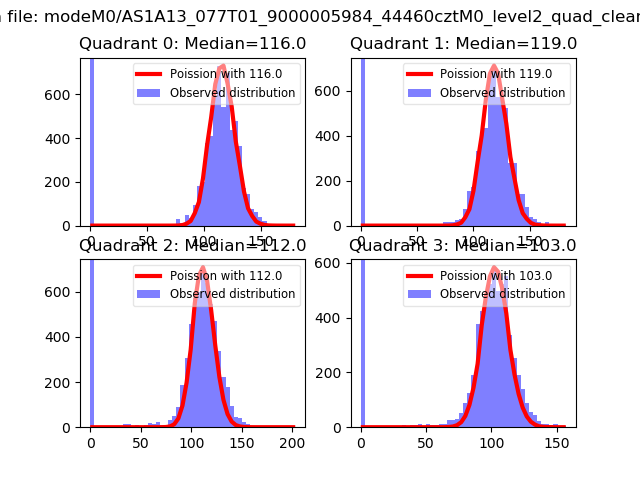 |
 |
| Quadrant-wise count rates Data is divided into 100 sec bins |
 |
|
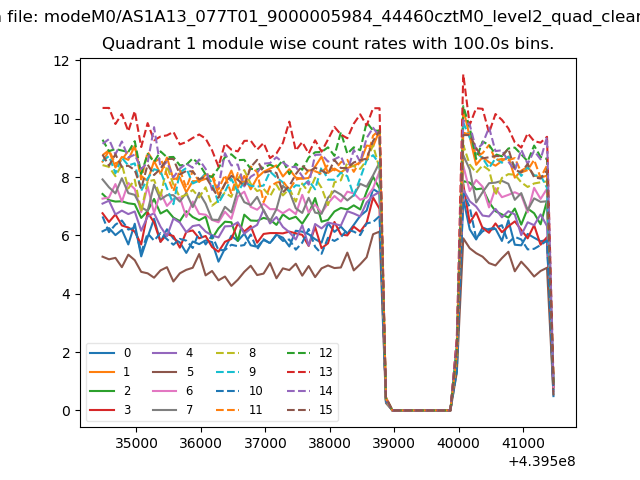
| Module-wise count rates for Quadrant A Data is divided into 100 sec bins |
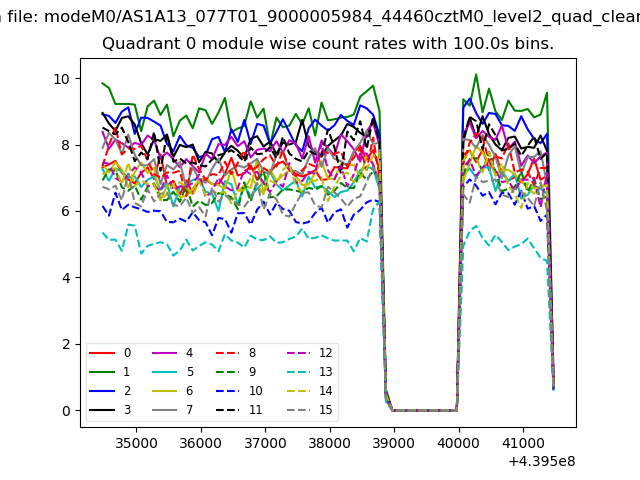 |
 |
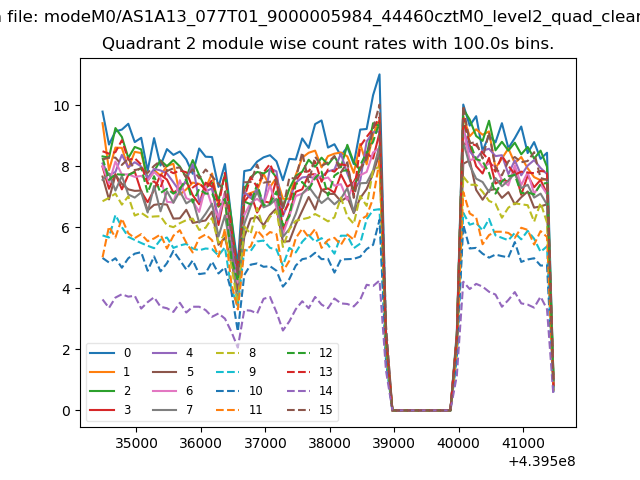
| Module-wise count rates for Quadrant B Data is divided into 100 sec bins |
 |
 |
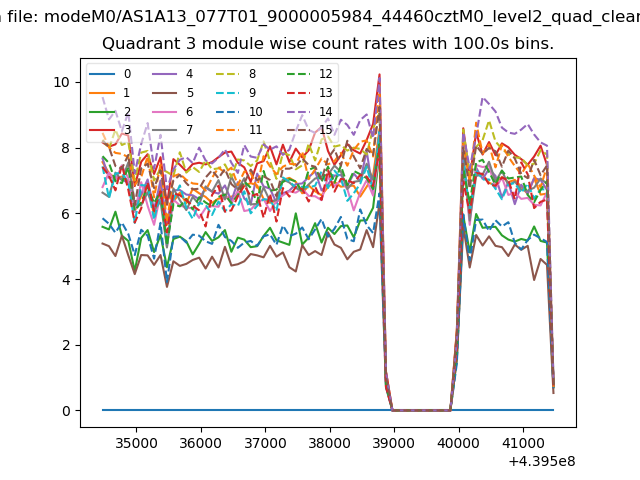
| Module-wise count rates for Quadrant C Data is divided into 100 sec bins |
 |
 |
| Module-wise count rates for Quadrant D Data is divided into 100 sec bins |
 |
 |
| Parameter | Plot |
|---|---|
| CZT HV Monitor | 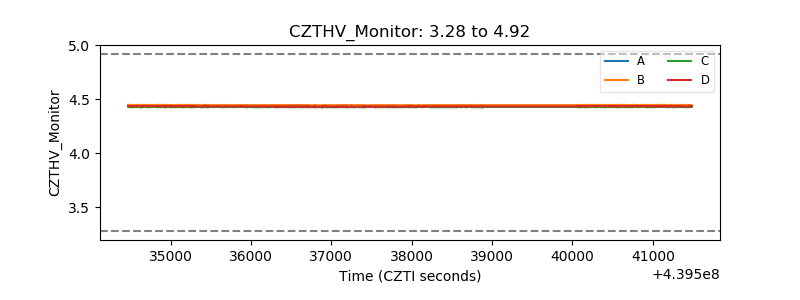 |
| D_VDD | 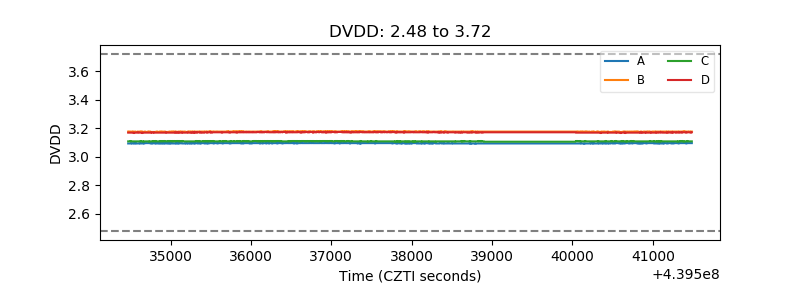 |
| Temperature 1 | 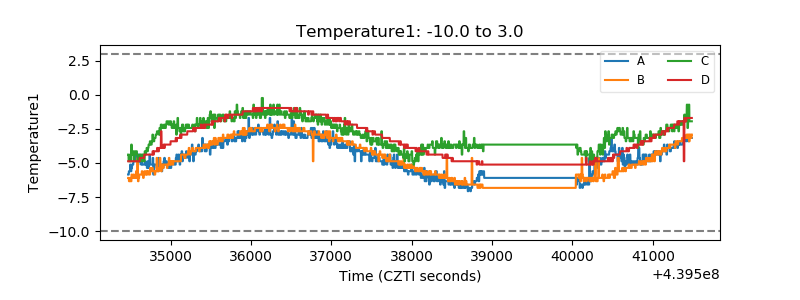 |
| Veto HV Monitor | 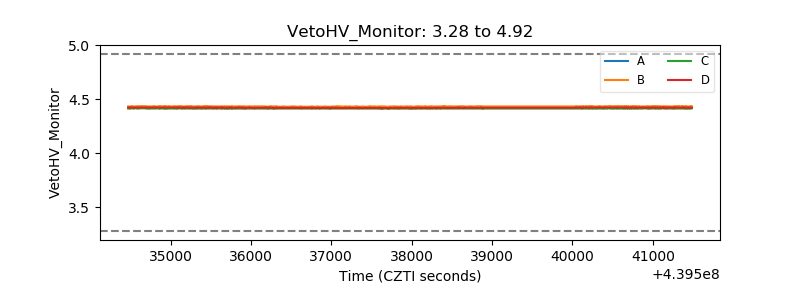 |
| Veto LLD | 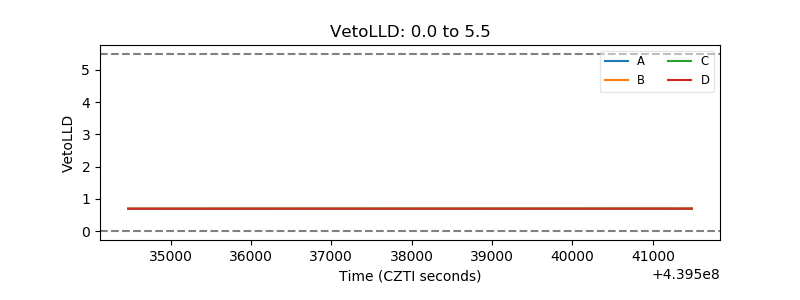 |
| Alpha Counter | 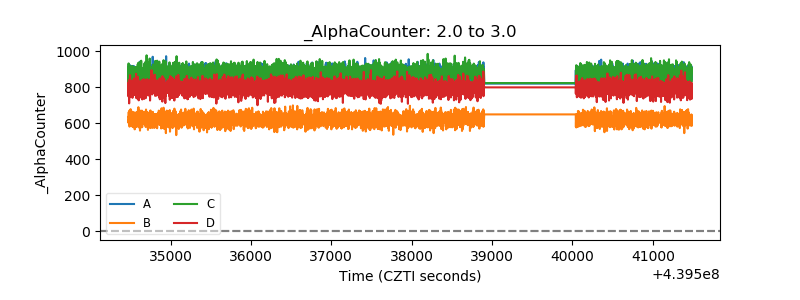 |
| _CPM_Rate | 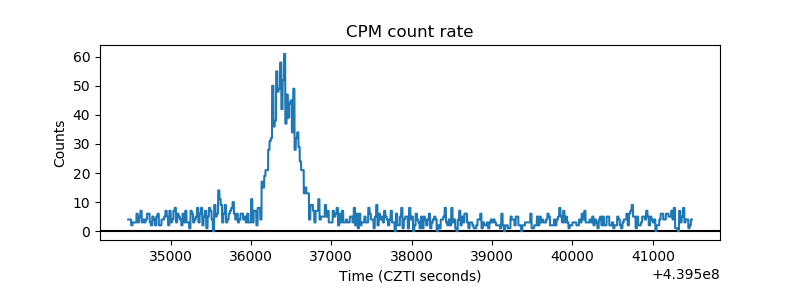 |
| CZT Counter | 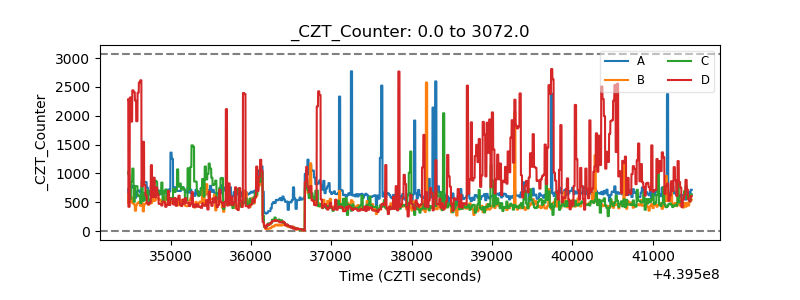 |
| +2.5 Volts monitor | 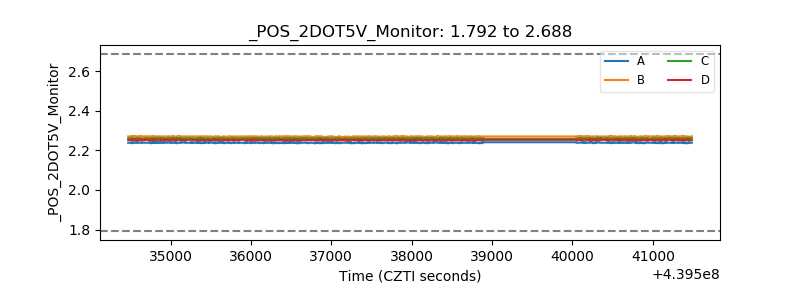 |
| +5 Volts monitor | 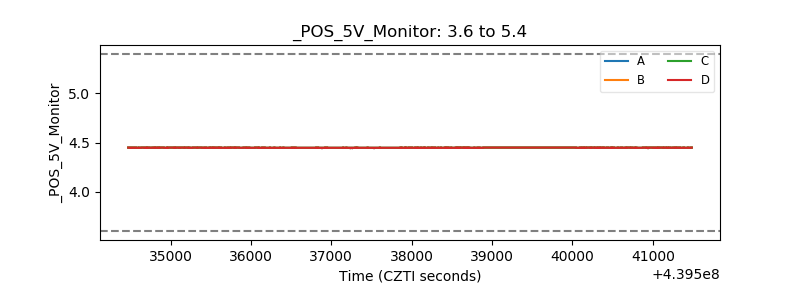 |
| _ROLL_ROT | 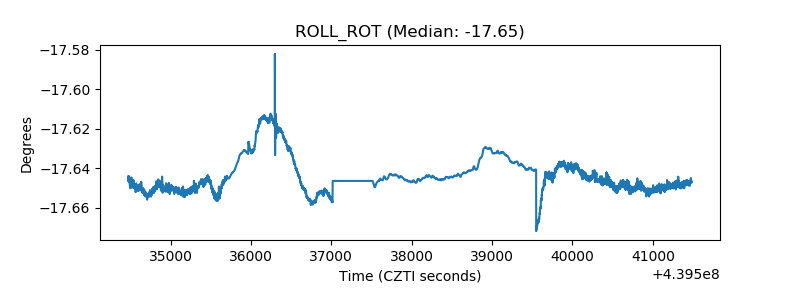 |
| _Roll_DEC | 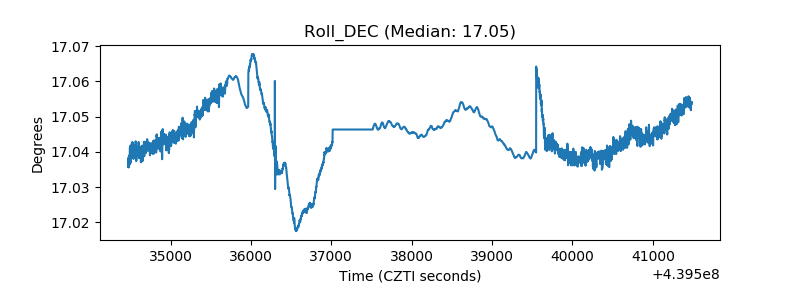 |
| _Roll_RA | 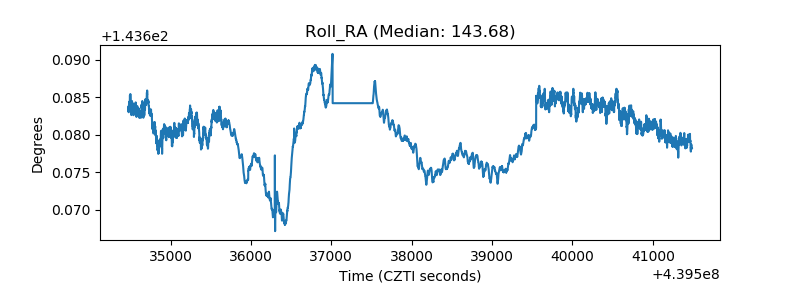 |
| Veto Counter | 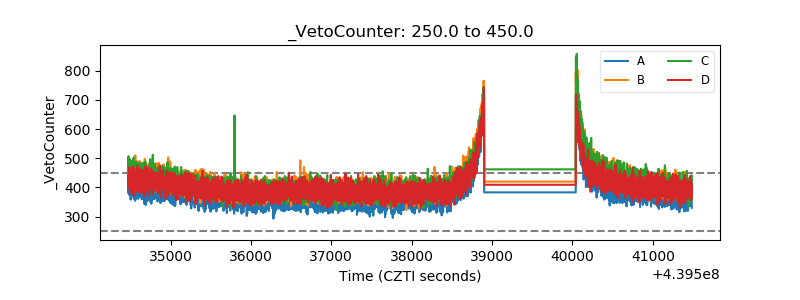 |