| Param | Original file | Final file |
|---|---|---|
| Filename | modeM0/AS1A13_077T01_9000005984_44462cztM0_level2.fits | modeM0/AS1A13_077T01_9000005984_44462cztM0_level2_quad_clean.evt |
| Size (bytes) | 457,254,720 | 113,892,480 |
| Size | 436.1 MB | 108.6 MB |
| Events in quadrant A | 5,055,211 | 758,602 |
| Events in quadrant B | 3,467,478 | 784,414 |
| Events in quadrant C | 3,385,046 | 744,671 |
| Events in quadrant D | 4,465,997 | 666,150 |
| Mode M0 | |||
|---|---|---|---|
| Quadrant | BADHDUFLAG | Total packets | Discarded packets |
| A | 0 | 21445 | 2 |
| B | 0 | 15167 | 2 |
| C | 0 | 15118 | 2 |
| D | 0 | 18117 | 2 |
| Mode M9 | |||
|---|---|---|---|
| Quadrant | BADHDUFLAG | Total packets | Discarded packets |
| A | 0 | 7 | 0 |
| B | 0 | 8 | 0 |
| C | 0 | 8 | 0 |
| D | 0 | 8 | 0 |
| Mode SS | |||
|---|---|---|---|
| Quadrant | BADHDUFLAG | Total packets | Discarded packets |
| A | 0 | 144 | 0 |
| B | 0 | 144 | 0 |
| C | 0 | 144 | 0 |
| D | 0 | 144 | 0 |
| Quadrant | Total seconds | Saturated seconds | Saturation percentage |
|---|---|---|---|
| A | 7106 | 277 | 3.898114% |
| B | 7106 | 200 | 2.814523% |
| C | 7106 | 164 | 2.307909% |
| D | 7106 | 378 | 5.319448% |
Noise dominated data is calculated using 1-second bins in cleaned event files. If a bin has >2000 counts, and if more than 50% of those come from <1% of pixels, then it is considered to be noise-dominated and hence unusable.
| Quadrant | # 1 sec bins | Bins with >0 counts | Bins with >2000 counts | High rate bins dominated by noise | Noise dominated (total time) | Noise dominated (detector-on time) | Marked lightcurve |
|---|---|---|---|---|---|---|---|
| A | 7736 | 7107 | 1 | 1 | 0.01% | 0.01% | 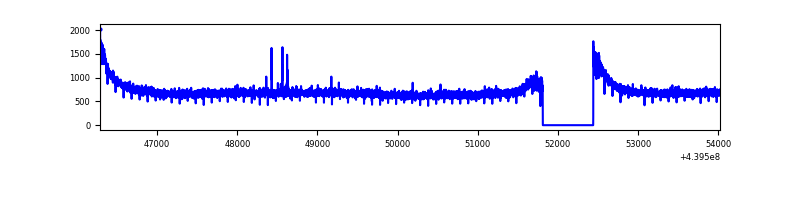 |
| B | 7736 | 7106 | 18 | 18 | 0.23% | 0.25% | 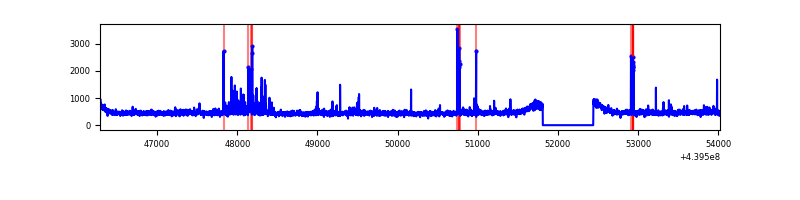 |
| C | 7736 | 7107 | 11 | 11 | 0.14% | 0.15% | 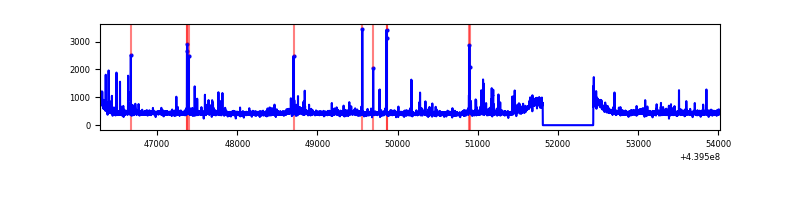 |
| D | 7736 | 7106 | 191 | 191 | 2.47% | 2.69% |  |
Top three noisy pixels from each quadrant. If the there are fewer than three noisy pixels in the level2.evt file, extra rows are filled as -1
| Pixel properties | Quadrant properties | ||||||
|---|---|---|---|---|---|---|---|
| Quadrant | DetID | PixID | Counts | Sigma | Mean | Median | Sigma |
| A | 10 | 83 | 1879737 | 11066.46 | 815 | 797 | 169.8 |
| A | 8 | 4 | 15766 | 88.16 | 815 | 797 | 169.8 |
| A | 0 | 243 | 13377 | 74.09 | 815 | 797 | 169.8 |
| B | 0 | 229 | 103489 | 639.24 | 810 | 785 | 160.7 |
| B | 5 | 172 | 69248 | 426.12 | 810 | 785 | 160.7 |
| B | 7 | 221 | 28621 | 173.26 | 810 | 785 | 160.7 |
| C | 14 | 254 | 177438 | 937.43 | 801 | 803 | 188.4 |
| C | 3 | 233 | 35570 | 184.51 | 801 | 803 | 188.4 |
| C | 12 | 16 | 25051 | 128.69 | 801 | 803 | 188.4 |
| D | 1 | 52 | 581027 | 2882.85 | 791 | 762 | 201.3 |
| D | 2 | 249 | 318223 | 1577.2 | 791 | 762 | 201.3 |
| D | 12 | 17 | 100068 | 493.37 | 791 | 762 | 201.3 |
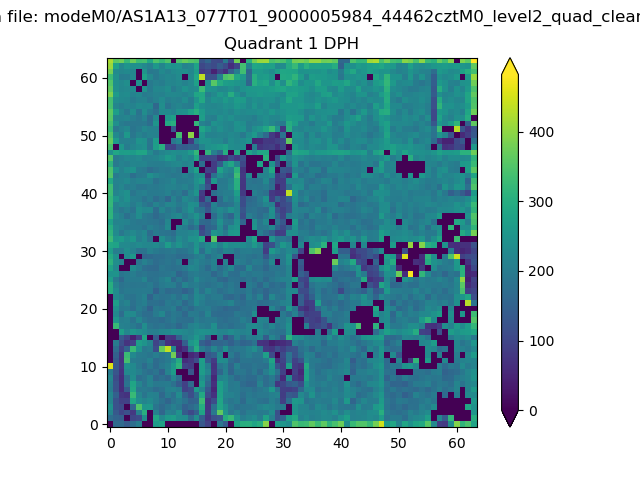
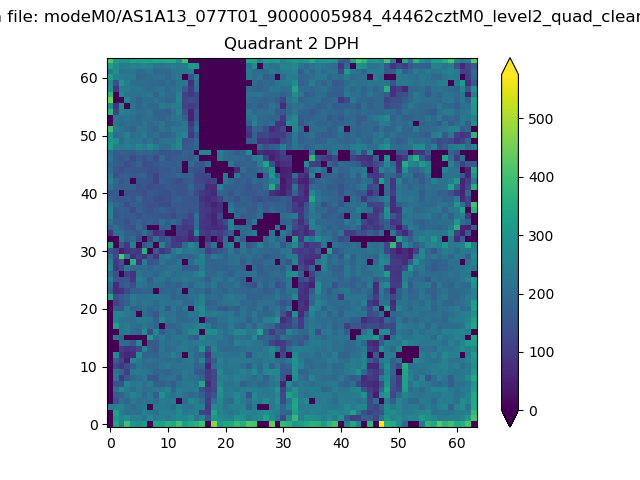
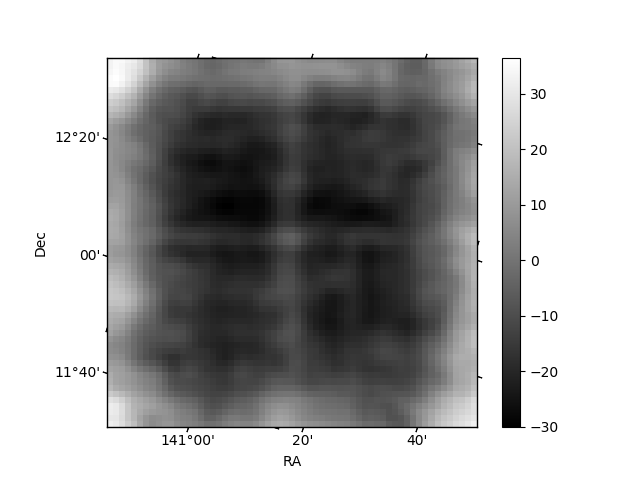
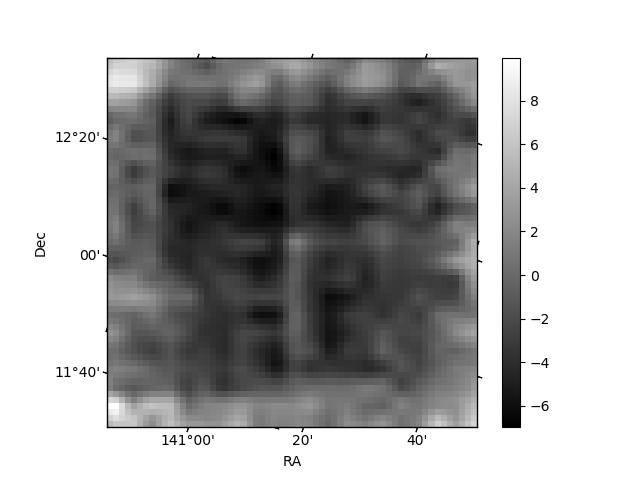
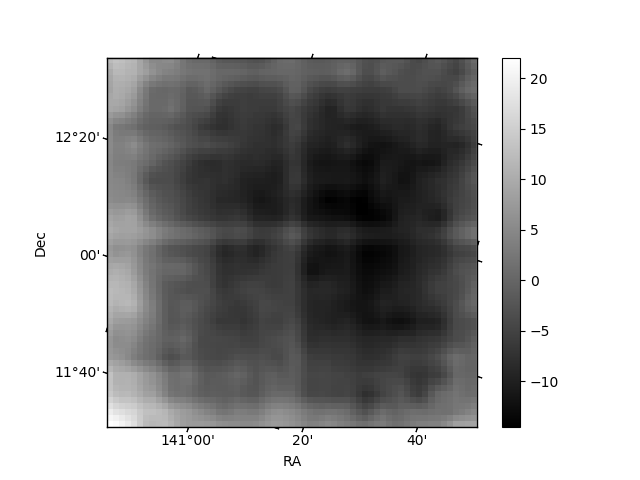
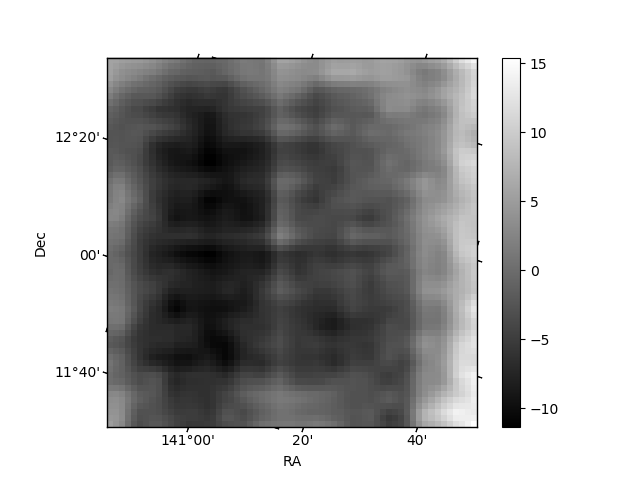
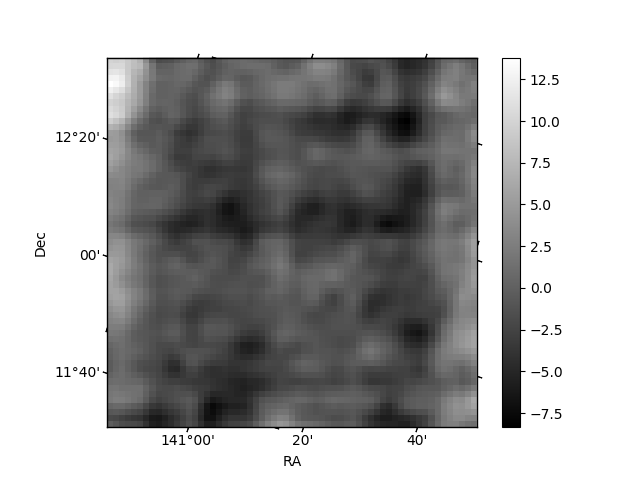
Histogram calculated using DETX and DETY for each event in the final _common_clean file
| Quadrant A | 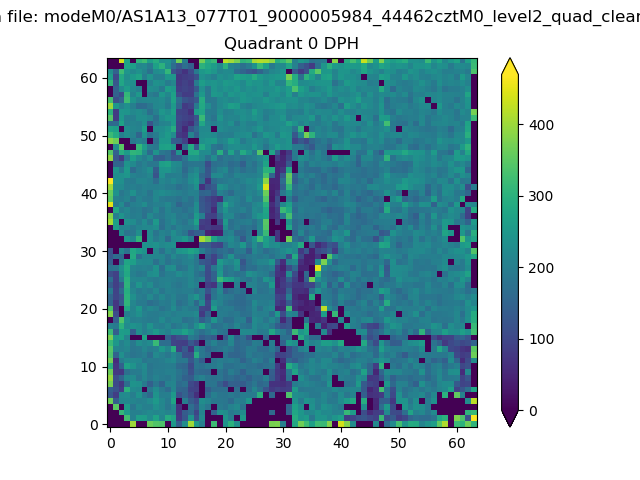 |
 |
Quadrant B |
|---|---|---|---|
| Quadrant D | 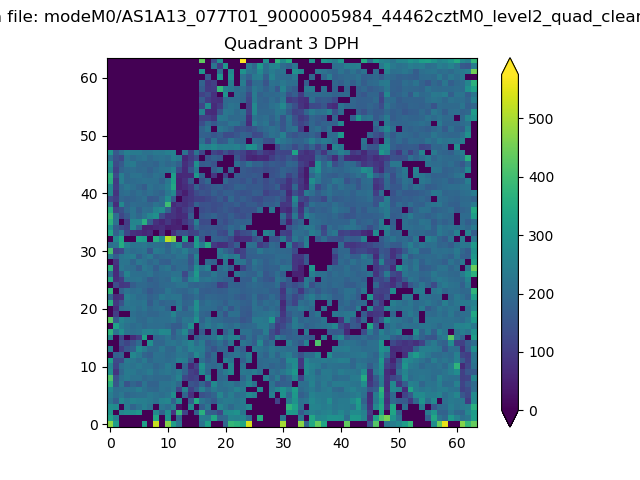 |
 |
Quadrant C |
| Plot type | Count rate plots | Images |
|---|---|---|
| Comparison with Poisson distribution Blue bars denote a histogram of data divided into 1 sec bins. Red curve is a Poisson curve with rate = median count rate of data. |
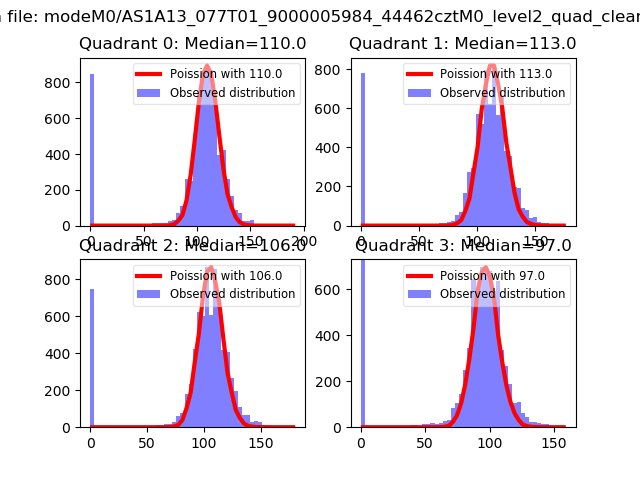 |
 |
| Quadrant-wise count rates Data is divided into 100 sec bins |
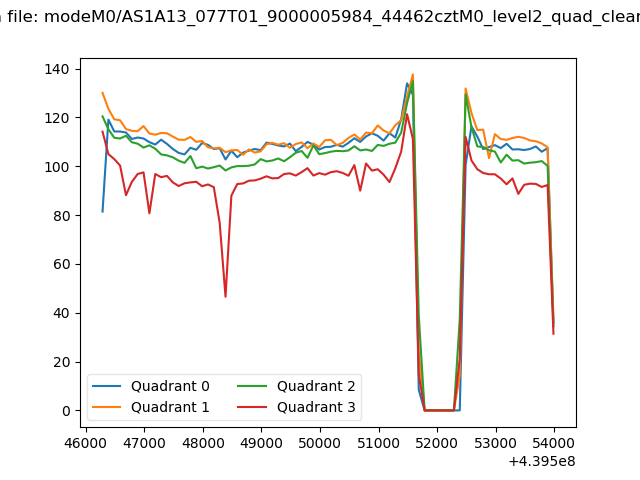 |
|
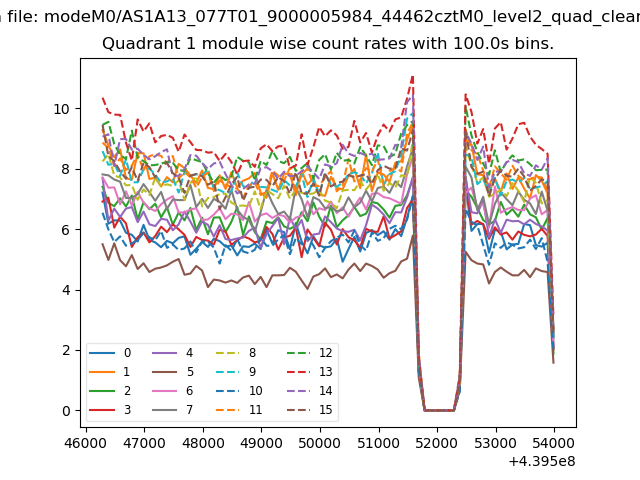
| Module-wise count rates for Quadrant A Data is divided into 100 sec bins |
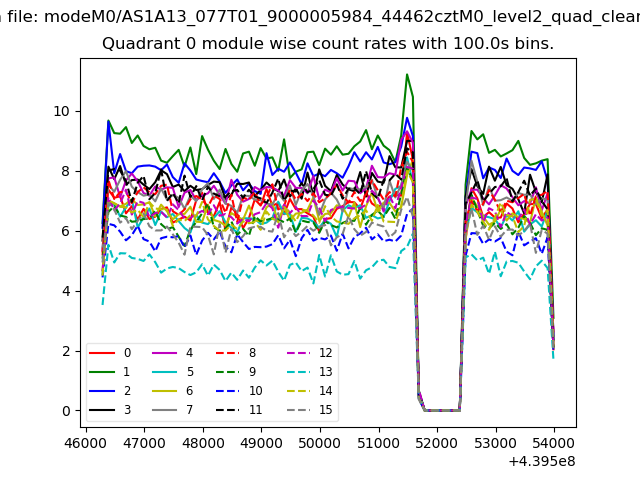 |
 |
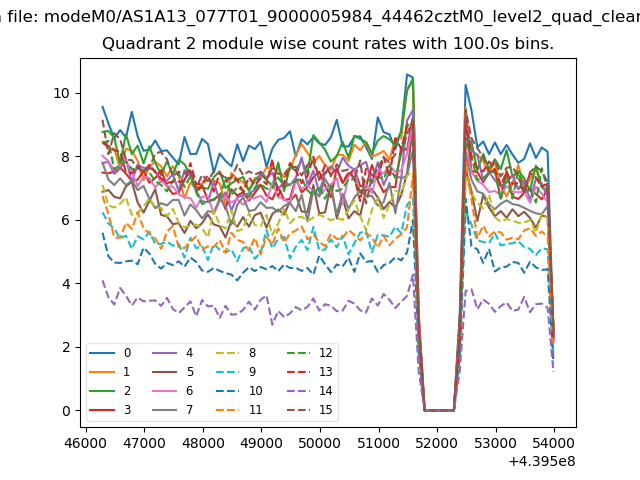
| Module-wise count rates for Quadrant B Data is divided into 100 sec bins |
 |
 |
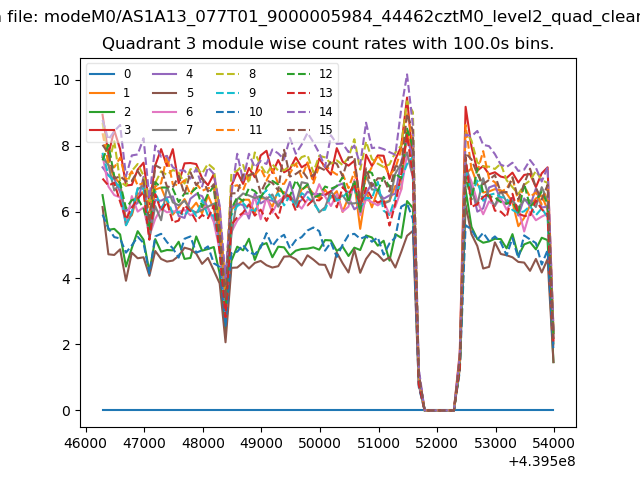
| Module-wise count rates for Quadrant C Data is divided into 100 sec bins |
 |
 |
| Module-wise count rates for Quadrant D Data is divided into 100 sec bins |
 |
 |
| Parameter | Plot |
|---|---|
| CZT HV Monitor | 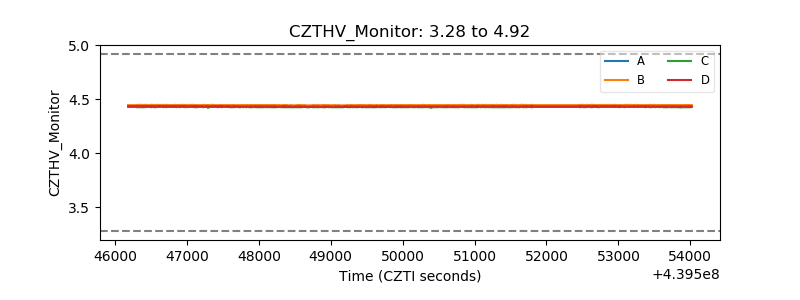 |
| D_VDD | 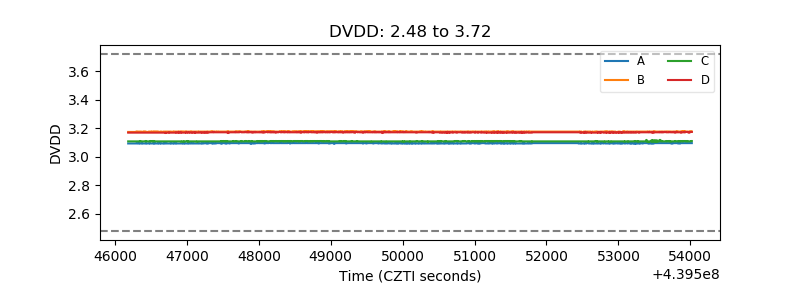 |
| Temperature 1 | 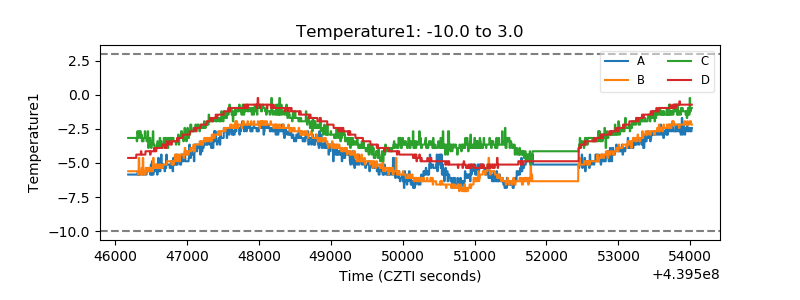 |
| Veto HV Monitor | 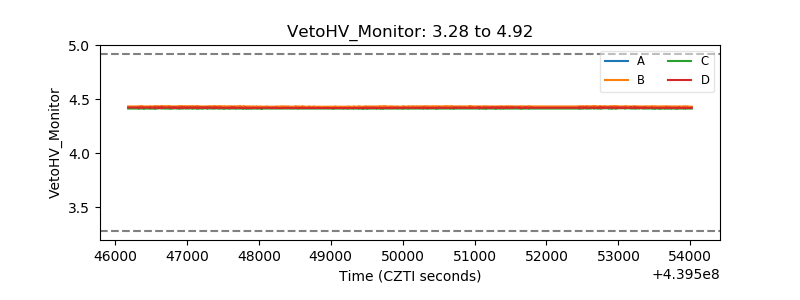 |
| Veto LLD | 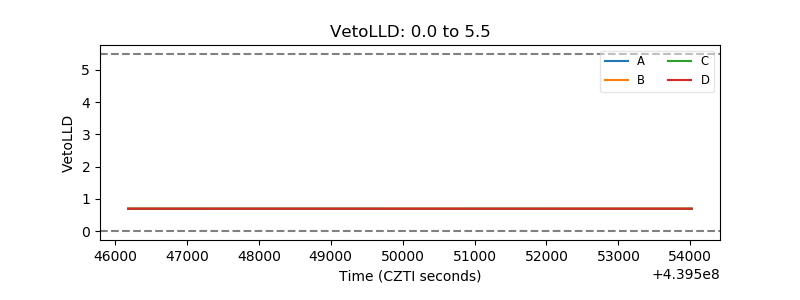 |
| Alpha Counter | 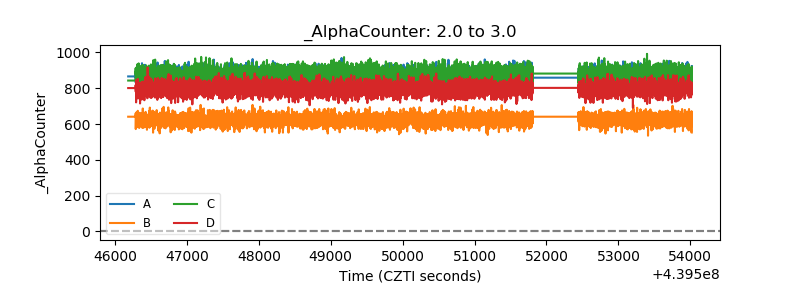 |
| _CPM_Rate | 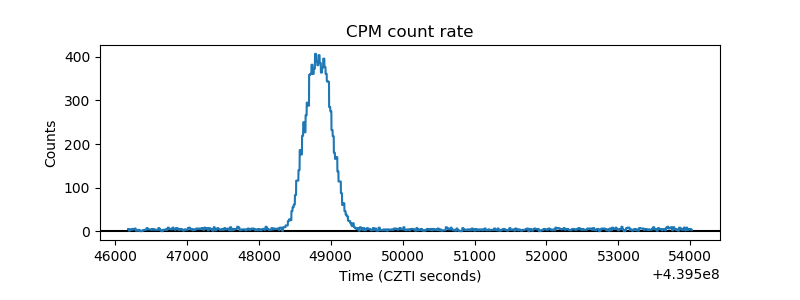 |
| CZT Counter | 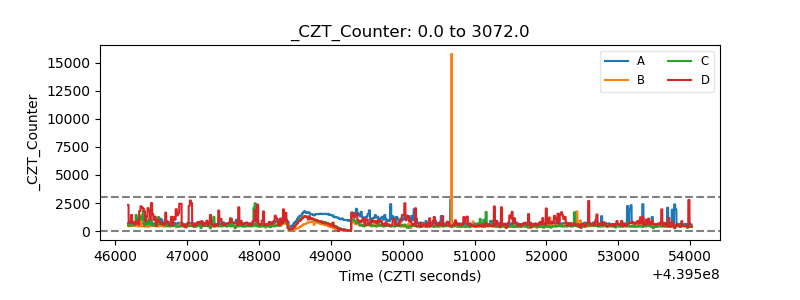 |
| +2.5 Volts monitor | 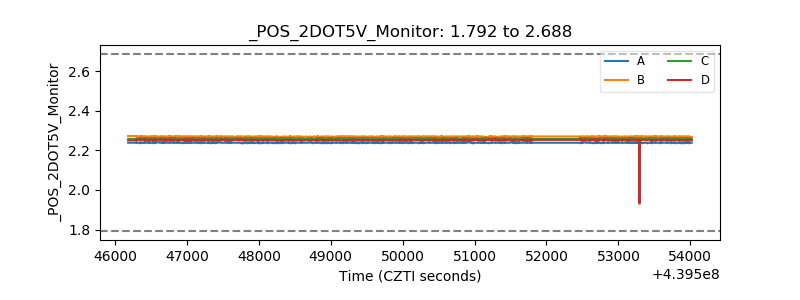 |
| +5 Volts monitor | 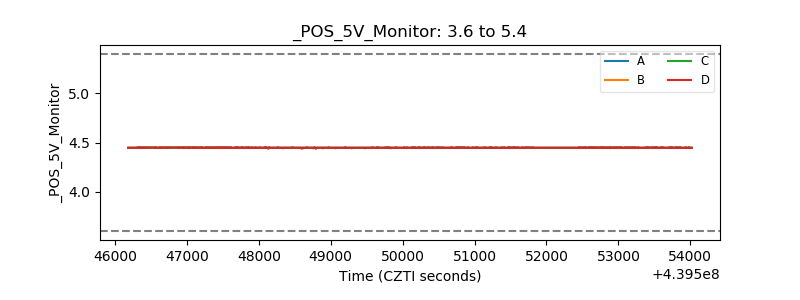 |
| _ROLL_ROT |  |
| _Roll_DEC | 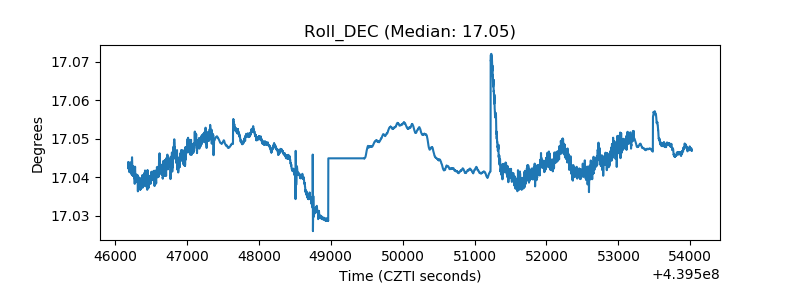 |
| _Roll_RA | 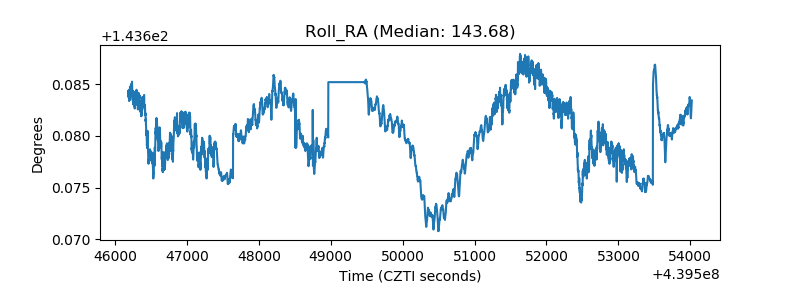 |
| Veto Counter |  |