| Param | Original file | Final file |
|---|---|---|
| Filename | modeM0/AS1A13_077T01_9000005984_44464cztM0_level2.fits | modeM0/AS1A13_077T01_9000005984_44464cztM0_level2_quad_clean.evt |
| Size (bytes) | 586,025,280 | 127,244,160 |
| Size | 558.9 MB | 121.3 MB |
| Events in quadrant A | 5,640,218 | 859,081 |
| Events in quadrant B | 3,904,644 | 880,980 |
| Events in quadrant C | 4,394,831 | 833,957 |
| Events in quadrant D | 7,127,812 | 718,599 |
| Mode M0 | |||
|---|---|---|---|
| Quadrant | BADHDUFLAG | Total packets | Discarded packets |
| A | 0 | 23632 | 3 |
| B | 0 | 17304 | 1 |
| C | 0 | 18433 | 1 |
| D | 0 | 26824 | 1 |
| Mode M9 | |||
|---|---|---|---|
| Quadrant | BADHDUFLAG | Total packets | Discarded packets |
| A | 1 | 140495276259368 | 140492675219502 |
| B | 1 | -1 | -1 |
| C | 1 | -1 | -1 |
| D | 1 | -1 | -1 |
| Mode SS | |||
|---|---|---|---|
| Quadrant | BADHDUFLAG | Total packets | Discarded packets |
| A | 0 | 162 | 0 |
| B | 0 | 162 | 0 |
| C | 0 | 162 | 0 |
| D | 0 | 162 | 0 |
| Quadrant | Total seconds | Saturated seconds | Saturation percentage |
|---|---|---|---|
| A | 8061 | 121 | 1.501054% |
| B | 8061 | 115 | 1.426622% |
| C | 8061 | 97 | 1.203325% |
| D | 8061 | 821 | 10.184841% |
Noise dominated data is calculated using 1-second bins in cleaned event files. If a bin has >2000 counts, and if more than 50% of those come from <1% of pixels, then it is considered to be noise-dominated and hence unusable.
| Quadrant | # 1 sec bins | Bins with >0 counts | Bins with >2000 counts | High rate bins dominated by noise | Noise dominated (total time) | Noise dominated (detector-on time) | Marked lightcurve |
|---|---|---|---|---|---|---|---|
| A | 8061 | 8061 | 4 | 4 | 0.05% | 0.05% | 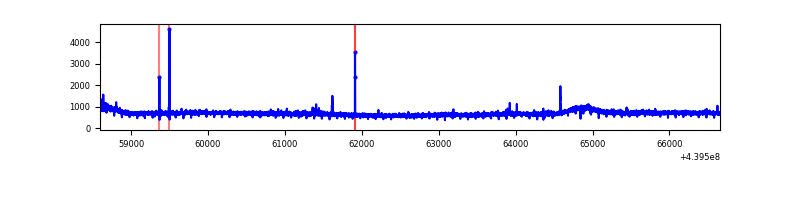 |
| B | 8061 | 8061 | 10 | 10 | 0.12% | 0.12% | 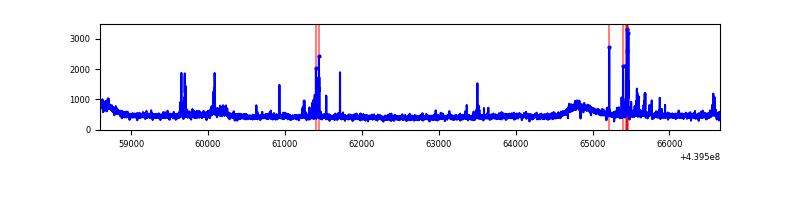 |
| C | 8061 | 8061 | 36 | 36 | 0.45% | 0.45% | 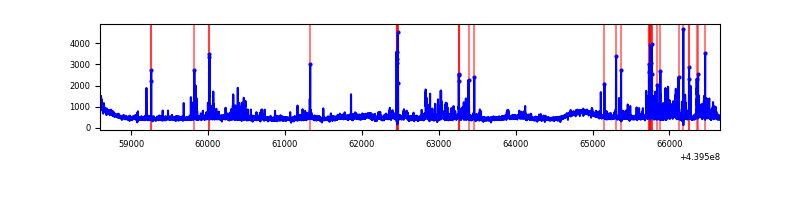 |
| D | 8061 | 8061 | 717 | 717 | 8.89% | 8.89% | 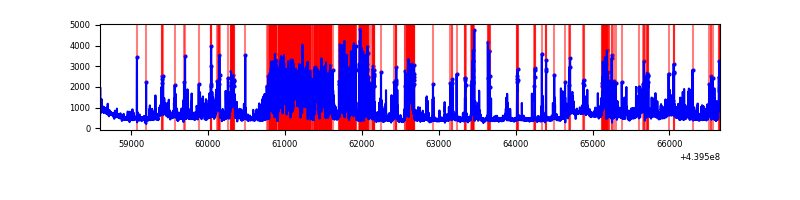 |
Top three noisy pixels from each quadrant. If the there are fewer than three noisy pixels in the level2.evt file, extra rows are filled as -1
| Pixel properties | Quadrant properties | ||||||
|---|---|---|---|---|---|---|---|
| Quadrant | DetID | PixID | Counts | Sigma | Mean | Median | Sigma |
| A | 10 | 83 | 1986748 | 10116.27 | 932 | 909 | 196.3 |
| A | 0 | 243 | 16997 | 81.96 | 932 | 909 | 196.3 |
| A | 15 | 174 | 15104 | 72.31 | 932 | 909 | 196.3 |
| B | 5 | 172 | 86469 | 463.88 | 923 | 894 | 184.5 |
| B | 0 | 229 | 74717 | 400.18 | 923 | 894 | 184.5 |
| B | 5 | 255 | 36659 | 193.87 | 923 | 894 | 184.5 |
| C | 12 | 16 | 270651 | 1260.27 | 909 | 914 | 214.0 |
| C | 14 | 254 | 258613 | 1204.03 | 909 | 914 | 214.0 |
| C | 15 | 208 | 171645 | 797.69 | 909 | 914 | 214.0 |
| D | 5 | 222 | 1714335 | 7556.85 | 891 | 862 | 226.7 |
| D | 2 | 249 | 557482 | 2454.84 | 891 | 862 | 226.7 |
| D | 13 | 249 | 443475 | 1952.04 | 891 | 862 | 226.7 |
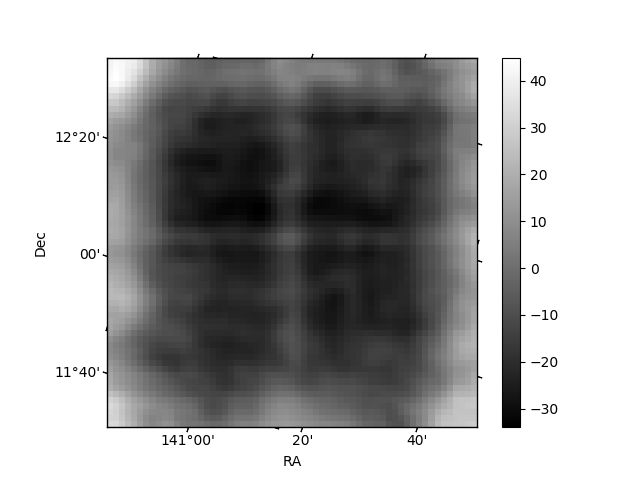
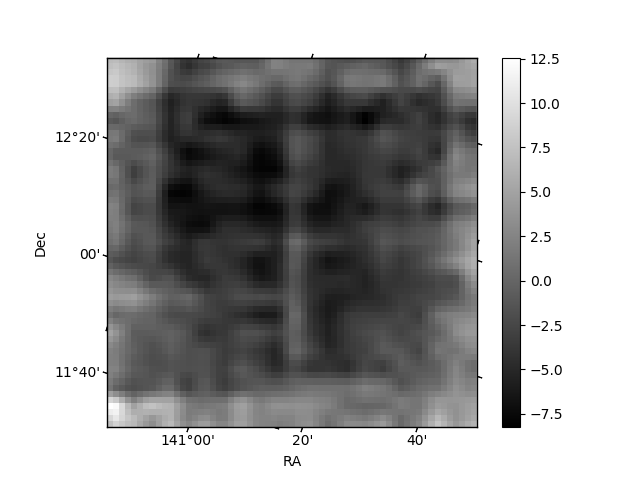
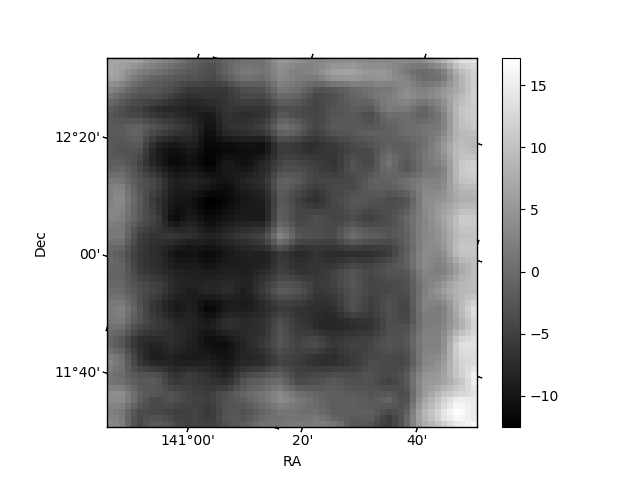
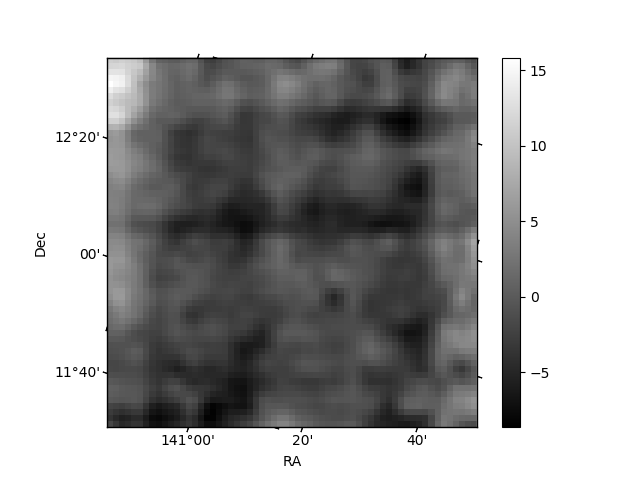
Histogram calculated using DETX and DETY for each event in the final _common_clean file
| Quadrant A | 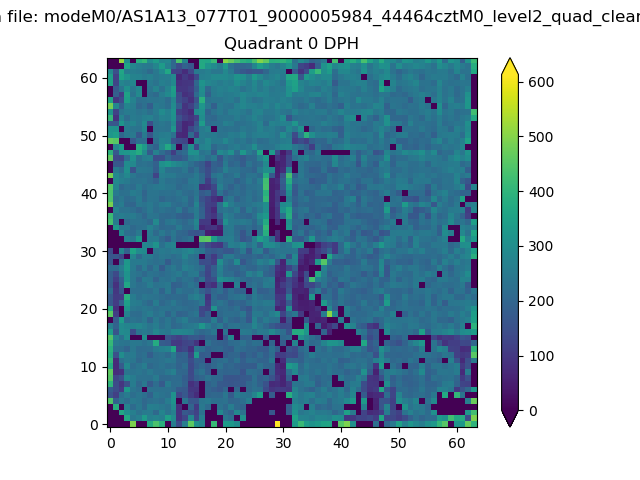 |
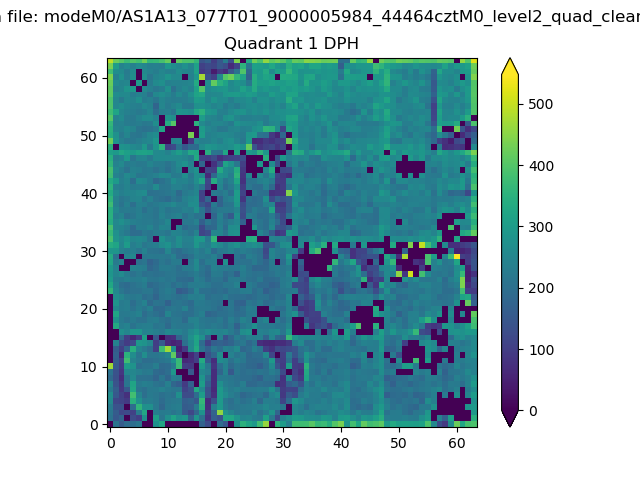 |
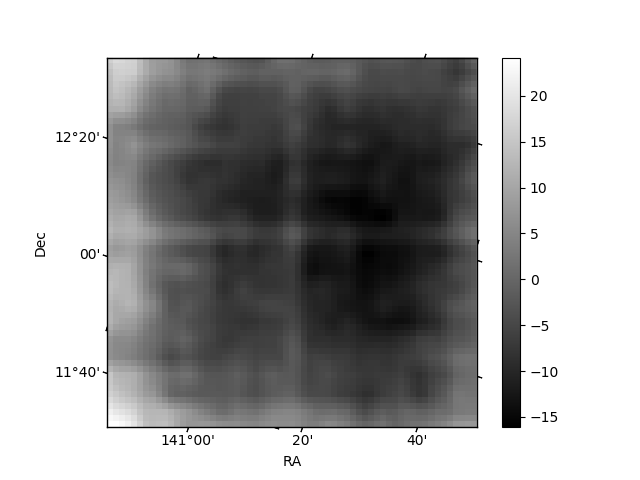
Quadrant B |
|---|---|---|---|
| Quadrant D | 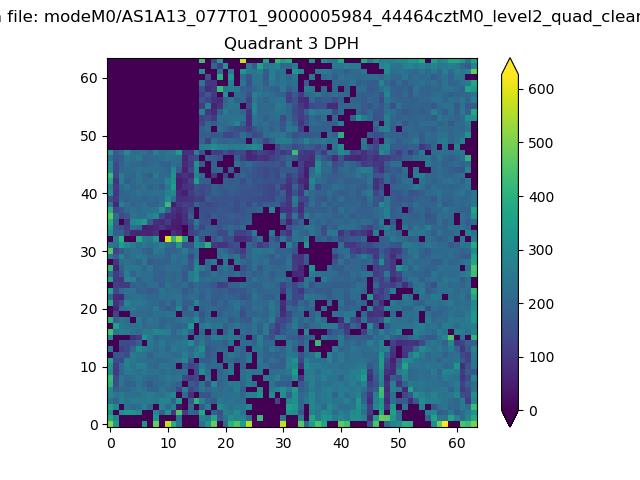 |
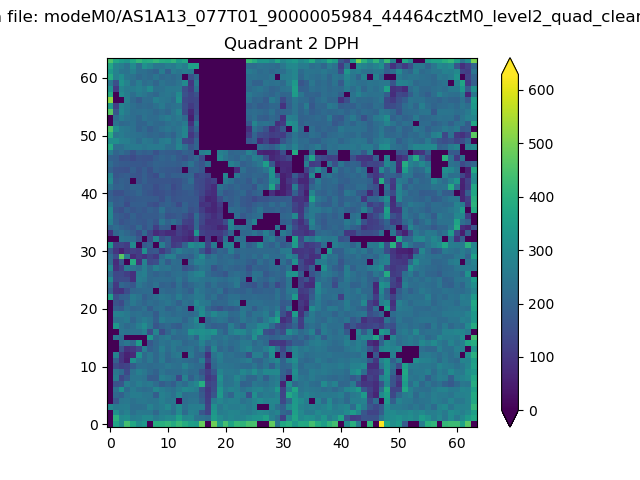 |
Quadrant C |
| Plot type | Count rate plots | Images |
|---|---|---|
| Comparison with Poisson distribution Blue bars denote a histogram of data divided into 1 sec bins. Red curve is a Poisson curve with rate = median count rate of data. |
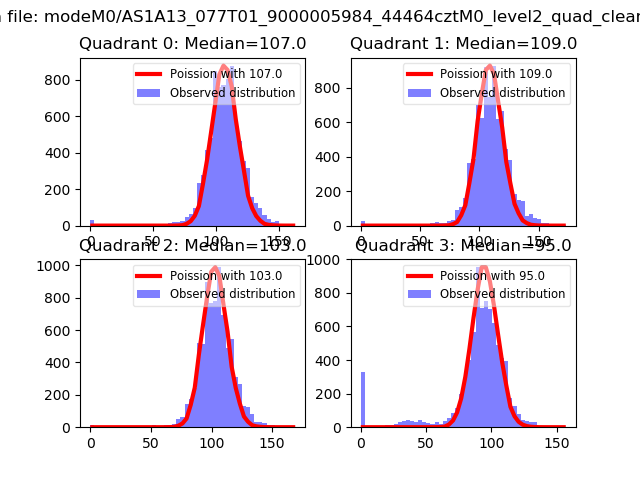 |
 |
| Quadrant-wise count rates Data is divided into 100 sec bins |
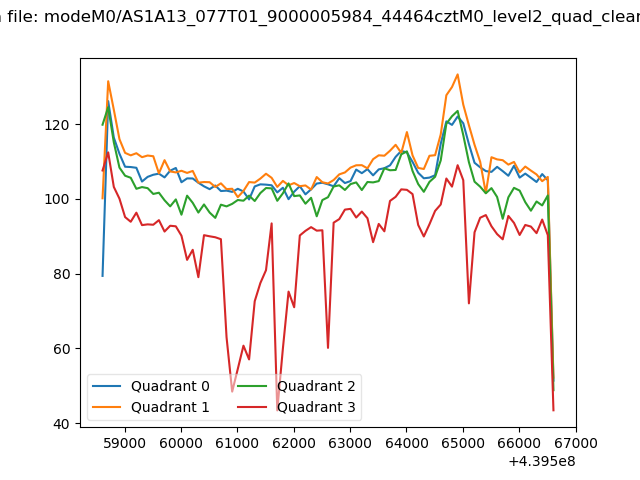 |
|
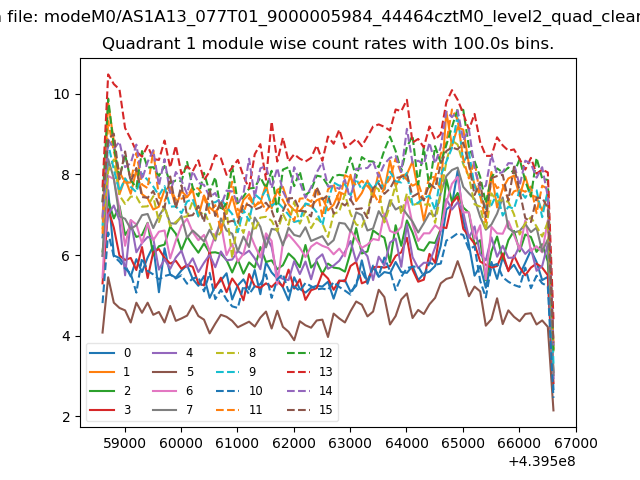
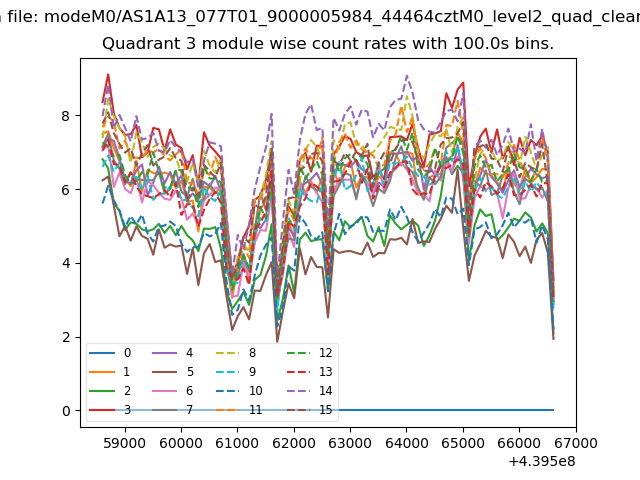
| Module-wise count rates for Quadrant A Data is divided into 100 sec bins |
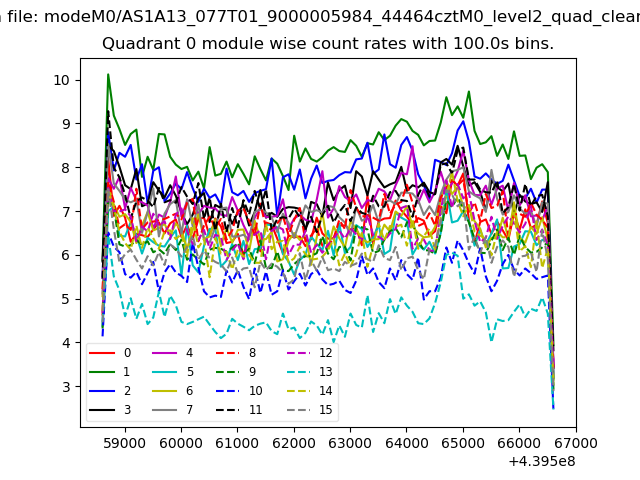 |
 |
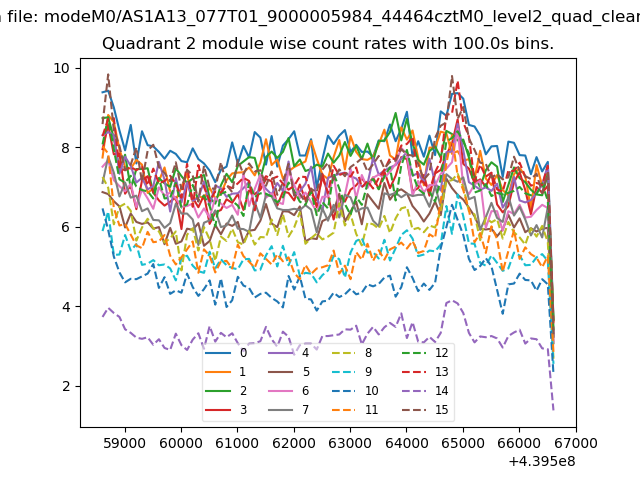
| Module-wise count rates for Quadrant B Data is divided into 100 sec bins |
 |
 |
| Module-wise count rates for Quadrant C Data is divided into 100 sec bins |
 |
 |
| Module-wise count rates for Quadrant D Data is divided into 100 sec bins |
 |
 |
| Parameter | Plot |
|---|---|
| CZT HV Monitor | 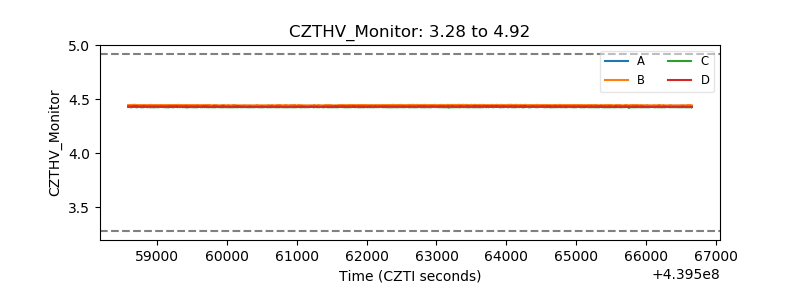 |
| D_VDD | 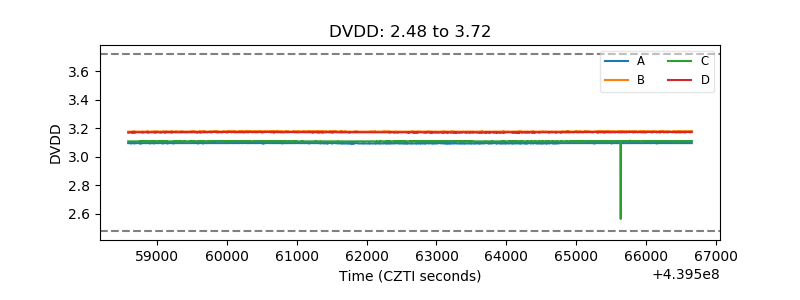 |
| Temperature 1 | 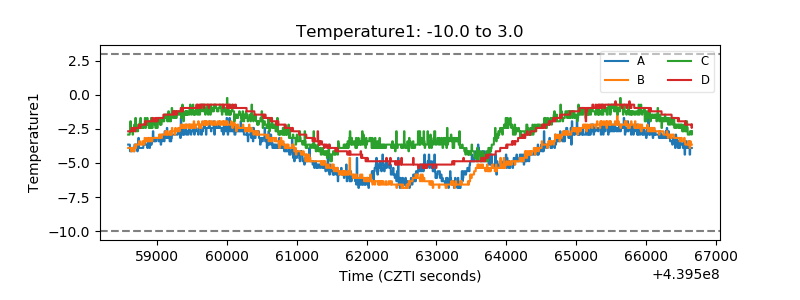 |
| Veto HV Monitor | 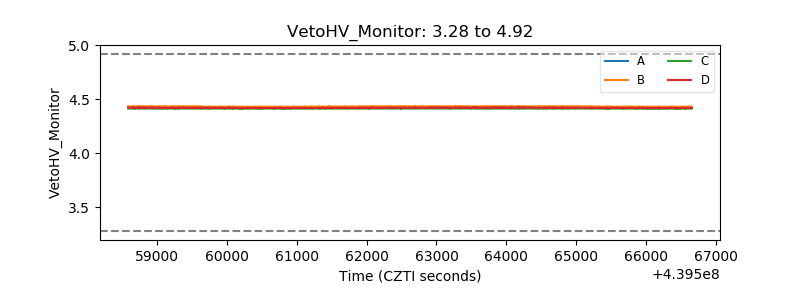 |
| Veto LLD | 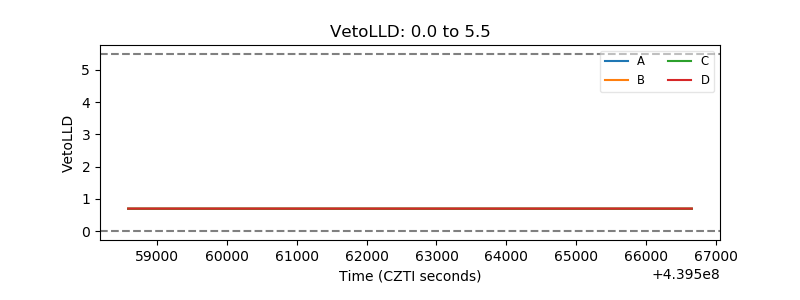 |
| Alpha Counter | 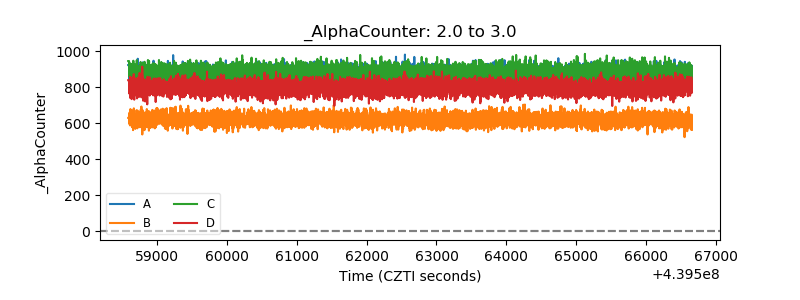 |
| _CPM_Rate | 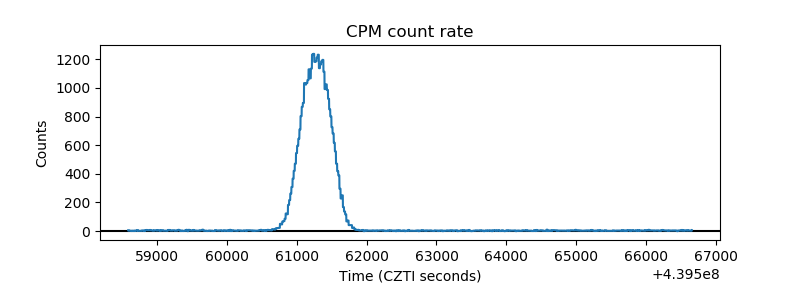 |
| CZT Counter | 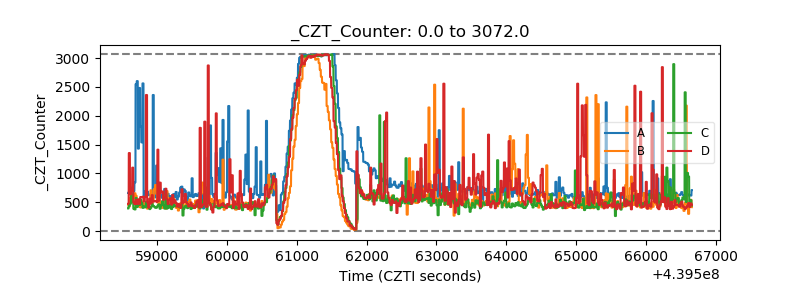 |
| +2.5 Volts monitor | 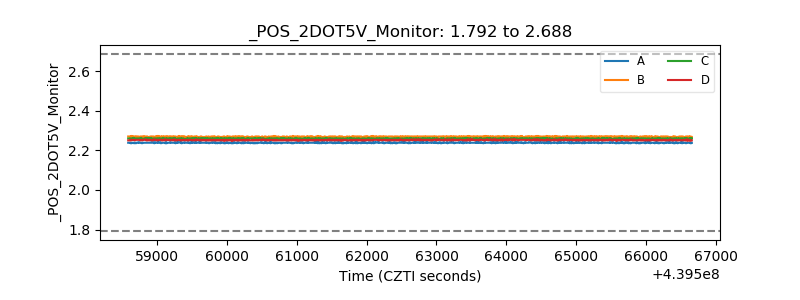 |
| +5 Volts monitor | 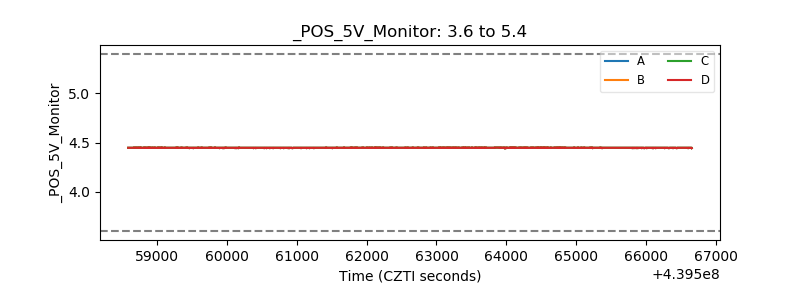 |
| _ROLL_ROT | 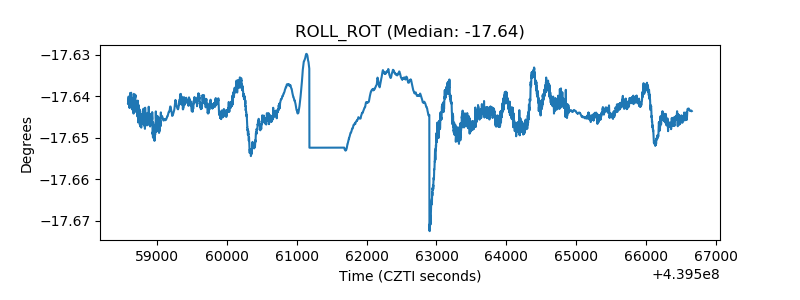 |
| _Roll_DEC | 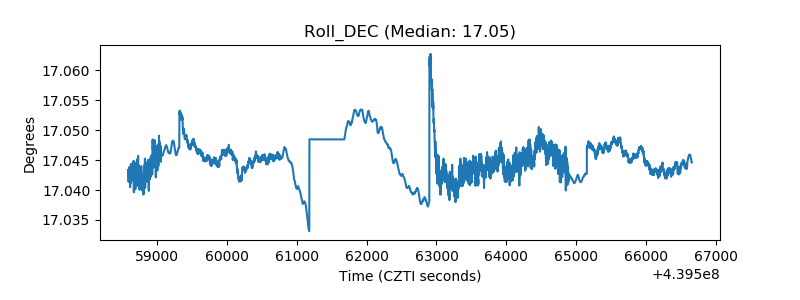 |
| _Roll_RA | 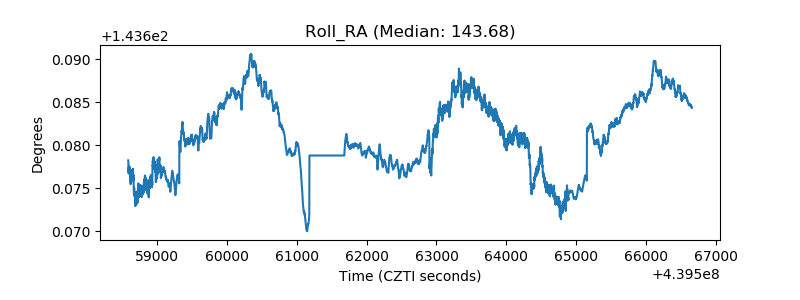 |
| Veto Counter | 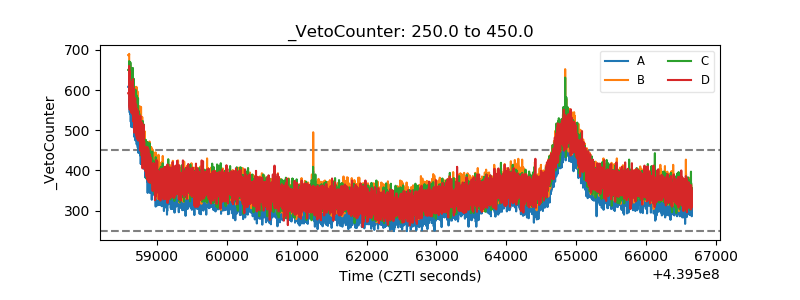 |