| Param | Original file | Final file |
|---|---|---|
| Filename | modeM0/AS1A13_080T06_9000005982_44265cztM0_level2.fits | modeM0/AS1A13_080T06_9000005982_44265cztM0_level2_quad_clean.evt |
| Size (bytes) | 720,083,520 | 114,413,760 |
| Size | 686.7 MB | 109.1 MB |
| Events in quadrant A | 10,754,327 | 682,455 |
| Events in quadrant B | 5,018,101 | 800,696 |
| Events in quadrant C | 3,775,960 | 777,684 |
| Events in quadrant D | 6,503,686 | 661,650 |
| Mode M0 | |||
|---|---|---|---|
| Quadrant | BADHDUFLAG | Total packets | Discarded packets |
| A | 0 | 37534 | 2 |
| B | 0 | 20220 | 2 |
| C | 0 | 16970 | 2 |
| D | 0 | 24794 | 2 |
| Mode M9 | |||
|---|---|---|---|
| Quadrant | BADHDUFLAG | Total packets | Discarded packets |
| A | 0 | 6 | 0 |
| B | 0 | 6 | 0 |
| C | 0 | 6 | 0 |
| D | 0 | 6 | 0 |
| Mode SS | |||
|---|---|---|---|
| Quadrant | BADHDUFLAG | Total packets | Discarded packets |
| A | 0 | 158 | 0 |
| B | 0 | 158 | 0 |
| C | 0 | 158 | 0 |
| D | 0 | 158 | 0 |
| Quadrant | Total seconds | Saturated seconds | Saturation percentage |
|---|---|---|---|
| A | 7788 | 1735 | 22.277863% |
| B | 7788 | 527 | 6.766821% |
| C | 7788 | 276 | 3.543914% |
| D | 7788 | 854 | 10.965588% |
Noise dominated data is calculated using 1-second bins in cleaned event files. If a bin has >2000 counts, and if more than 50% of those come from <1% of pixels, then it is considered to be noise-dominated and hence unusable.
| Quadrant | # 1 sec bins | Bins with >0 counts | Bins with >2000 counts | High rate bins dominated by noise | Noise dominated (total time) | Noise dominated (detector-on time) | Marked lightcurve |
|---|---|---|---|---|---|---|---|
| A | 8363 | 7790 | 1207 | 1207 | 14.43% | 15.49% | 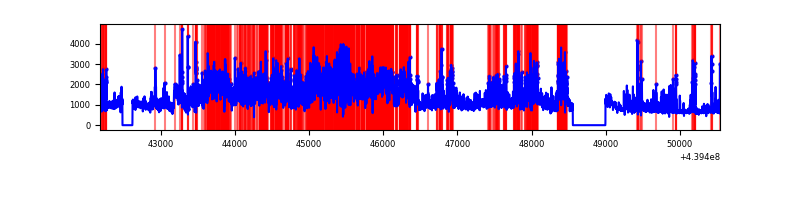 |
| B | 8363 | 7790 | 143 | 143 | 1.71% | 1.84% | 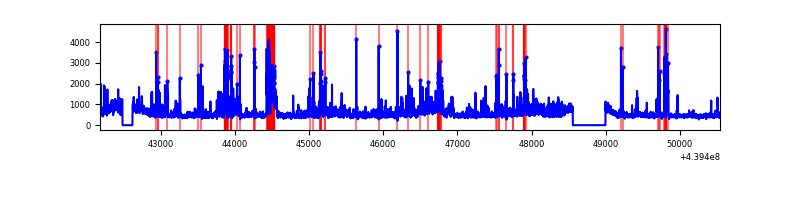 |
| C | 8363 | 7790 | 34 | 34 | 0.41% | 0.44% | 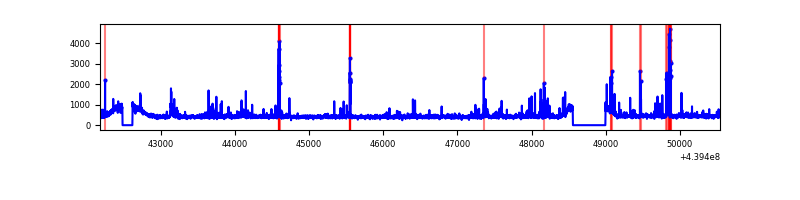 |
| D | 8363 | 7790 | 545 | 545 | 6.52% | 7.00% | 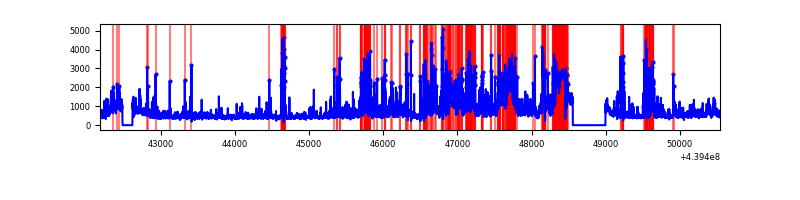 |
Top three noisy pixels from each quadrant. If the there are fewer than three noisy pixels in the level2.evt file, extra rows are filled as -1
| Pixel properties | Quadrant properties | ||||||
|---|---|---|---|---|---|---|---|
| Quadrant | DetID | PixID | Counts | Sigma | Mean | Median | Sigma |
| A | 15 | 223 | 5277818 | 30189.79 | 838 | 817 | 174.8 |
| A | 10 | 83 | 1703805 | 9742.82 | 838 | 817 | 174.8 |
| A | 14 | 254 | 279231 | 1592.81 | 838 | 817 | 174.8 |
| B | 0 | 219 | 545679 | 3163.39 | 869 | 840 | 172.2 |
| B | 0 | 200 | 193134 | 1116.48 | 869 | 840 | 172.2 |
| B | 4 | 170 | 158175 | 913.5 | 869 | 840 | 172.2 |
| C | 14 | 254 | 240363 | 1171.41 | 867 | 868 | 204.5 |
| C | 5 | 250 | 90866 | 440.19 | 867 | 868 | 204.5 |
| C | 3 | 233 | 25898 | 122.43 | 867 | 868 | 204.5 |
| D | 1 | 20 | 827318 | 4028.79 | 829 | 802 | 205.2 |
| D | 12 | 1 | 396805 | 1930.29 | 829 | 802 | 205.2 |
| D | 13 | 171 | 361689 | 1759.12 | 829 | 802 | 205.2 |
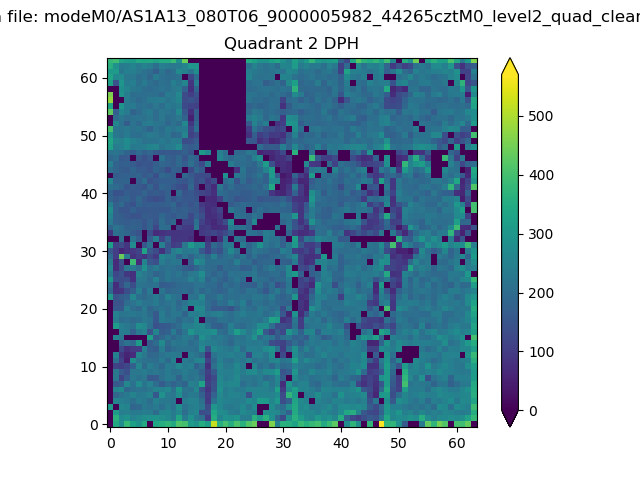
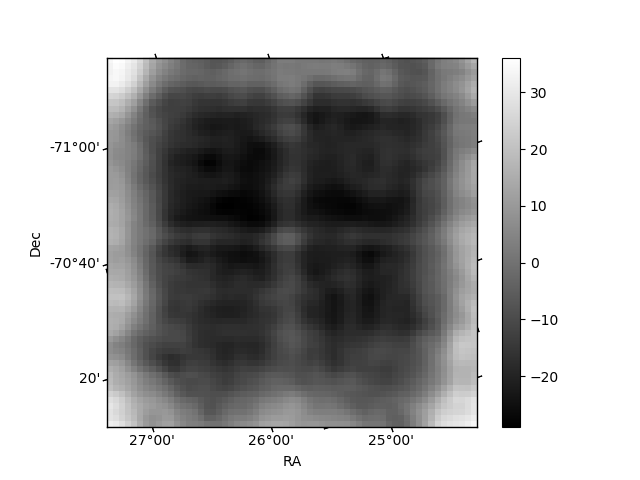
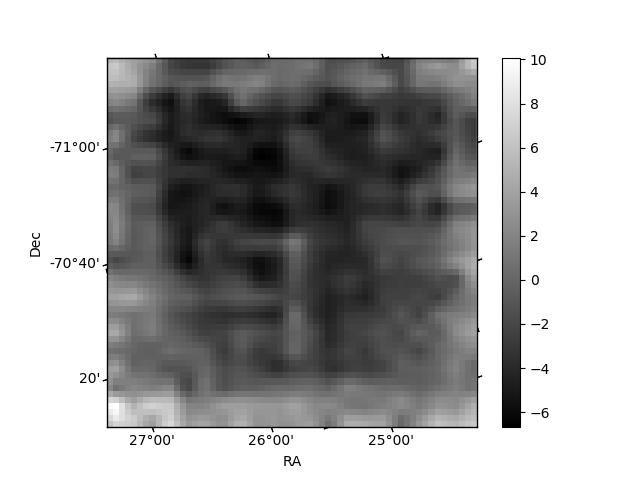
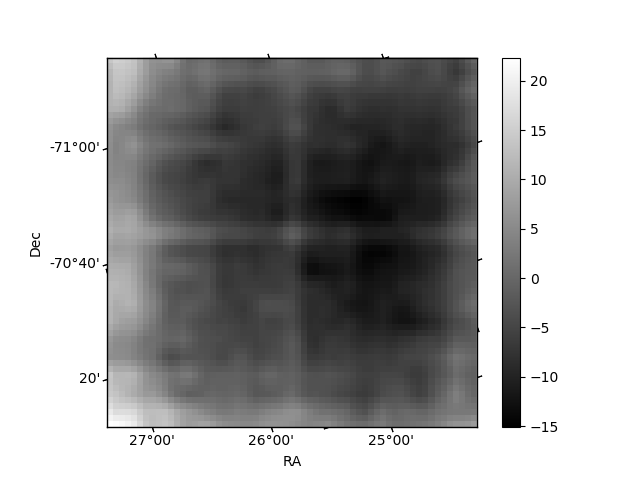
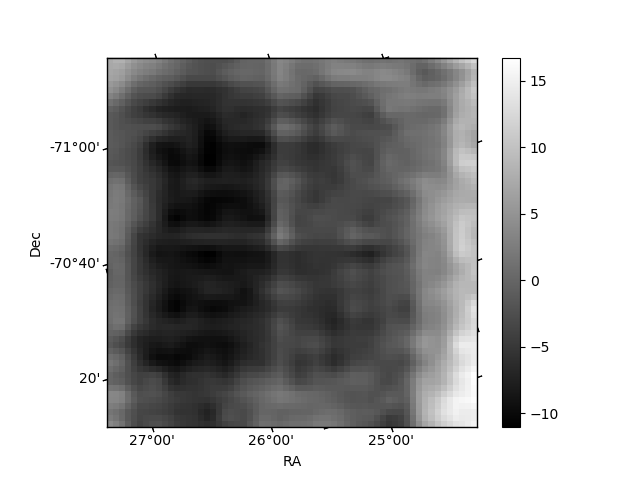
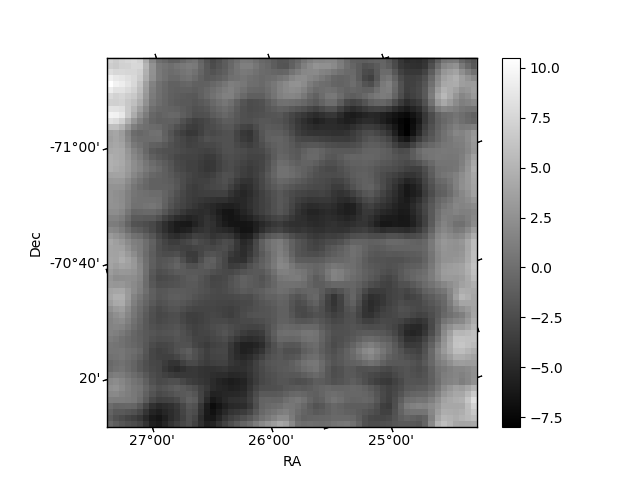
Histogram calculated using DETX and DETY for each event in the final _common_clean file
| Quadrant A | 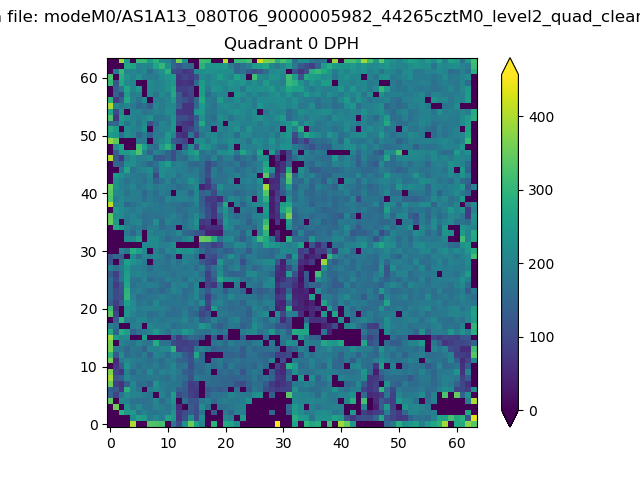 |
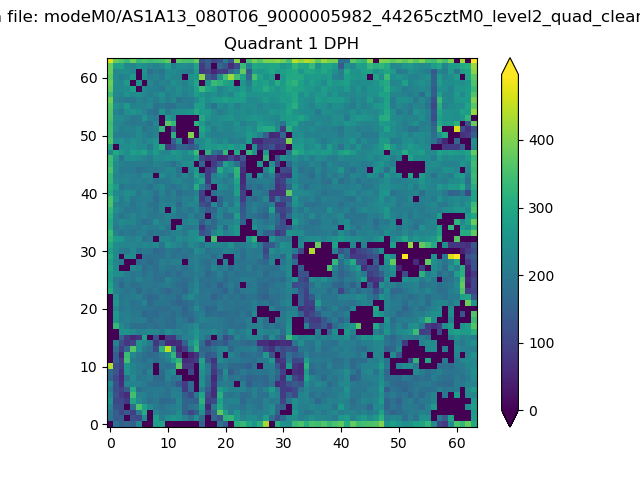 |
Quadrant B |
|---|---|---|---|
| Quadrant D | 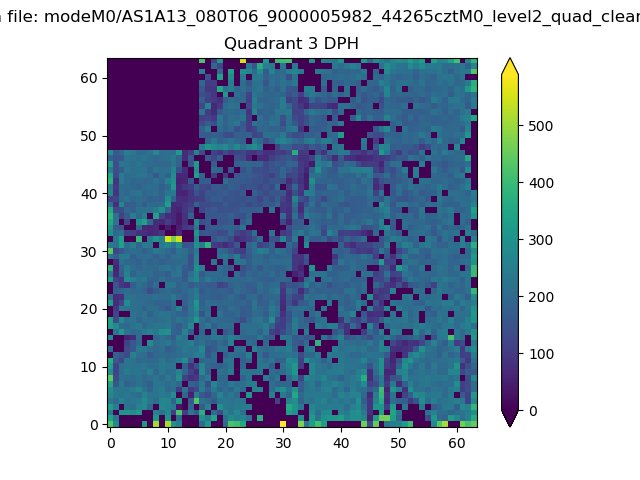 |
 |
Quadrant C |
| Plot type | Count rate plots | Images |
|---|---|---|
| Comparison with Poisson distribution Blue bars denote a histogram of data divided into 1 sec bins. Red curve is a Poisson curve with rate = median count rate of data. |
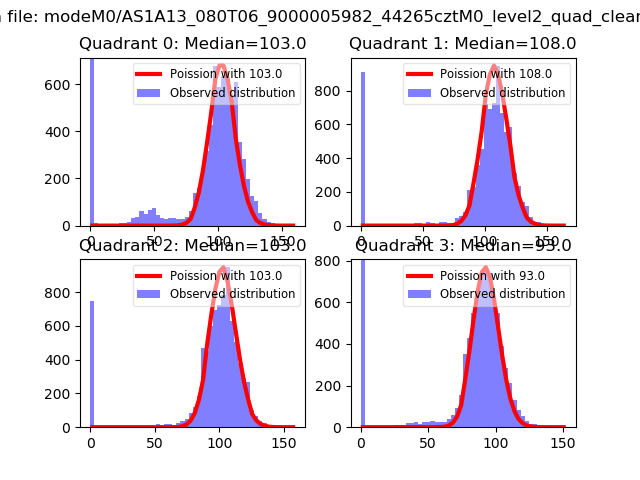 |
 |
| Quadrant-wise count rates Data is divided into 100 sec bins |
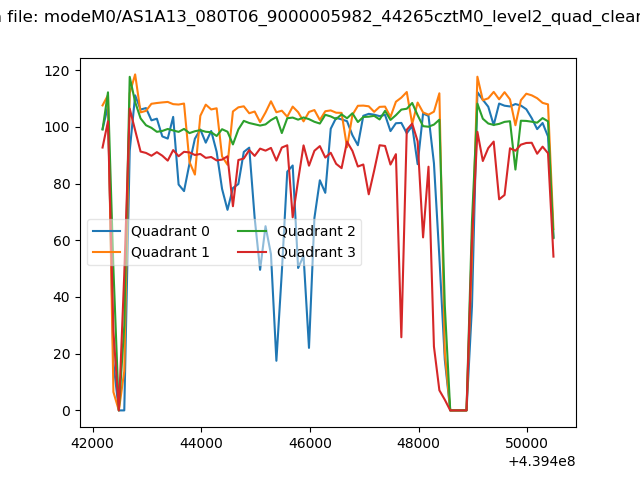 |
|
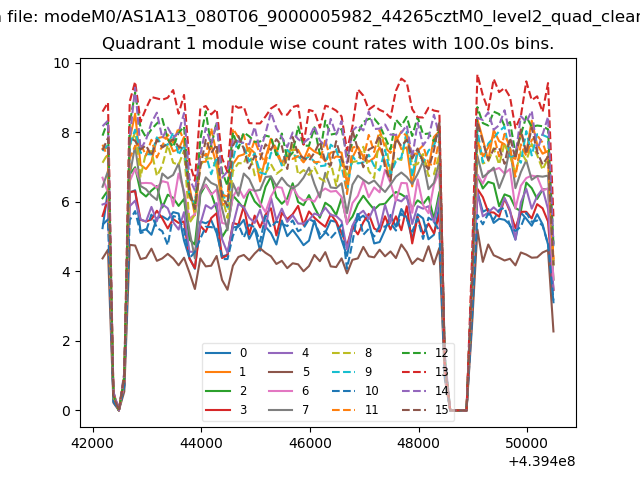
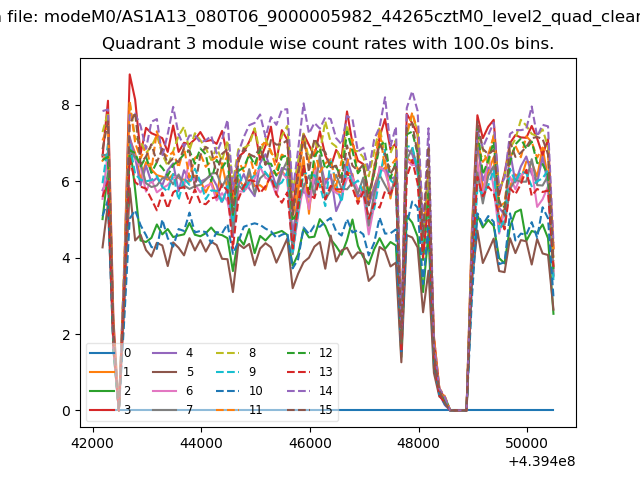
| Module-wise count rates for Quadrant A Data is divided into 100 sec bins |
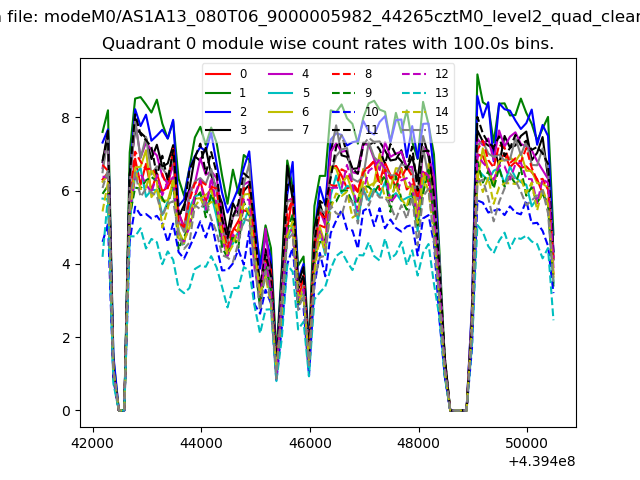 |
 |
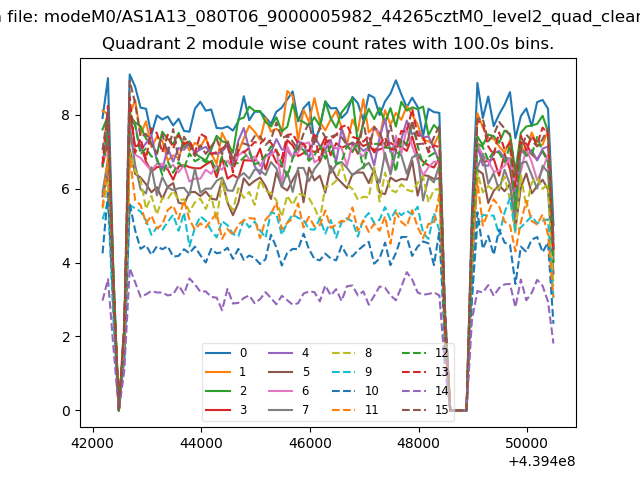
| Module-wise count rates for Quadrant B Data is divided into 100 sec bins |
 |
 |
| Module-wise count rates for Quadrant C Data is divided into 100 sec bins |
 |
 |
| Module-wise count rates for Quadrant D Data is divided into 100 sec bins |
 |
 |
| Parameter | Plot |
|---|---|
| CZT HV Monitor | 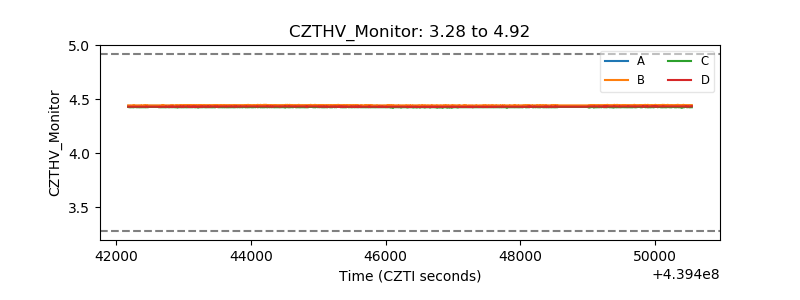 |
| D_VDD | 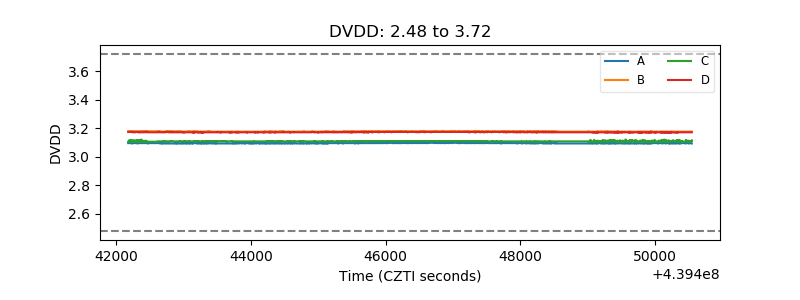 |
| Temperature 1 | 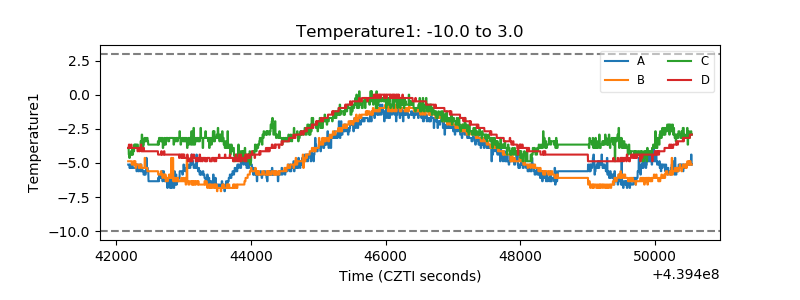 |
| Veto HV Monitor | 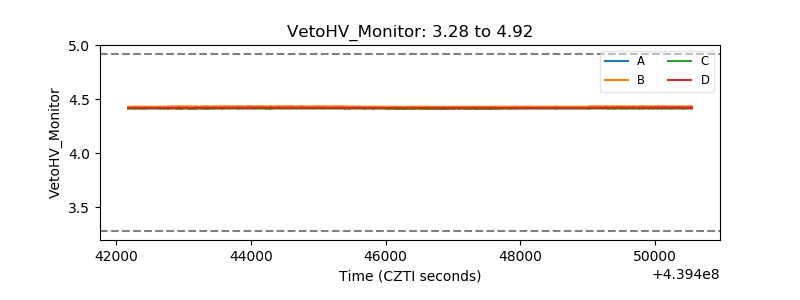 |
| Veto LLD | 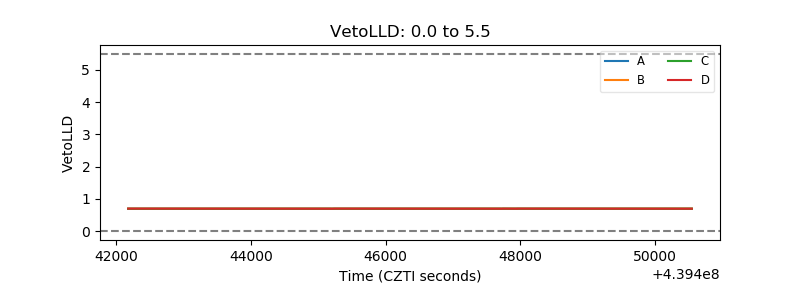 |
| Alpha Counter | 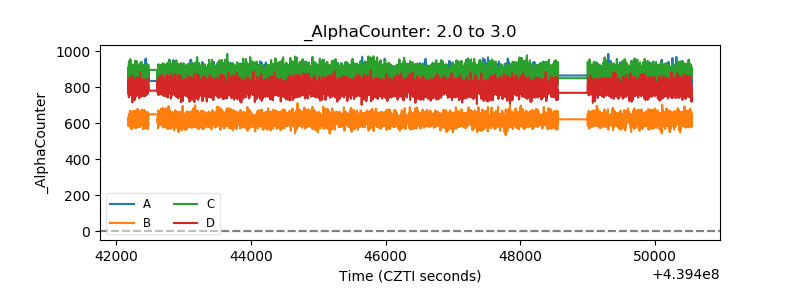 |
| _CPM_Rate | 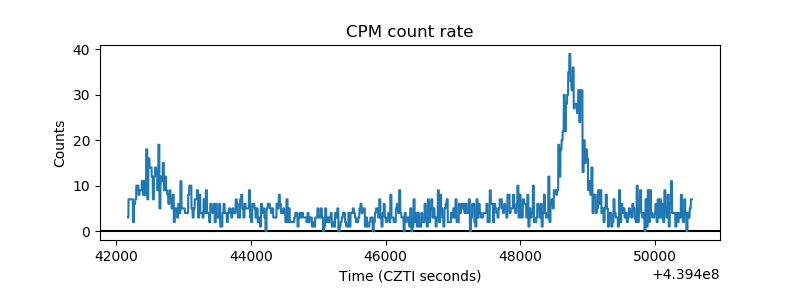 |
| CZT Counter | 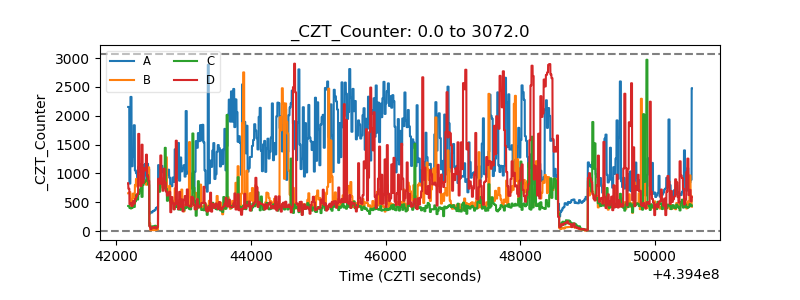 |
| +2.5 Volts monitor | 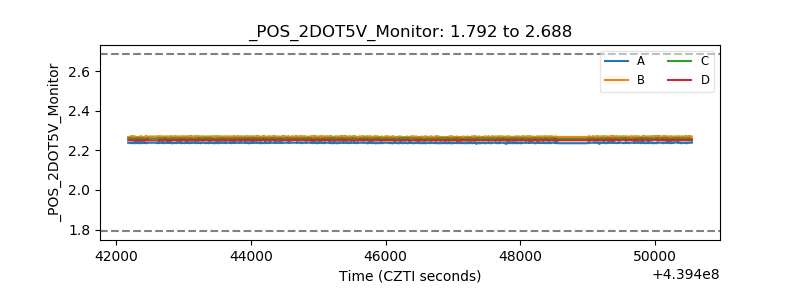 |
| +5 Volts monitor | 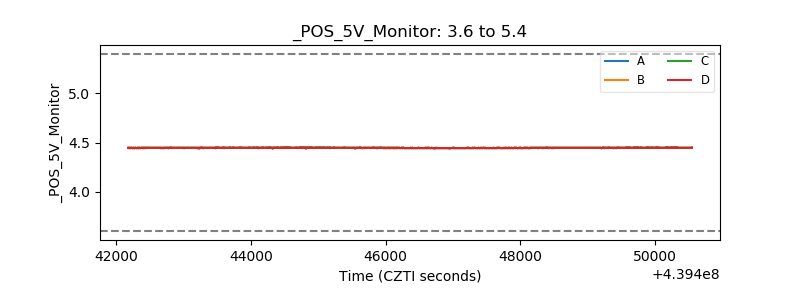 |
| _ROLL_ROT | 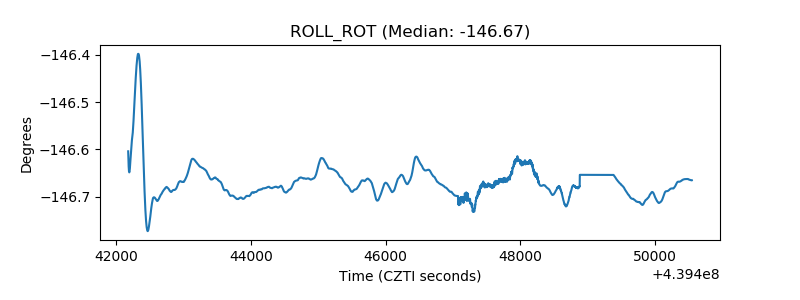 |
| _Roll_DEC | 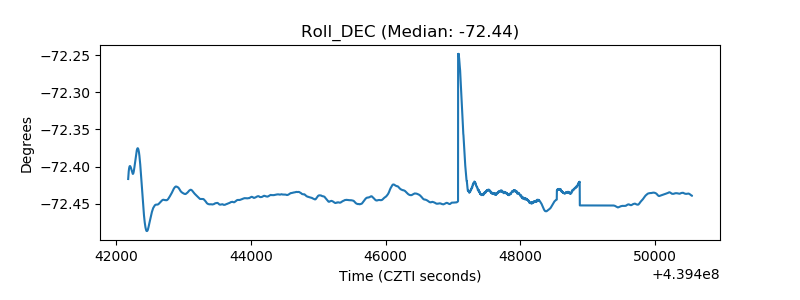 |
| _Roll_RA | 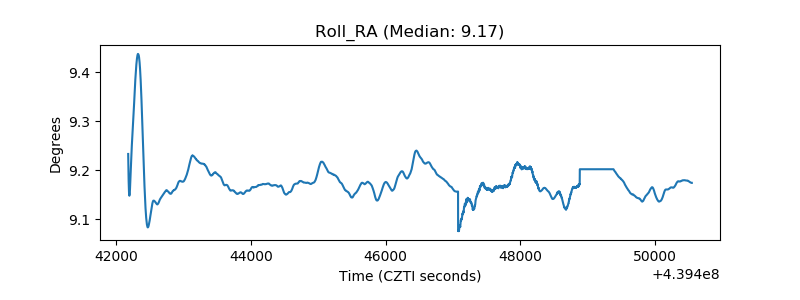 |
| Veto Counter | 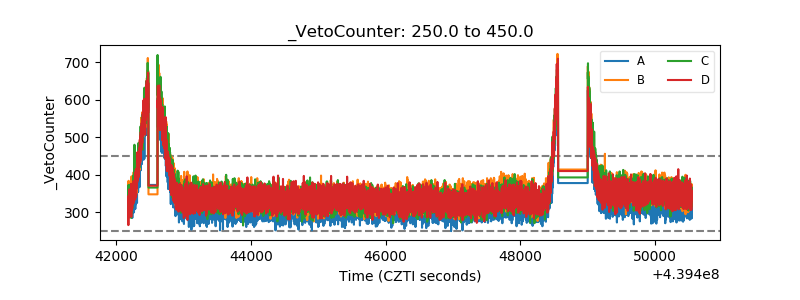 |