| Param | Original file | Final file |
|---|---|---|
| Filename | modeM0/AS1A13_080T06_9000005982_44266cztM0_level2.fits | modeM0/AS1A13_080T06_9000005982_44266cztM0_level2_quad_clean.evt |
| Size (bytes) | 1,089,685,440 | 170,118,720 |
| Size | 1.0 GB | 162.2 MB |
| Events in quadrant A | 17,995,931 | 816,630 |
| Events in quadrant B | 6,282,146 | 1,253,354 |
| Events in quadrant C | 5,367,546 | 1,216,810 |
| Events in quadrant D | 9,781,540 | 1,049,622 |
| Mode M0 | |||
|---|---|---|---|
| Quadrant | BADHDUFLAG | Total packets | Discarded packets |
| A | 0 | 62206 | 2 |
| B | 0 | 26492 | 2 |
| C | 0 | 24723 | 2 |
| D | 0 | 37112 | 2 |
| Mode M9 | |||
|---|---|---|---|
| Quadrant | BADHDUFLAG | Total packets | Discarded packets |
| A | 0 | 14 | 0 |
| B | 0 | 14 | 0 |
| C | 0 | 14 | 0 |
| D | 0 | 14 | 0 |
| Mode SS | |||
|---|---|---|---|
| Quadrant | BADHDUFLAG | Total packets | Discarded packets |
| A | 0 | 242 | 0 |
| B | 0 | 242 | 0 |
| C | 0 | 242 | 0 |
| D | 0 | 242 | 0 |
| Quadrant | Total seconds | Saturated seconds | Saturation percentage |
|---|---|---|---|
| A | 11754 | 4400 | 37.434065% |
| B | 11754 | 283 | 2.407691% |
| C | 11755 | 169 | 1.437686% |
| D | 11755 | 940 | 7.996597% |
Noise dominated data is calculated using 1-second bins in cleaned event files. If a bin has >2000 counts, and if more than 50% of those come from <1% of pixels, then it is considered to be noise-dominated and hence unusable.
| Quadrant | # 1 sec bins | Bins with >0 counts | Bins with >2000 counts | High rate bins dominated by noise | Noise dominated (total time) | Noise dominated (detector-on time) | Marked lightcurve |
|---|---|---|---|---|---|---|---|
| A | 13254 | 11755 | 3680 | 3680 | 27.77% | 31.31% | 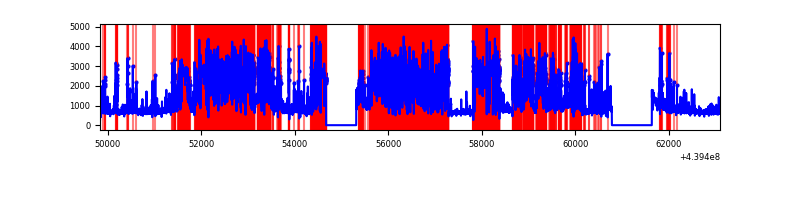 |
| B | 13254 | 11756 | 84 | 84 | 0.63% | 0.71% | 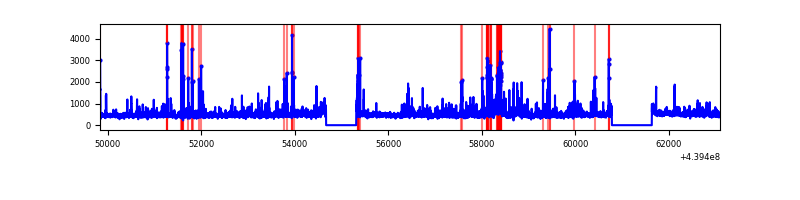 |
| C | 13255 | 11757 | 43 | 43 | 0.32% | 0.37% | 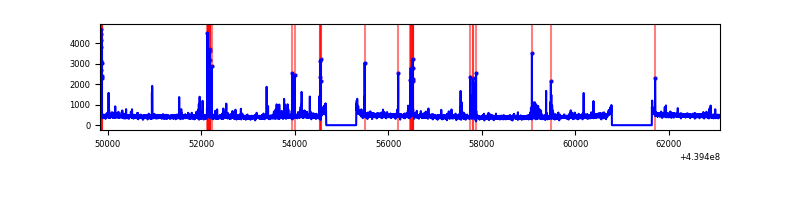 |
| D | 13255 | 11756 | 700 | 700 | 5.28% | 5.95% | 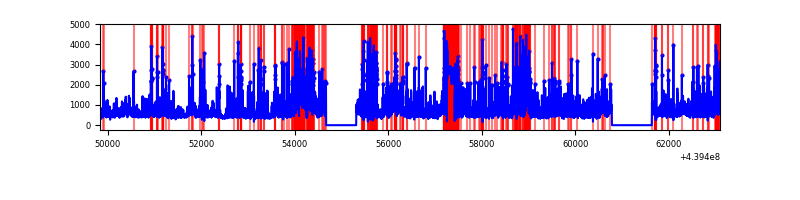 |
Top three noisy pixels from each quadrant. If the there are fewer than three noisy pixels in the level2.evt file, extra rows are filled as -1
| Pixel properties | Quadrant properties | ||||||
|---|---|---|---|---|---|---|---|
| Quadrant | DetID | PixID | Counts | Sigma | Mean | Median | Sigma |
| A | 15 | 223 | 11102345 | 50533.44 | 1063 | 1037 | 219.7 |
| A | 10 | 83 | 2365259 | 10762.0 | 1063 | 1037 | 219.7 |
| A | 7 | 3 | 216050 | 978.74 | 1063 | 1037 | 219.7 |
| B | 5 | 235 | 152816 | 604.38 | 1281 | 1241 | 250.8 |
| B | 0 | 190 | 126362 | 498.9 | 1281 | 1241 | 250.8 |
| B | 4 | 173 | 125607 | 495.89 | 1281 | 1241 | 250.8 |
| C | 14 | 254 | 337462 | 1144.31 | 1261 | 1267 | 293.8 |
| C | 3 | 233 | 33413 | 109.42 | 1261 | 1267 | 293.8 |
| C | 11 | 16 | 27090 | 87.89 | 1261 | 1267 | 293.8 |
| D | 1 | 20 | 984588 | 3185.77 | 1224 | 1187 | 308.7 |
| D | 1 | 52 | 805836 | 2606.7 | 1224 | 1187 | 308.7 |
| D | 2 | 249 | 600795 | 1942.46 | 1224 | 1187 | 308.7 |
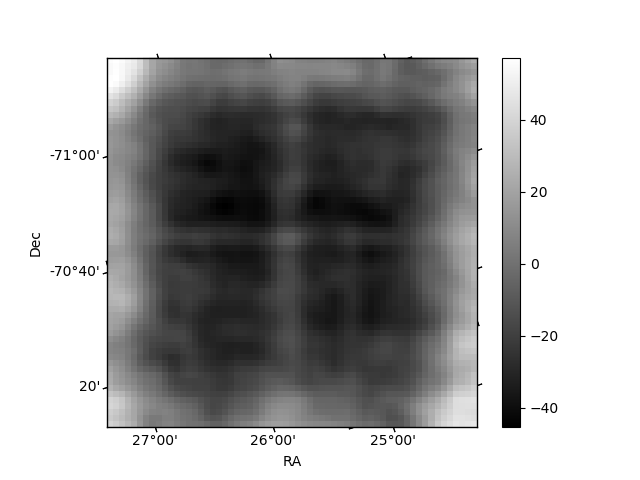
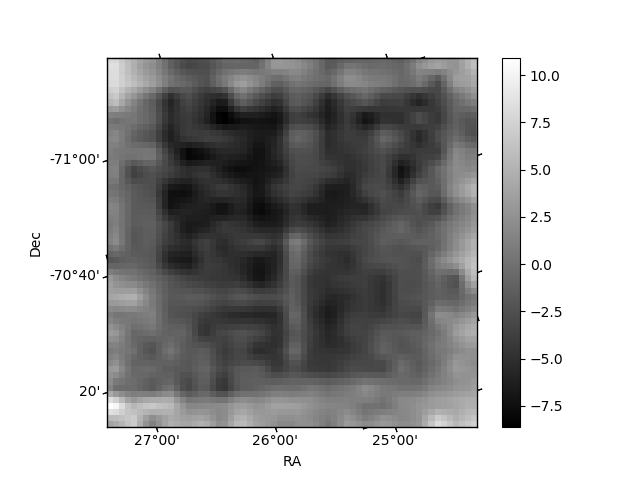
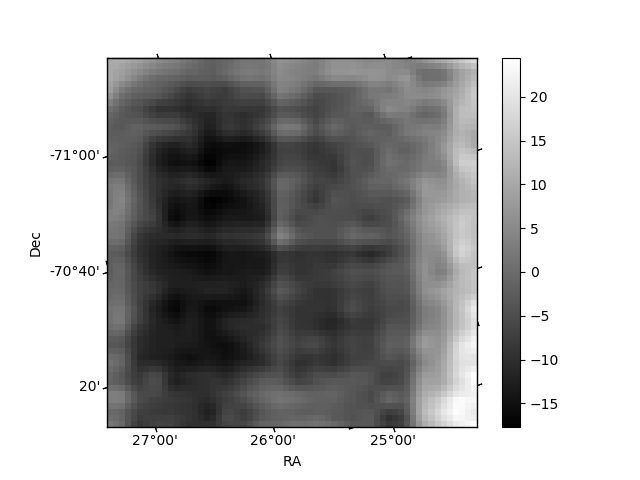
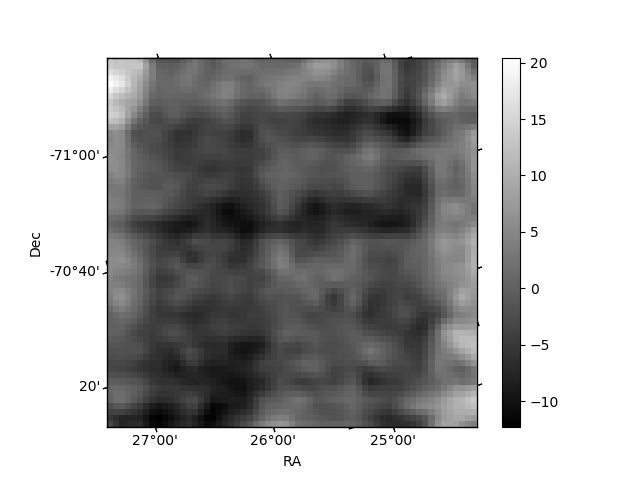
Histogram calculated using DETX and DETY for each event in the final _common_clean file
| Quadrant A | 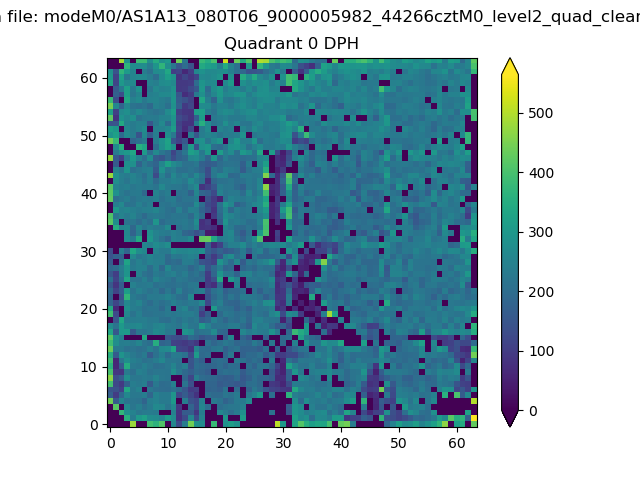 |
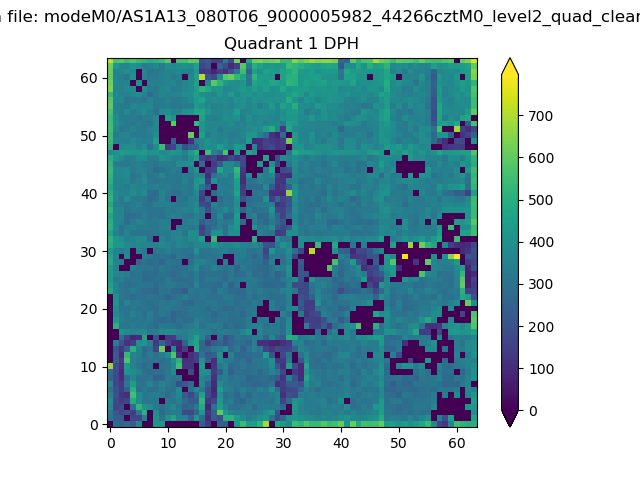 |
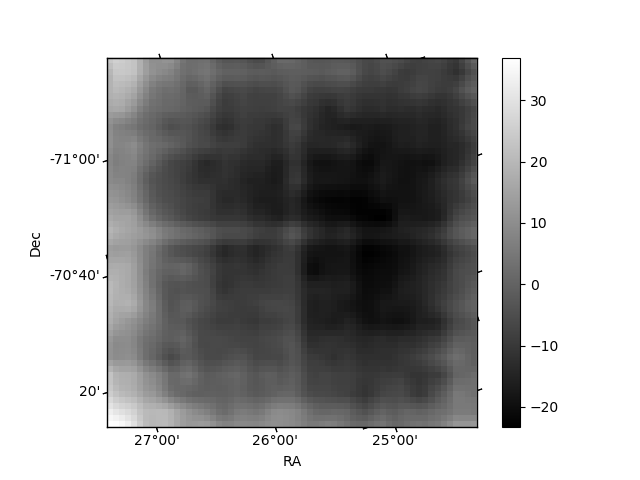
Quadrant B |
|---|---|---|---|
| Quadrant D | 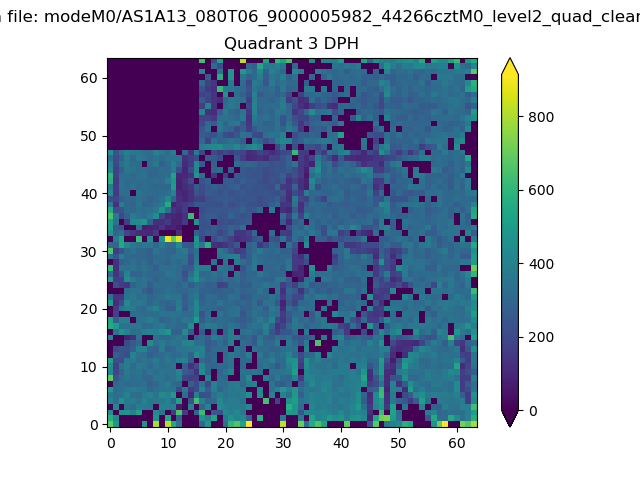 |
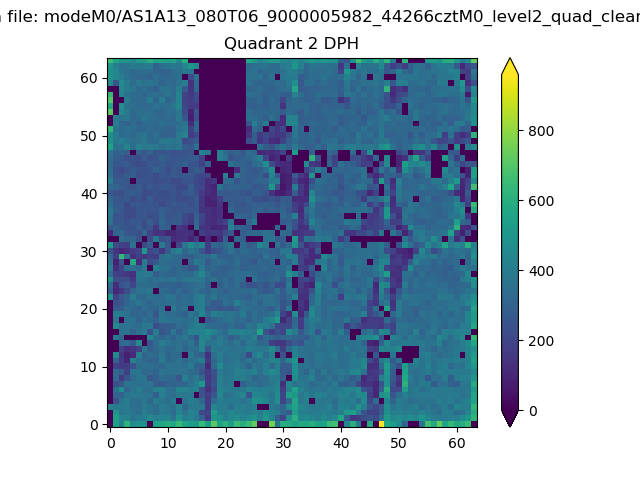 |
Quadrant C |
| Plot type | Count rate plots | Images |
|---|---|---|
| Comparison with Poisson distribution Blue bars denote a histogram of data divided into 1 sec bins. Red curve is a Poisson curve with rate = median count rate of data. |
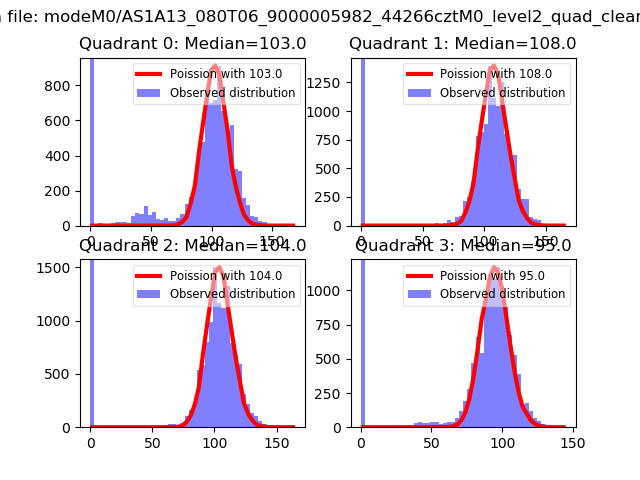 |
 |
| Quadrant-wise count rates Data is divided into 100 sec bins |
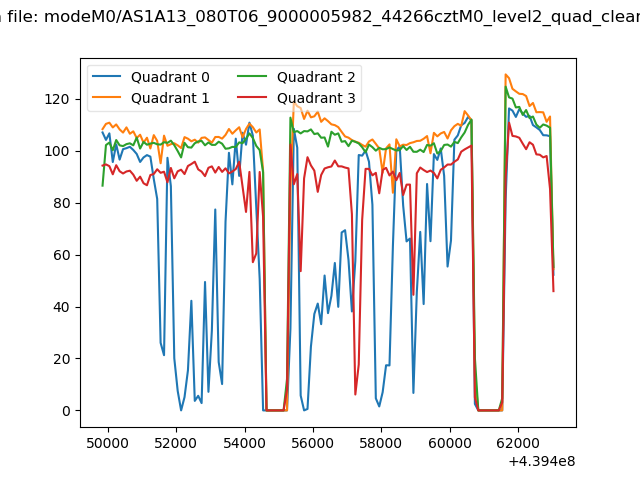 |
|
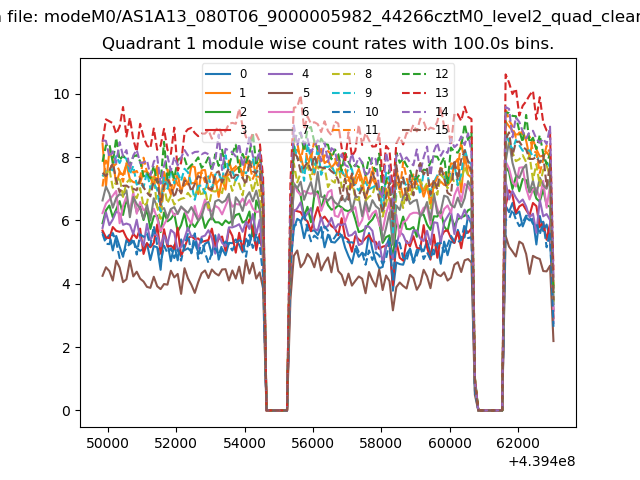
| Module-wise count rates for Quadrant A Data is divided into 100 sec bins |
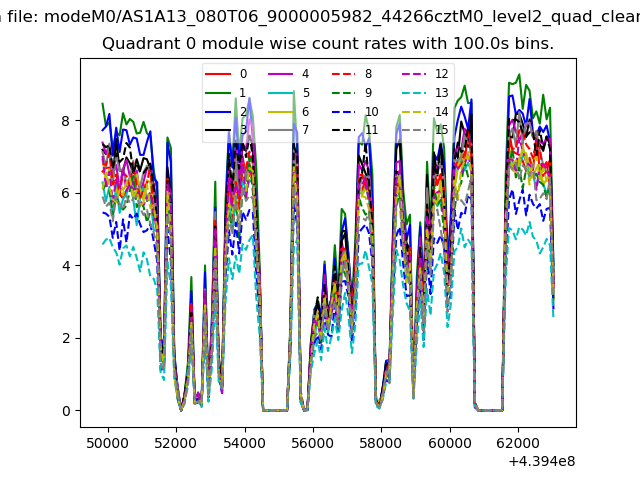 |
 |
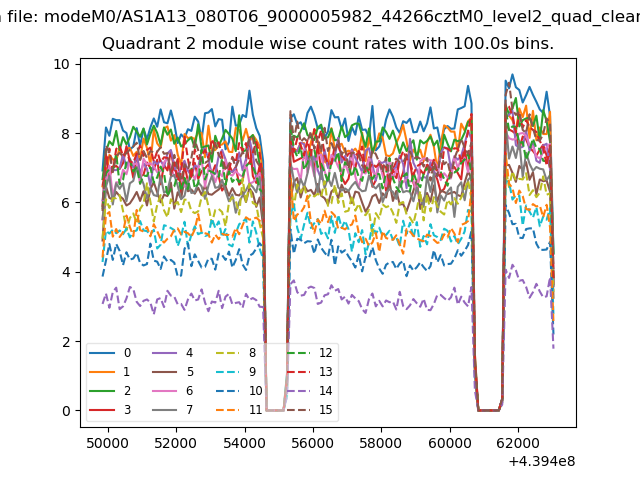
| Module-wise count rates for Quadrant B Data is divided into 100 sec bins |
 |
 |
| Module-wise count rates for Quadrant C Data is divided into 100 sec bins |
 |
 |
| Module-wise count rates for Quadrant D Data is divided into 100 sec bins |
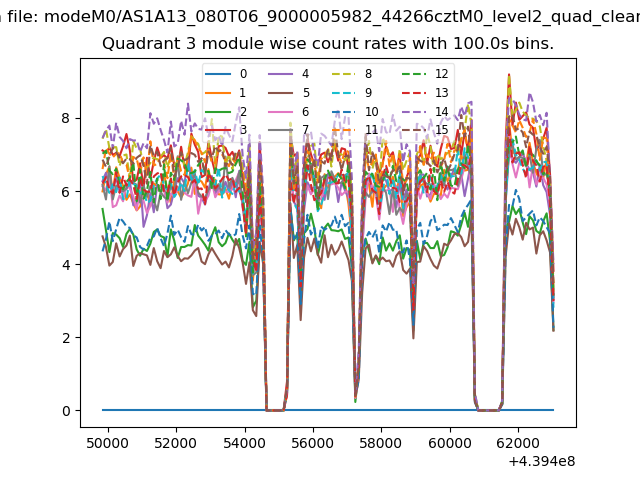 |
 |
| Parameter | Plot |
|---|---|
| CZT HV Monitor | 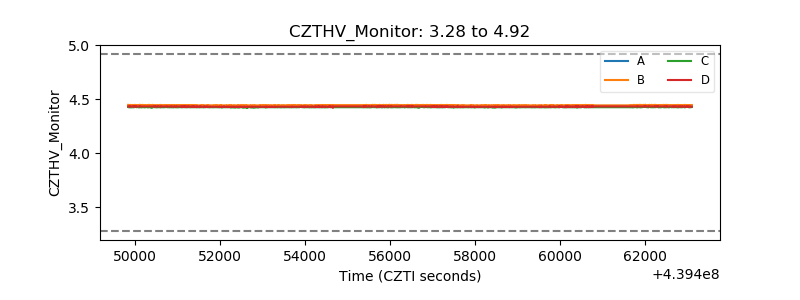 |
| D_VDD | 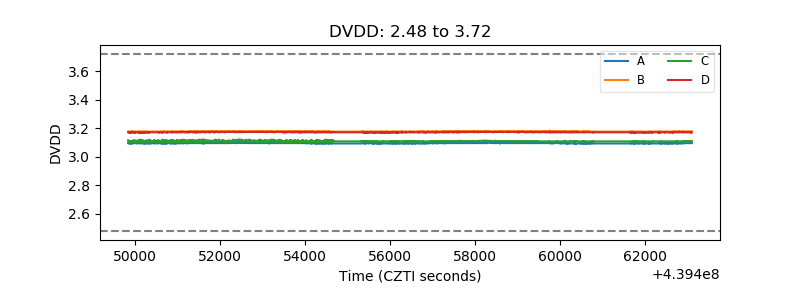 |
| Temperature 1 | 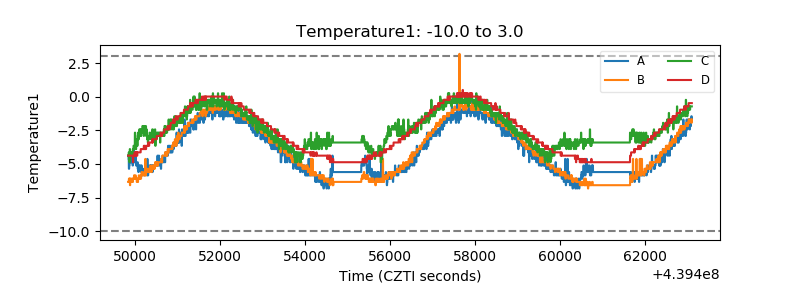 |
| Veto HV Monitor | 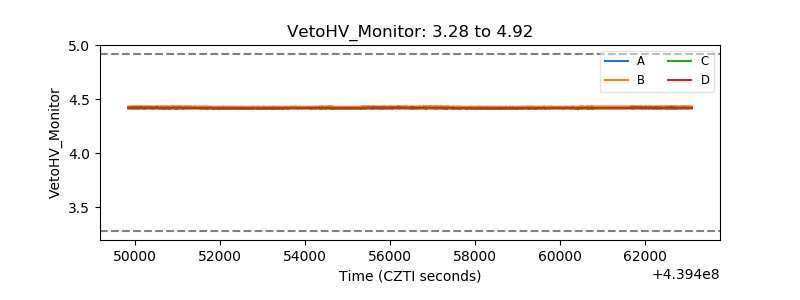 |
| Veto LLD | 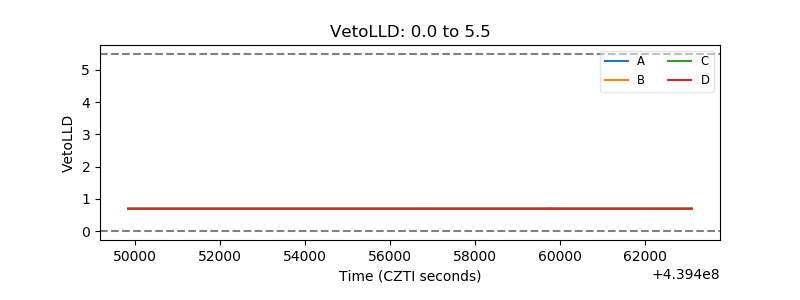 |
| Alpha Counter |  |
| _CPM_Rate | 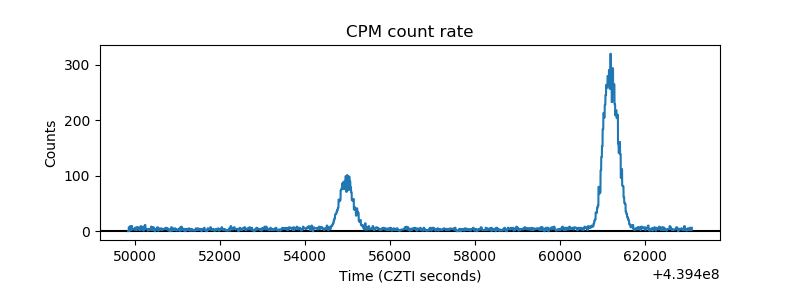 |
| CZT Counter | 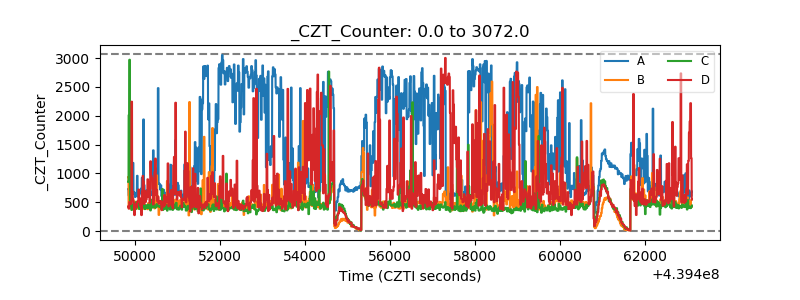 |
| +2.5 Volts monitor | 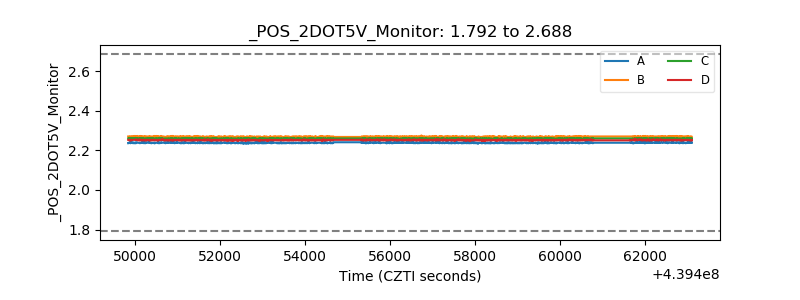 |
| +5 Volts monitor | 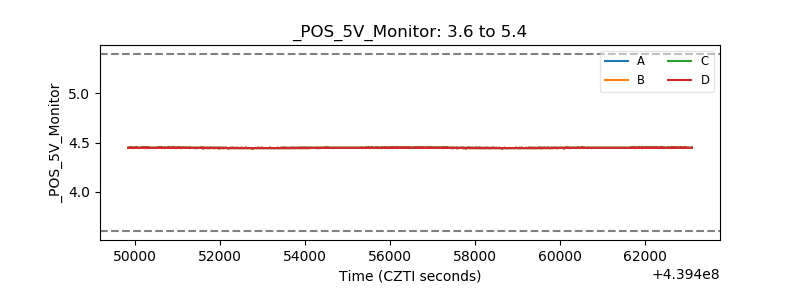 |
| _ROLL_ROT | 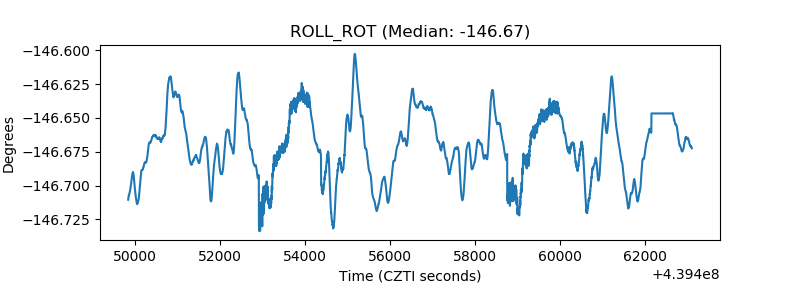 |
| _Roll_DEC | 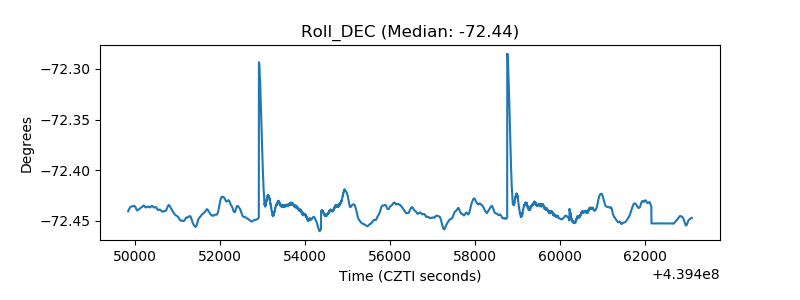 |
| _Roll_RA | 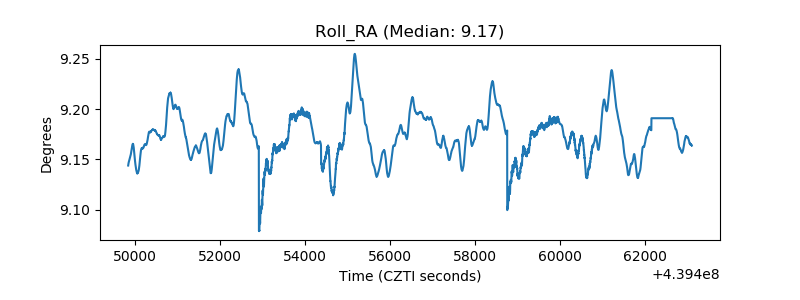 |
| Veto Counter | 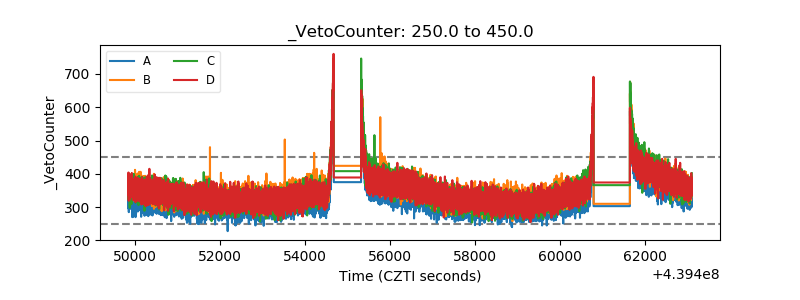 |