| Param | Original file | Final file |
|---|---|---|
| Filename | modeM0/AS1A13_080T06_9000005982_44268cztM0_level2.fits | modeM0/AS1A13_080T06_9000005982_44268cztM0_level2_quad_clean.evt |
| Size (bytes) | 513,239,040 | 102,441,600 |
| Size | 489.5 MB | 97.7 MB |
| Events in quadrant A | 5,701,738 | 656,725 |
| Events in quadrant B | 3,587,324 | 712,588 |
| Events in quadrant C | 3,073,179 | 693,251 |
| Events in quadrant D | 6,138,879 | 591,984 |
| Mode M0 | |||
|---|---|---|---|
| Quadrant | BADHDUFLAG | Total packets | Discarded packets |
| A | 0 | 22099 | 1 |
| B | 0 | 14834 | 1 |
| C | 0 | 13787 | 1 |
| D | 0 | 22633 | 1 |
| Mode M9 | |||
|---|---|---|---|
| Quadrant | BADHDUFLAG | Total packets | Discarded packets |
| A | 0 | 10 | 0 |
| B | 0 | 10 | 0 |
| C | 0 | 10 | 0 |
| D | 0 | 10 | 0 |
| Mode SS | |||
|---|---|---|---|
| Quadrant | BADHDUFLAG | Total packets | Discarded packets |
| A | 0 | 130 | 0 |
| B | 0 | 130 | 0 |
| C | 0 | 130 | 0 |
| D | 0 | 130 | 0 |
| Quadrant | Total seconds | Saturated seconds | Saturation percentage |
|---|---|---|---|
| A | 6409 | 511 | 7.973163% |
| B | 6409 | 151 | 2.356062% |
| C | 6409 | 64 | 0.998596% |
| D | 6409 | 662 | 10.329225% |
Noise dominated data is calculated using 1-second bins in cleaned event files. If a bin has >2000 counts, and if more than 50% of those come from <1% of pixels, then it is considered to be noise-dominated and hence unusable.
| Quadrant | # 1 sec bins | Bins with >0 counts | Bins with >2000 counts | High rate bins dominated by noise | Noise dominated (total time) | Noise dominated (detector-on time) | Marked lightcurve |
|---|---|---|---|---|---|---|---|
| A | 7409 | 6410 | 365 | 365 | 4.93% | 5.69% | 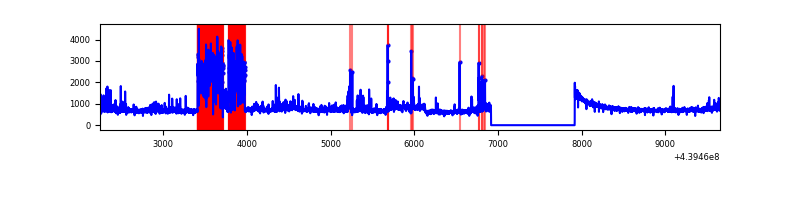 |
| B | 7409 | 6410 | 57 | 57 | 0.77% | 0.89% | 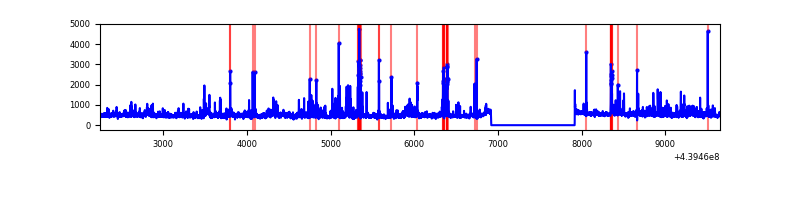 |
| C | 7409 | 6410 | 25 | 25 | 0.34% | 0.39% | 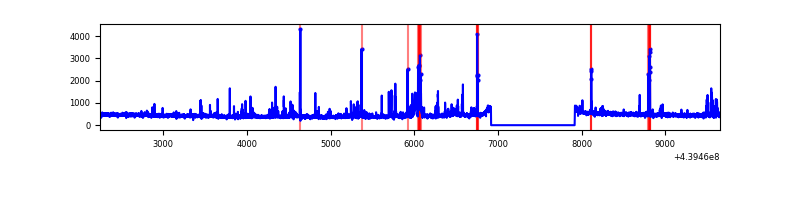 |
| D | 7409 | 6410 | 566 | 566 | 7.64% | 8.83% | 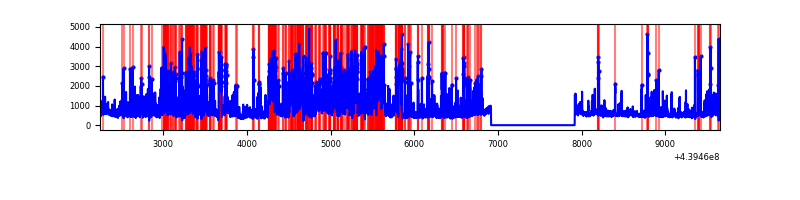 |
Top three noisy pixels from each quadrant. If the there are fewer than three noisy pixels in the level2.evt file, extra rows are filled as -1
| Pixel properties | Quadrant properties | ||||||
|---|---|---|---|---|---|---|---|
| Quadrant | DetID | PixID | Counts | Sigma | Mean | Median | Sigma |
| A | 10 | 83 | 1534128 | 10645.23 | 693 | 678 | 144.1 |
| A | 15 | 223 | 1341971 | 9311.28 | 693 | 678 | 144.1 |
| A | 7 | 3 | 65115 | 447.32 | 693 | 678 | 144.1 |
| B | 0 | 219 | 171714 | 1252.5 | 706 | 685 | 136.6 |
| B | 4 | 173 | 121875 | 887.51 | 706 | 685 | 136.6 |
| B | 0 | 200 | 107515 | 782.35 | 706 | 685 | 136.6 |
| C | 14 | 254 | 149266 | 915.44 | 694 | 698 | 162.3 |
| C | 12 | 249 | 92628 | 566.45 | 694 | 698 | 162.3 |
| C | 5 | 250 | 43862 | 265.97 | 694 | 698 | 162.3 |
| D | 2 | 249 | 806453 | 4769.96 | 676 | 656 | 168.9 |
| D | 2 | 120 | 638059 | 3773.15 | 676 | 656 | 168.9 |
| D | 1 | 52 | 482941 | 2854.91 | 676 | 656 | 168.9 |
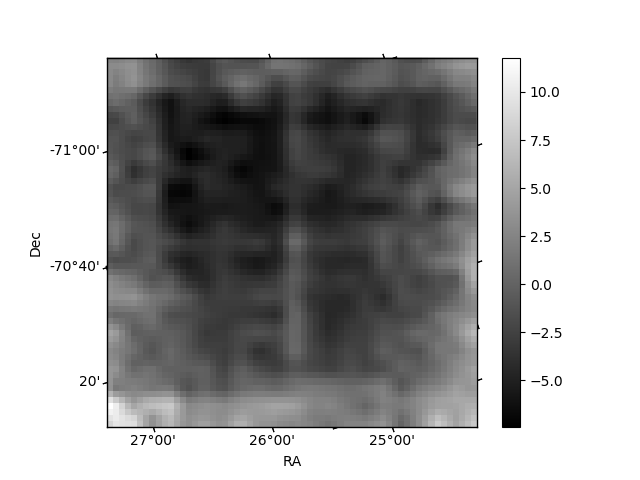
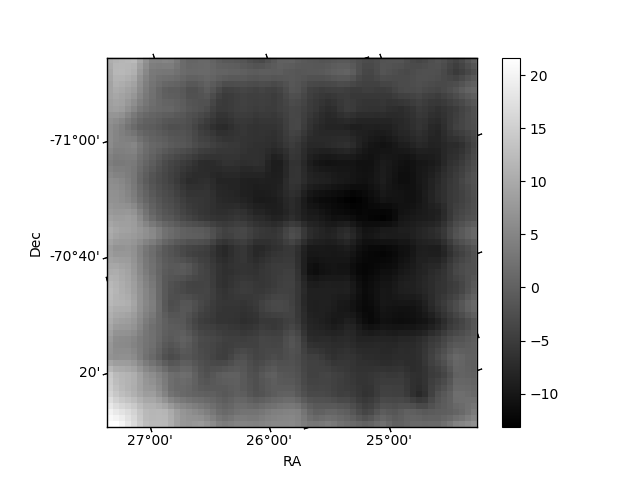
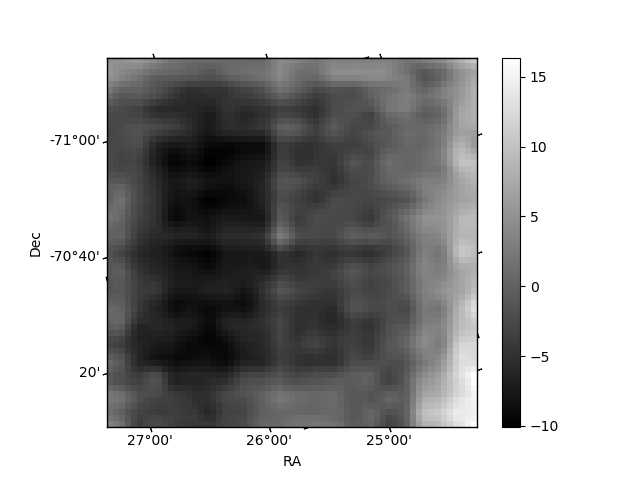
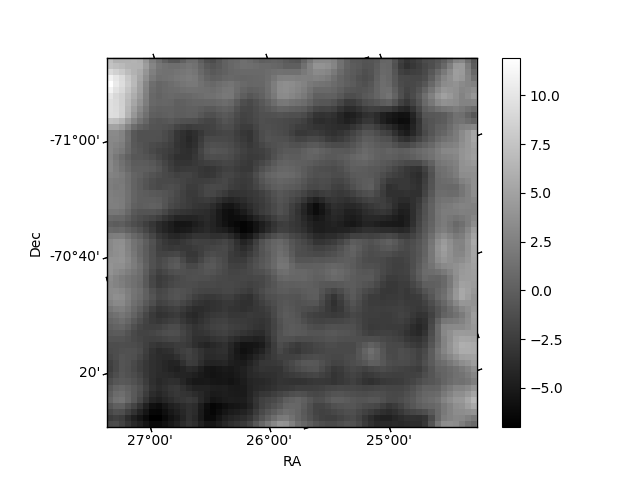
Histogram calculated using DETX and DETY for each event in the final _common_clean file
| Quadrant A | 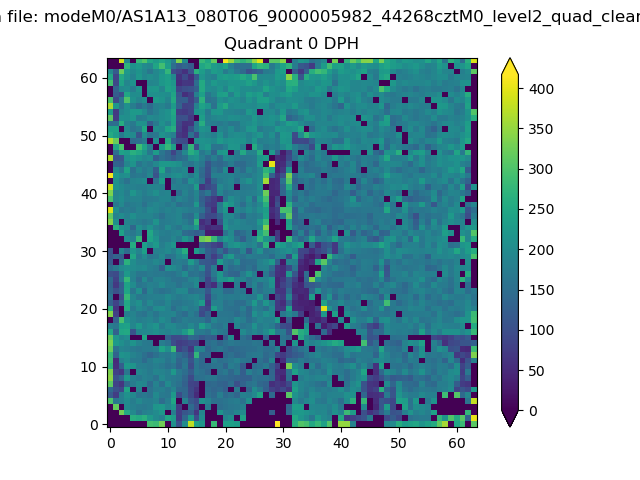 |
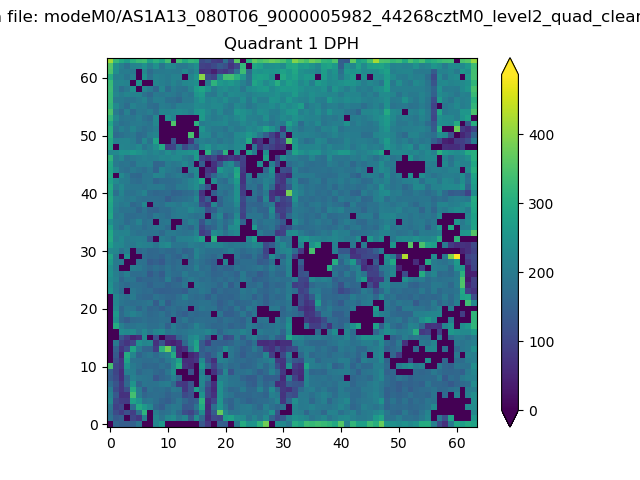 |
Quadrant B |
|---|---|---|---|
| Quadrant D | 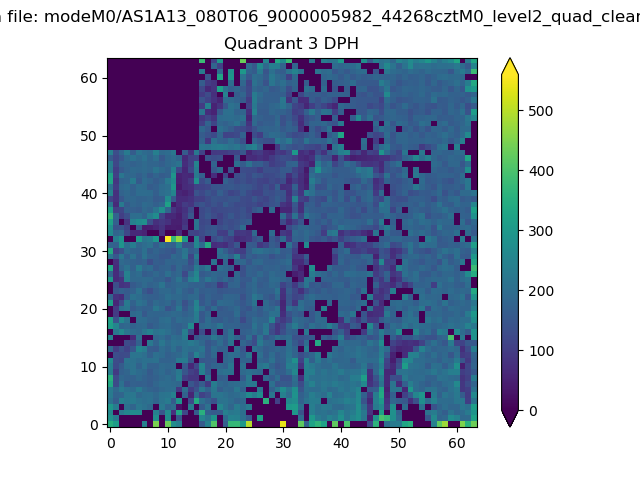 |
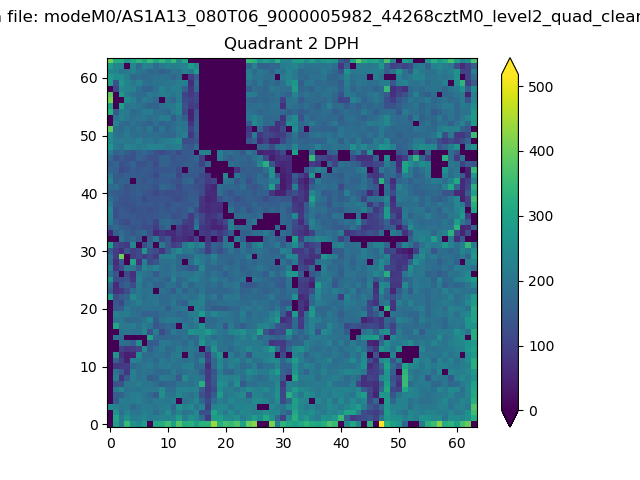 |
Quadrant C |
| Plot type | Count rate plots | Images |
|---|---|---|
| Comparison with Poisson distribution Blue bars denote a histogram of data divided into 1 sec bins. Red curve is a Poisson curve with rate = median count rate of data. |
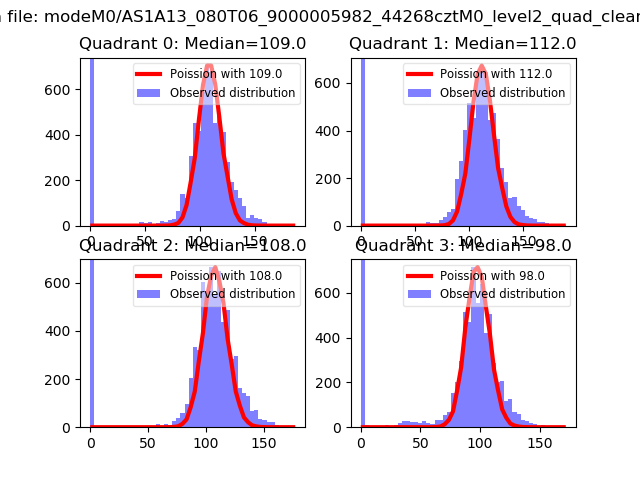 |
 |
| Quadrant-wise count rates Data is divided into 100 sec bins |
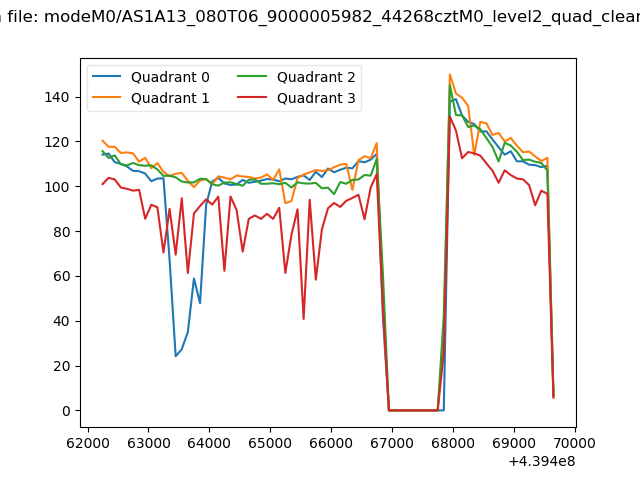 |
|
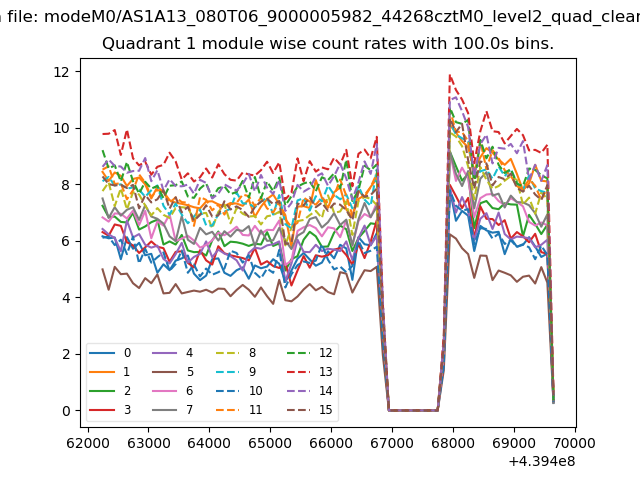
| Module-wise count rates for Quadrant A Data is divided into 100 sec bins |
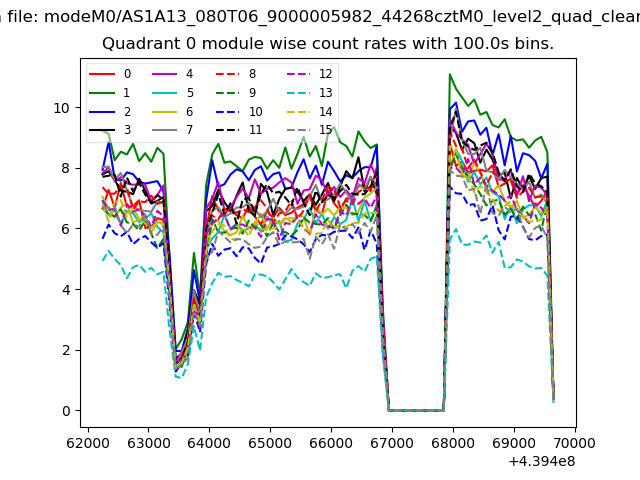 |
 |
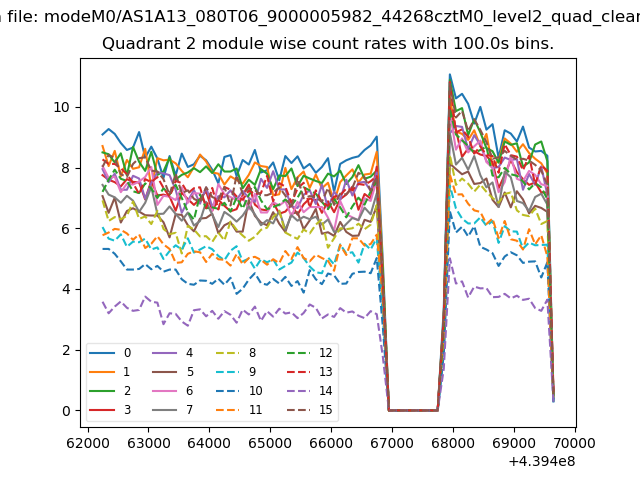
| Module-wise count rates for Quadrant B Data is divided into 100 sec bins |
 |
 |
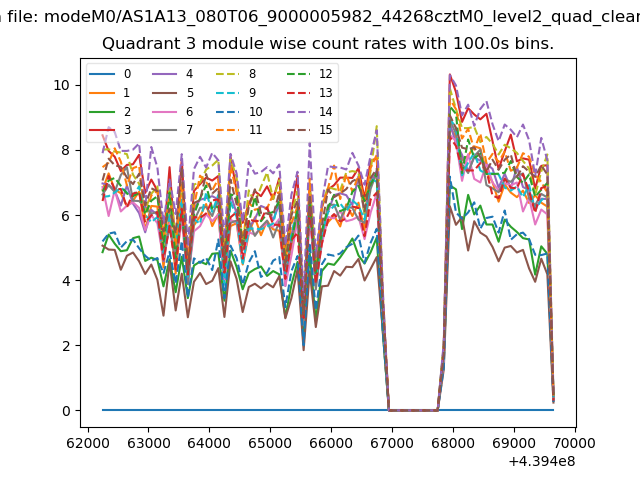
| Module-wise count rates for Quadrant C Data is divided into 100 sec bins |
 |
 |
| Module-wise count rates for Quadrant D Data is divided into 100 sec bins |
 |
 |
| Parameter | Plot |
|---|---|
| CZT HV Monitor | 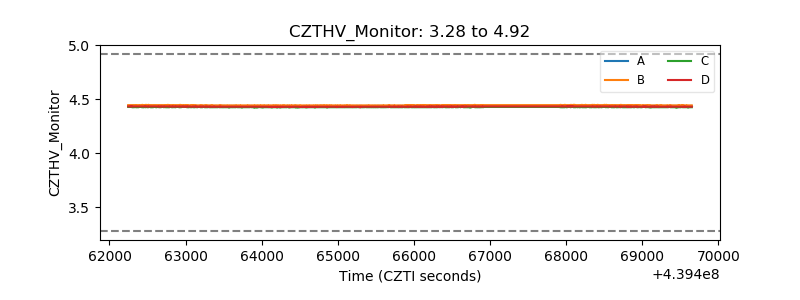 |
| D_VDD | 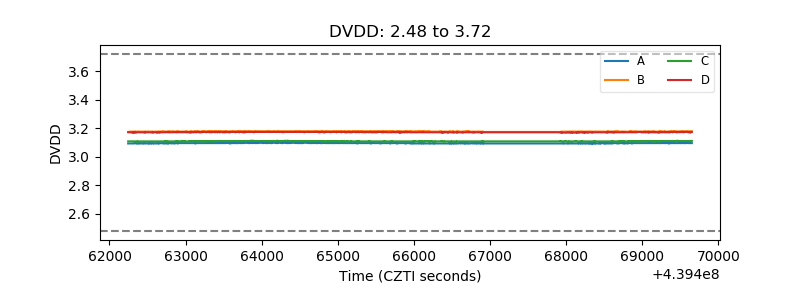 |
| Temperature 1 | 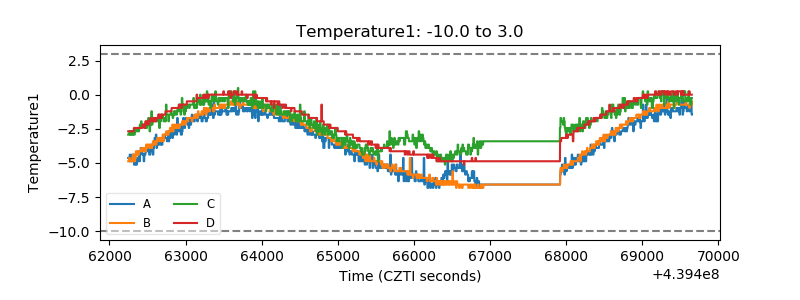 |
| Veto HV Monitor | 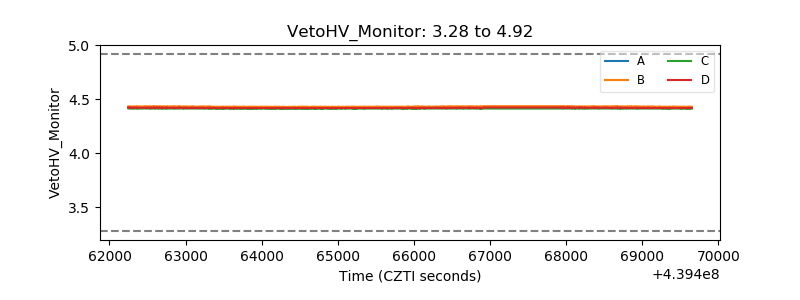 |
| Veto LLD | 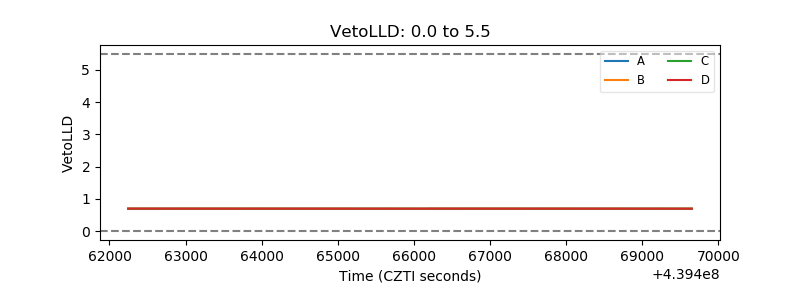 |
| Alpha Counter | 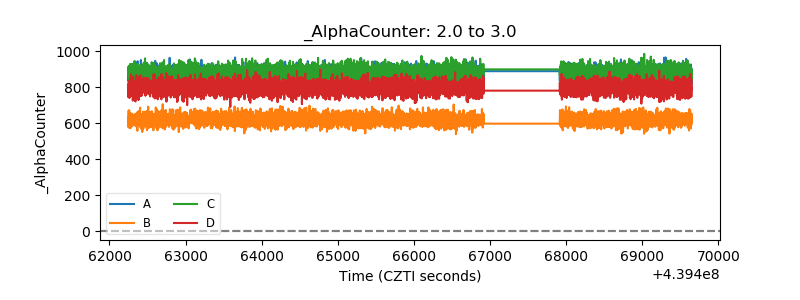 |
| _CPM_Rate | 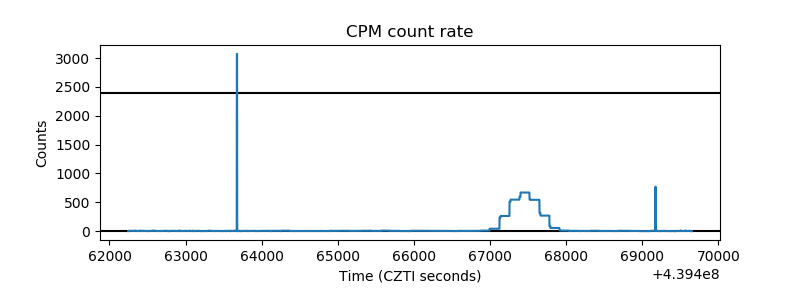 |
| CZT Counter | 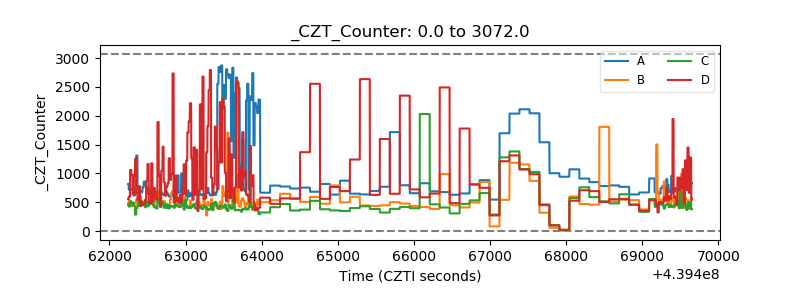 |
| +2.5 Volts monitor | 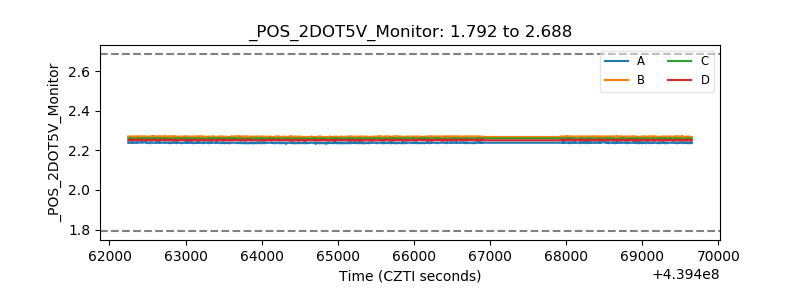 |
| +5 Volts monitor | 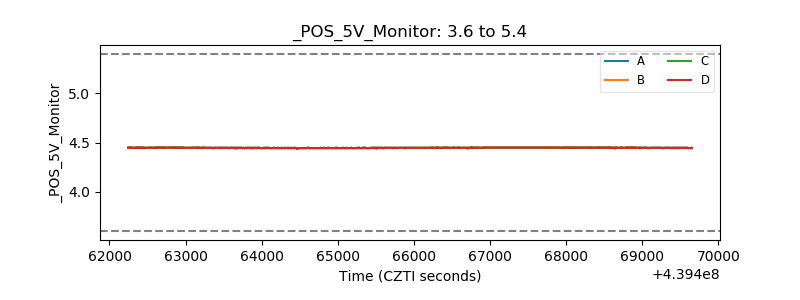 |
| _ROLL_ROT | 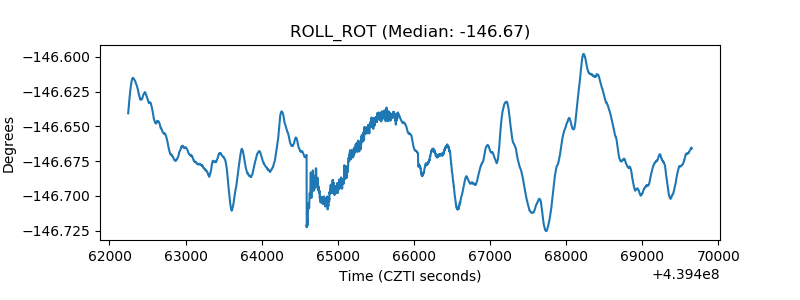 |
| _Roll_DEC | 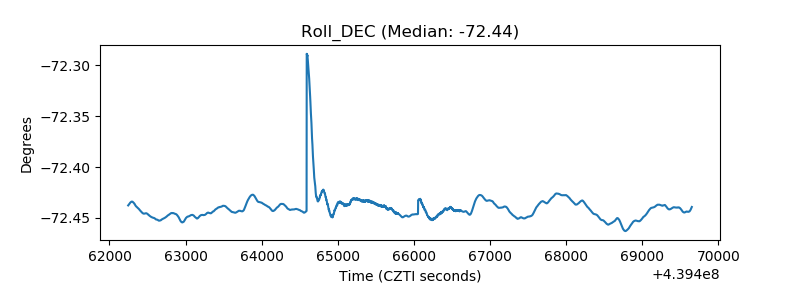 |
| _Roll_RA |  |
| Veto Counter | 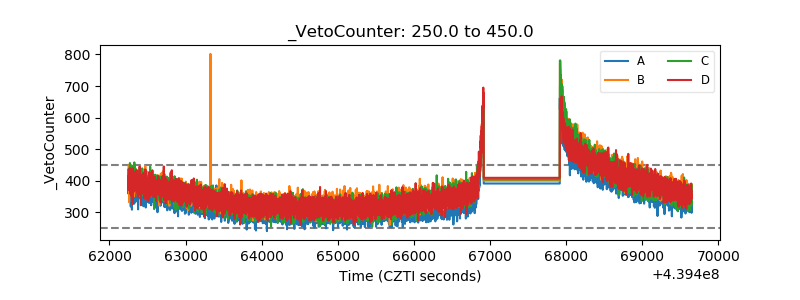 |