| Param | Original file | Final file |
|---|---|---|
| Filename | modeM0/AS1A13_080T06_9000005982_44270cztM0_level2.fits | modeM0/AS1A13_080T06_9000005982_44270cztM0_level2_quad_clean.evt |
| Size (bytes) | 663,693,120 | 95,532,480 |
| Size | 632.9 MB | 91.1 MB |
| Events in quadrant A | 11,437,024 | 382,845 |
| Events in quadrant B | 4,320,830 | 744,048 |
| Events in quadrant C | 3,075,046 | 711,062 |
| Events in quadrant D | 5,252,881 | 620,206 |
| Mode M0 | |||
|---|---|---|---|
| Quadrant | BADHDUFLAG | Total packets | Discarded packets |
| A | 0 | 38314 | 2 |
| B | 0 | 17144 | 1 |
| C | 0 | 13527 | 1 |
| D | 0 | 19920 | 1 |
| Mode M9 | |||
|---|---|---|---|
| Quadrant | BADHDUFLAG | Total packets | Discarded packets |
| A | 0 | 11 | 0 |
| B | 0 | 11 | 0 |
| C | 0 | 11 | 0 |
| D | 0 | 11 | 0 |
| Mode SS | |||
|---|---|---|---|
| Quadrant | BADHDUFLAG | Total packets | Discarded packets |
| A | 0 | 126 | 0 |
| B | 0 | 126 | 0 |
| C | 0 | 126 | 0 |
| D | 0 | 126 | 0 |
| Quadrant | Total seconds | Saturated seconds | Saturation percentage |
|---|---|---|---|
| A | 6216 | 3240 | 52.123552% |
| B | 6217 | 217 | 3.490429% |
| C | 6217 | 70 | 1.125945% |
| D | 6217 | 460 | 7.399067% |
Noise dominated data is calculated using 1-second bins in cleaned event files. If a bin has >2000 counts, and if more than 50% of those come from <1% of pixels, then it is considered to be noise-dominated and hence unusable.
| Quadrant | # 1 sec bins | Bins with >0 counts | Bins with >2000 counts | High rate bins dominated by noise | Noise dominated (total time) | Noise dominated (detector-on time) | Marked lightcurve |
|---|---|---|---|---|---|---|---|
| A | 7401 | 6217 | 2654 | 2654 | 35.86% | 42.69% | 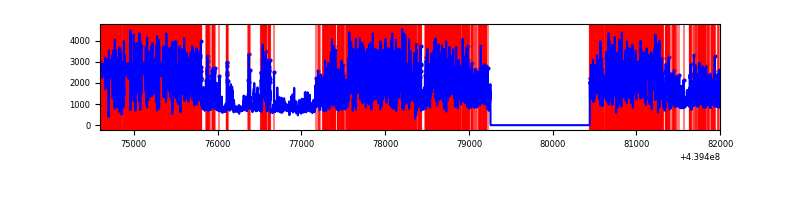 |
| B | 7402 | 6218 | 103 | 103 | 1.39% | 1.66% | 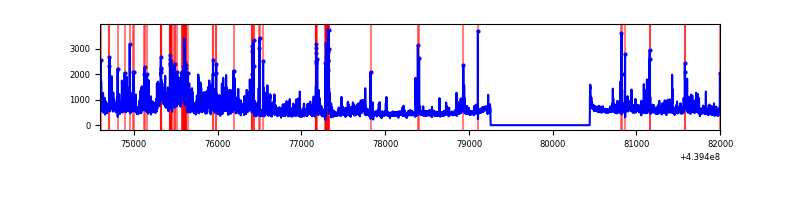 |
| C | 7402 | 6218 | 25 | 25 | 0.34% | 0.40% | 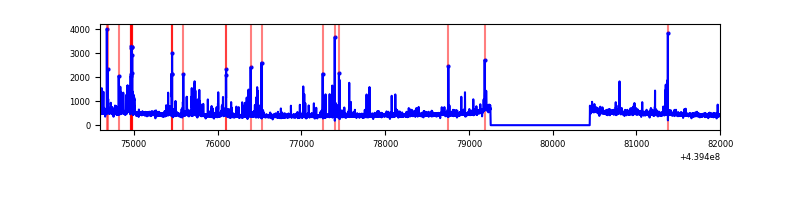 |
| D | 7402 | 6218 | 356 | 356 | 4.81% | 5.73% | 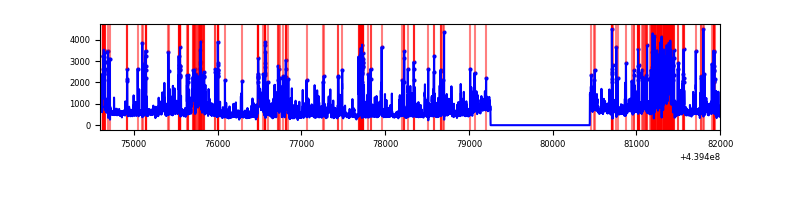 |
Top three noisy pixels from each quadrant. If the there are fewer than three noisy pixels in the level2.evt file, extra rows are filled as -1
| Pixel properties | Quadrant properties | ||||||
|---|---|---|---|---|---|---|---|
| Quadrant | DetID | PixID | Counts | Sigma | Mean | Median | Sigma |
| A | 15 | 223 | 7674210 | 68425.87 | 540 | 531 | 112.1 |
| A | 10 | 83 | 1313036 | 11703.55 | 540 | 531 | 112.1 |
| A | 13 | 248 | 267964 | 2384.69 | 540 | 531 | 112.1 |
| B | 0 | 200 | 556834 | 4145.15 | 708 | 690 | 134.2 |
| B | 5 | 235 | 221915 | 1648.87 | 708 | 690 | 134.2 |
| B | 4 | 173 | 147993 | 1097.9 | 708 | 690 | 134.2 |
| C | 12 | 250 | 89838 | 557.53 | 686 | 690 | 159.9 |
| C | 5 | 250 | 82995 | 514.74 | 686 | 690 | 159.9 |
| C | 4 | 254 | 76185 | 472.15 | 686 | 690 | 159.9 |
| D | 1 | 52 | 651570 | 3836.7 | 675 | 654 | 169.7 |
| D | 2 | 249 | 488171 | 2873.58 | 675 | 654 | 169.7 |
| D | 5 | 235 | 263672 | 1550.31 | 675 | 654 | 169.7 |
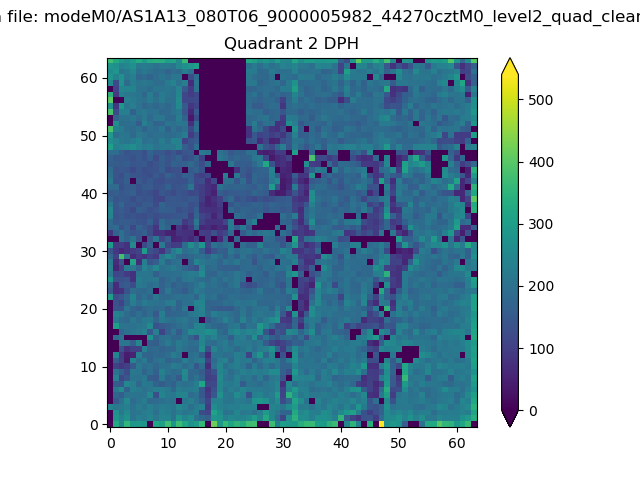
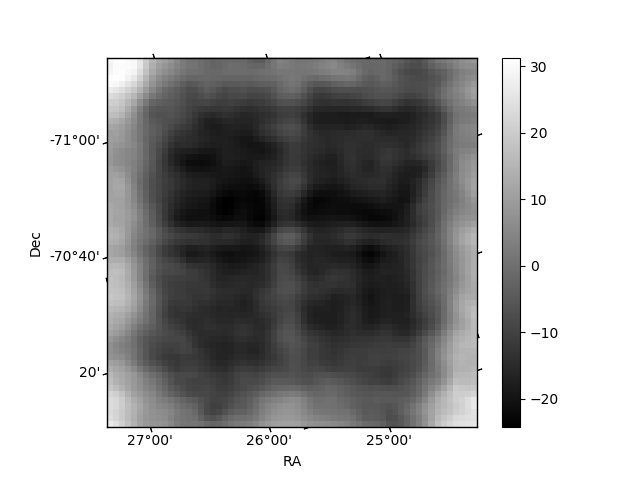
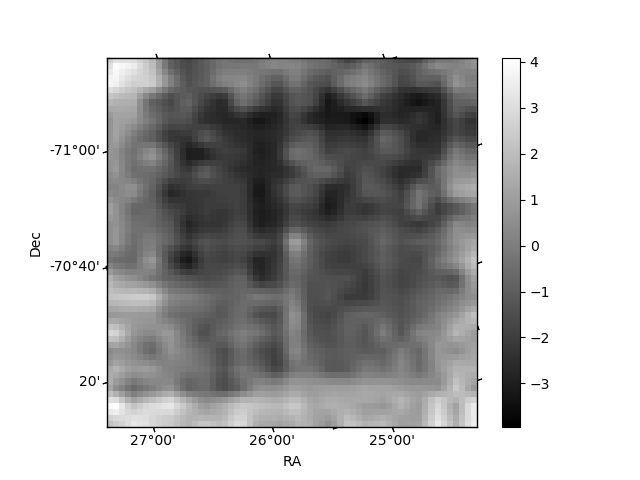
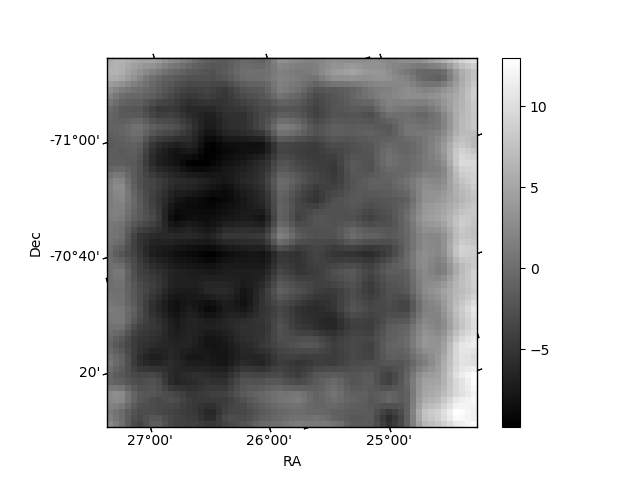
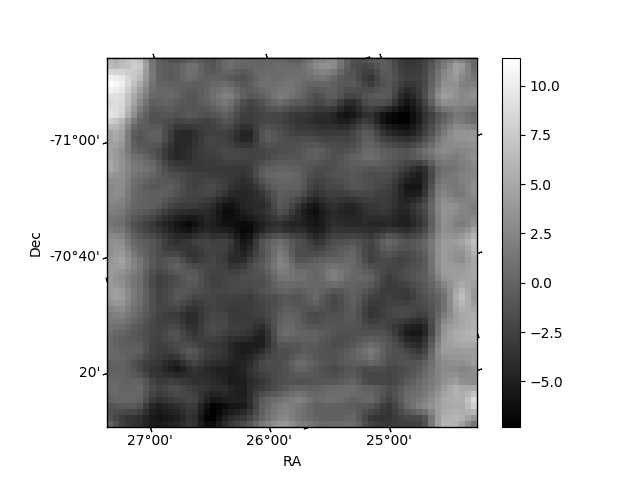
Histogram calculated using DETX and DETY for each event in the final _common_clean file
| Quadrant A | 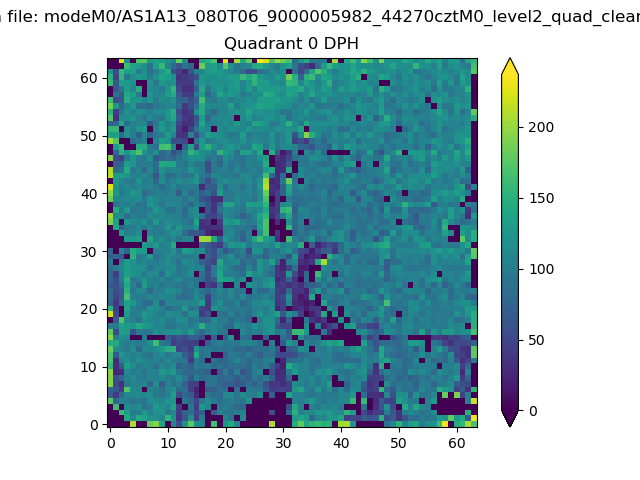 |
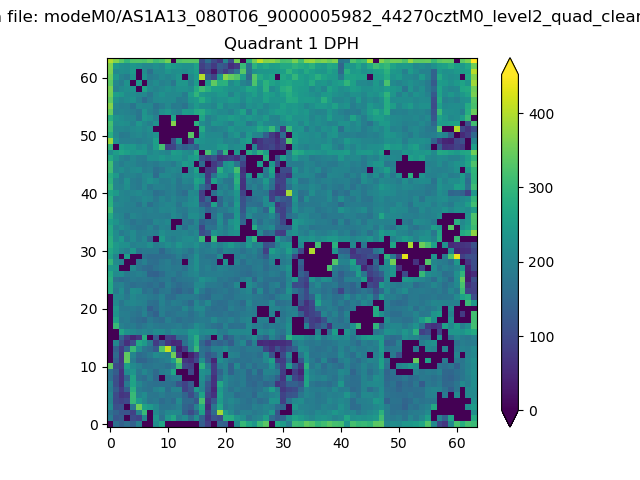 |
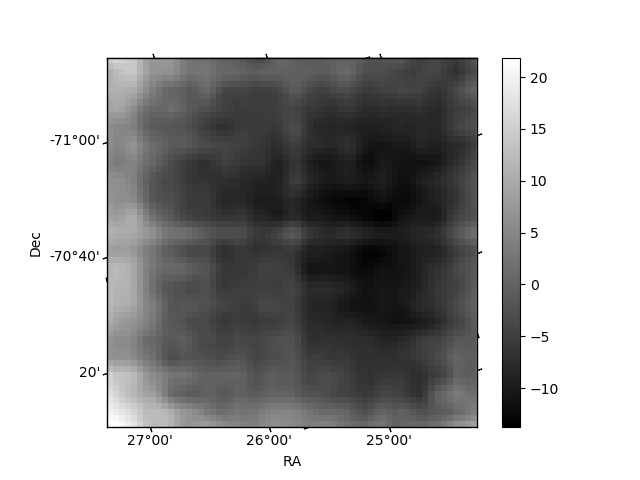
Quadrant B |
|---|---|---|---|
| Quadrant D | 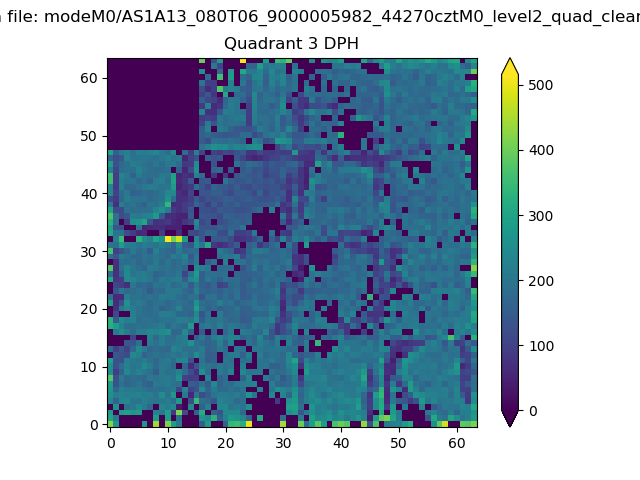 |
 |
Quadrant C |
| Plot type | Count rate plots | Images |
|---|---|---|
| Comparison with Poisson distribution Blue bars denote a histogram of data divided into 1 sec bins. Red curve is a Poisson curve with rate = median count rate of data. |
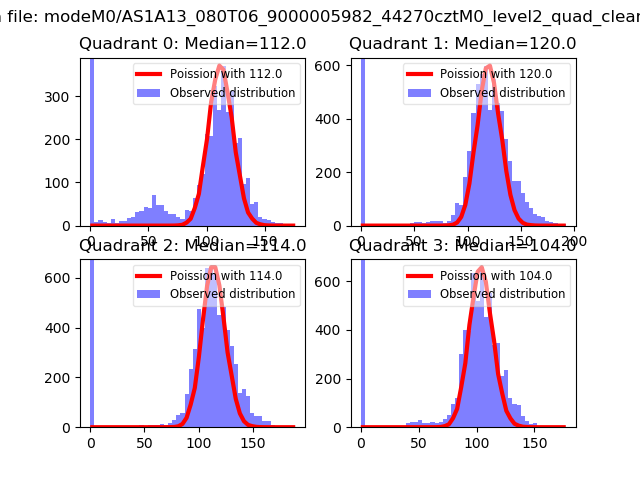 |
 |
| Quadrant-wise count rates Data is divided into 100 sec bins |
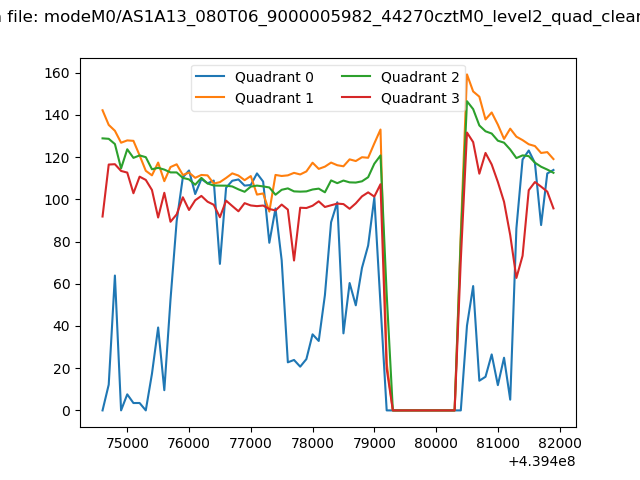 |
|
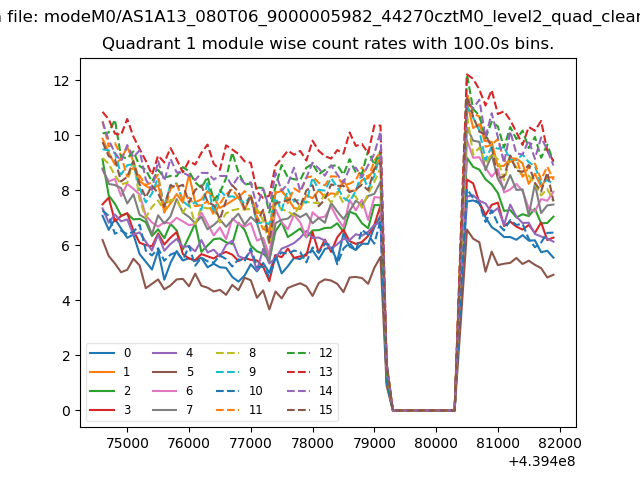
| Module-wise count rates for Quadrant A Data is divided into 100 sec bins |
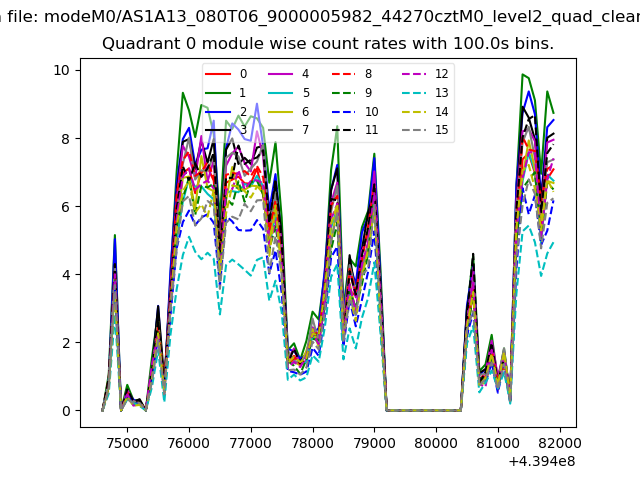 |
 |
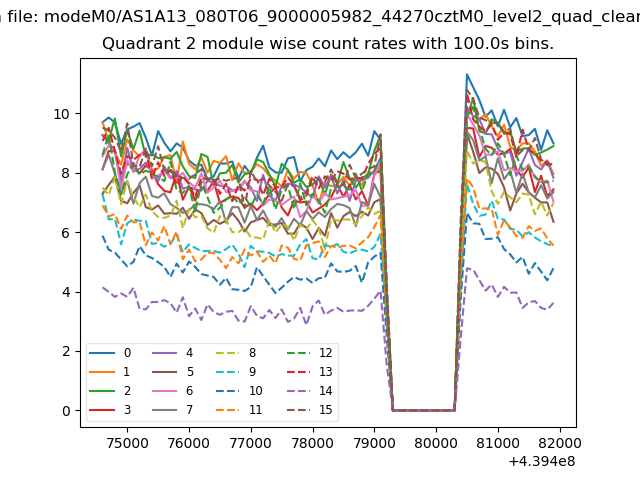
| Module-wise count rates for Quadrant B Data is divided into 100 sec bins |
 |
 |
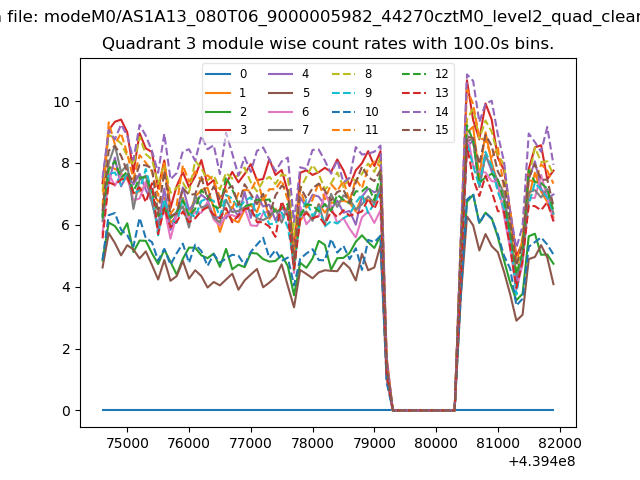
| Module-wise count rates for Quadrant C Data is divided into 100 sec bins |
 |
 |
| Module-wise count rates for Quadrant D Data is divided into 100 sec bins |
 |
 |
| Parameter | Plot |
|---|---|
| CZT HV Monitor | 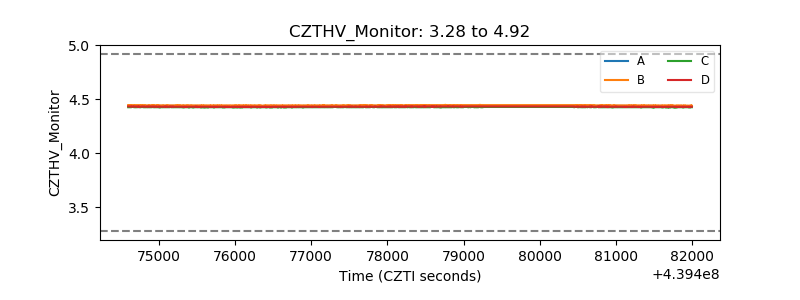 |
| D_VDD | 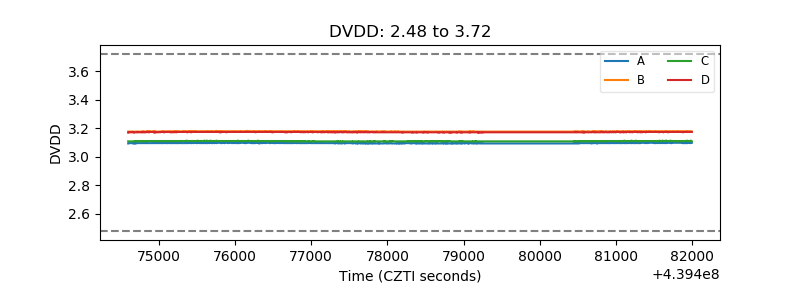 |
| Temperature 1 | 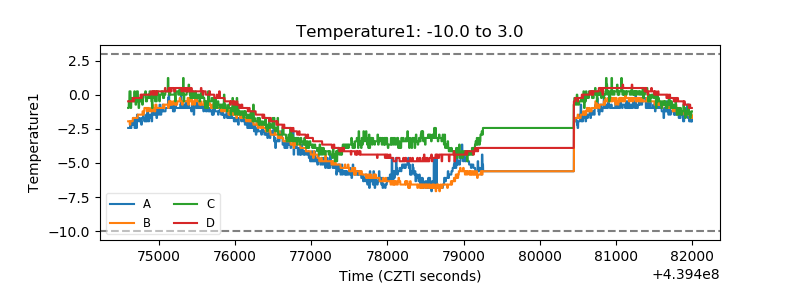 |
| Veto HV Monitor | 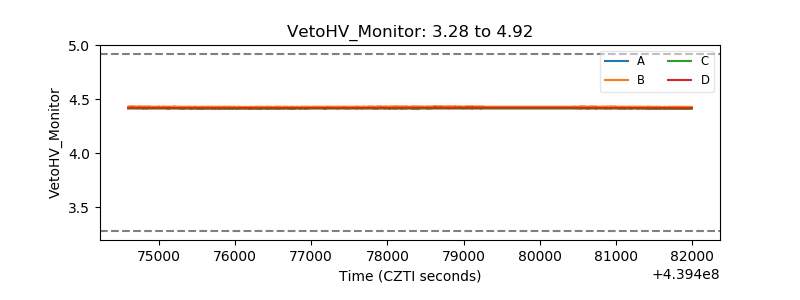 |
| Veto LLD | 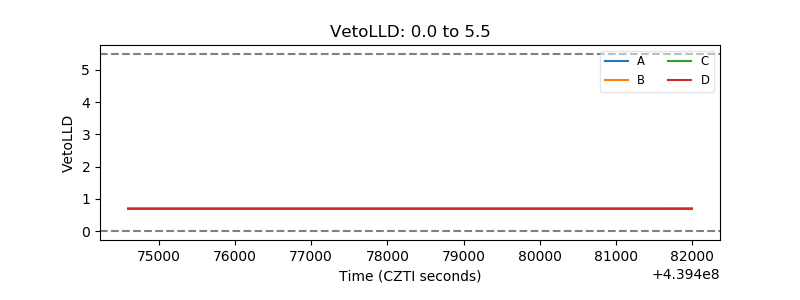 |
| Alpha Counter | 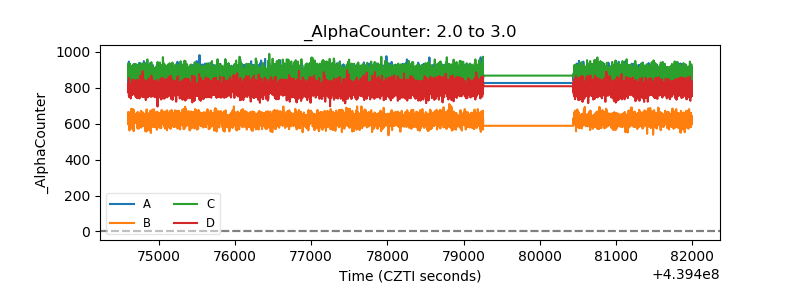 |
| _CPM_Rate | 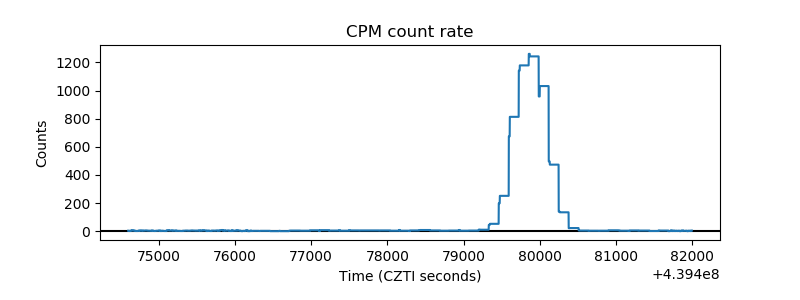 |
| CZT Counter |  |
| +2.5 Volts monitor | 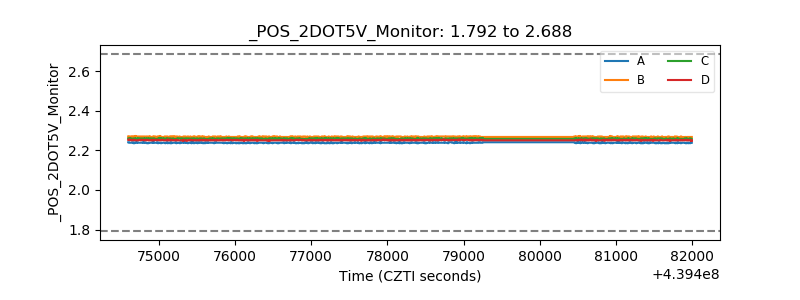 |
| +5 Volts monitor | 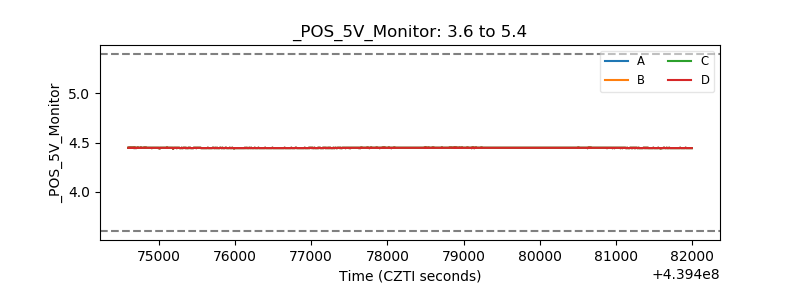 |
| _ROLL_ROT | 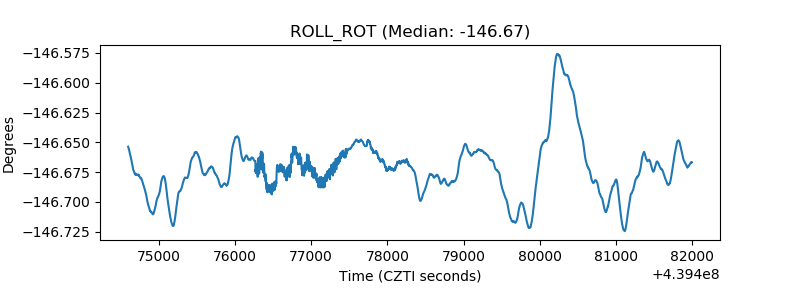 |
| _Roll_DEC | 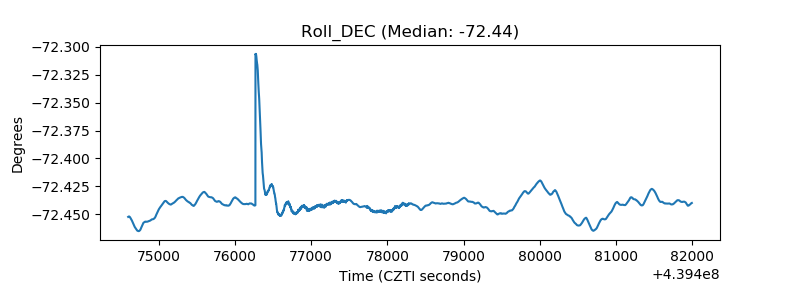 |
| _Roll_RA | 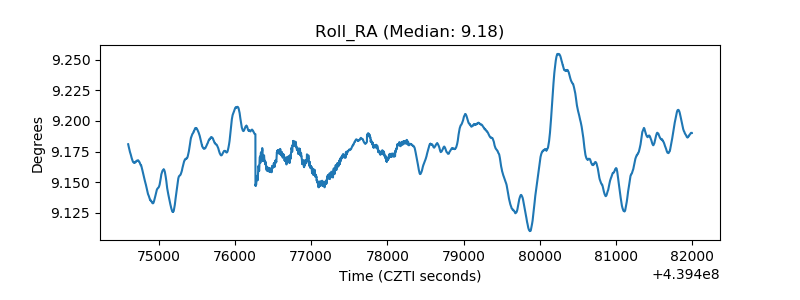 |
| Veto Counter | 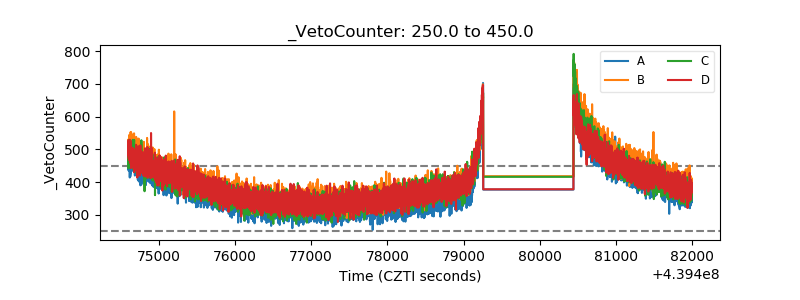 |