| Param | Original file | Final file |
|---|---|---|
| Filename | modeM0/AS1A13_012T08_9000005986_44289cztM0_level2.fits | modeM0/AS1A13_012T08_9000005986_44289cztM0_level2_quad_clean.evt |
| Size (bytes) | 569,442,240 | 117,650,880 |
| Size | 543.1 MB | 112.2 MB |
| Events in quadrant A | 6,599,550 | 770,227 |
| Events in quadrant B | 5,032,275 | 782,889 |
| Events in quadrant C | 3,364,415 | 791,849 |
| Events in quadrant D | 5,514,112 | 707,033 |
| Mode SS | |||
|---|---|---|---|
| Quadrant | BADHDUFLAG | Total packets | Discarded packets |
| A | 0 | 148 | 0 |
| B | 0 | 148 | 0 |
| C | 0 | 148 | 0 |
| D | 0 | 148 | 0 |
| Mode M9 | |||
|---|---|---|---|
| Quadrant | BADHDUFLAG | Total packets | Discarded packets |
| A | 0 | 4 | 0 |
| B | 0 | 4 | 0 |
| C | 0 | 4 | 0 |
| D | 0 | 4 | 0 |
| Mode M0 | |||
|---|---|---|---|
| Quadrant | BADHDUFLAG | Total packets | Discarded packets |
| A | 0 | 25068 | 1 |
| B | 0 | 19980 | 1 |
| C | 0 | 15355 | 1 |
| D | 0 | 21531 | 1 |
| Quadrant | Total seconds | Saturated seconds | Saturation percentage |
|---|---|---|---|
| A | 7332 | 595 | 8.115112% |
| B | 7332 | 574 | 7.828696% |
| C | 7332 | 59 | 0.804692% |
| D | 7332 | 434 | 5.919258% |
Noise dominated data is calculated using 1-second bins in cleaned event files. If a bin has >2000 counts, and if more than 50% of those come from <1% of pixels, then it is considered to be noise-dominated and hence unusable.
| Quadrant | # 1 sec bins | Bins with >0 counts | Bins with >2000 counts | High rate bins dominated by noise | Noise dominated (total time) | Noise dominated (detector-on time) | Marked lightcurve |
|---|---|---|---|---|---|---|---|
| A | 7682 | 7333 | 314 | 314 | 4.09% | 4.28% | 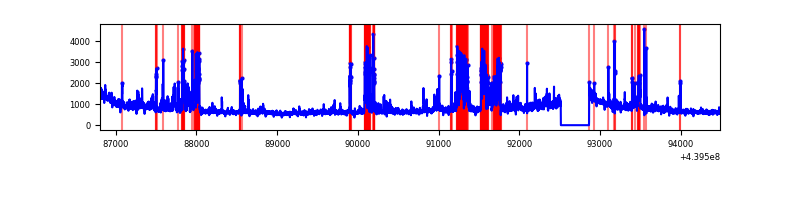 |
| B | 7682 | 7333 | 204 | 204 | 2.66% | 2.78% | 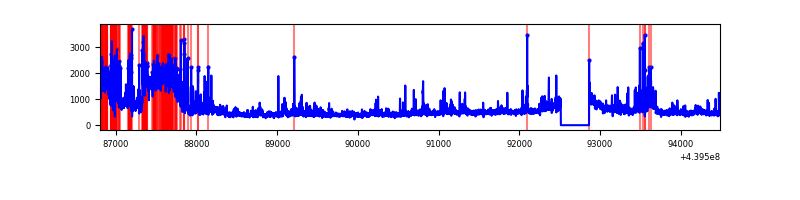 |
| C | 7682 | 7333 | 1 | 1 | 0.01% | 0.01% | 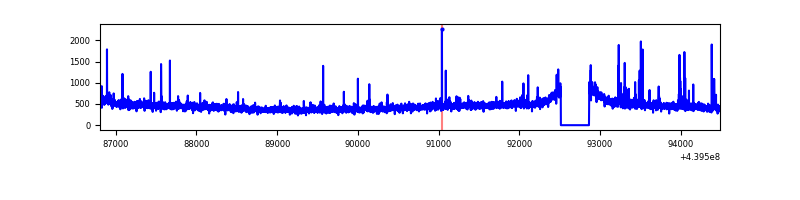 |
| D | 7682 | 7333 | 277 | 277 | 3.61% | 3.78% | 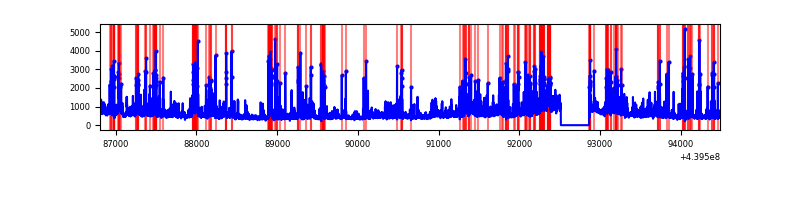 |
Top three noisy pixels from each quadrant. If the there are fewer than three noisy pixels in the level2.evt file, extra rows are filled as -1
| Pixel properties | Quadrant properties | ||||||
|---|---|---|---|---|---|---|---|
| Quadrant | DetID | PixID | Counts | Sigma | Mean | Median | Sigma |
| A | 15 | 223 | 1717659 | 10067.61 | 824 | 806 | 170.5 |
| A | 10 | 83 | 1643456 | 9632.48 | 824 | 806 | 170.5 |
| A | 13 | 248 | 24868 | 141.1 | 824 | 806 | 170.5 |
| B | 5 | 235 | 998565 | 6031.93 | 828 | 801 | 165.4 |
| B | 0 | 219 | 224909 | 1354.83 | 828 | 801 | 165.4 |
| B | 0 | 155 | 152455 | 916.82 | 828 | 801 | 165.4 |
| C | 14 | 254 | 62835 | 316.45 | 830 | 833 | 195.9 |
| C | 1 | 3 | 42325 | 211.77 | 830 | 833 | 195.9 |
| C | 3 | 233 | 22322 | 109.68 | 830 | 833 | 195.9 |
| D | 1 | 52 | 520041 | 2525.84 | 814 | 788 | 205.6 |
| D | 5 | 222 | 499154 | 2424.24 | 814 | 788 | 205.6 |
| D | 5 | 235 | 414449 | 2012.2 | 814 | 788 | 205.6 |
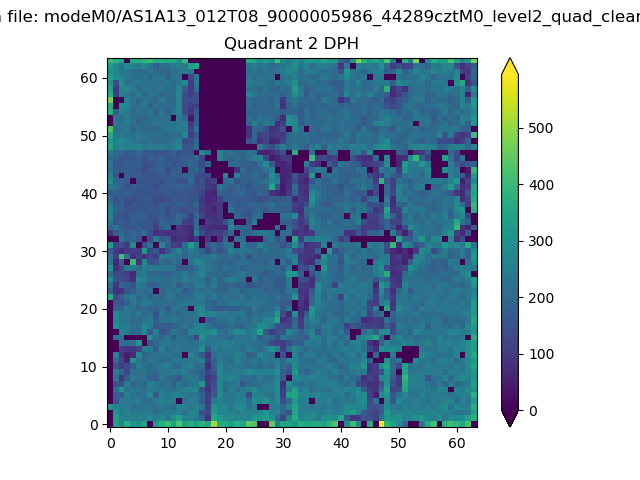
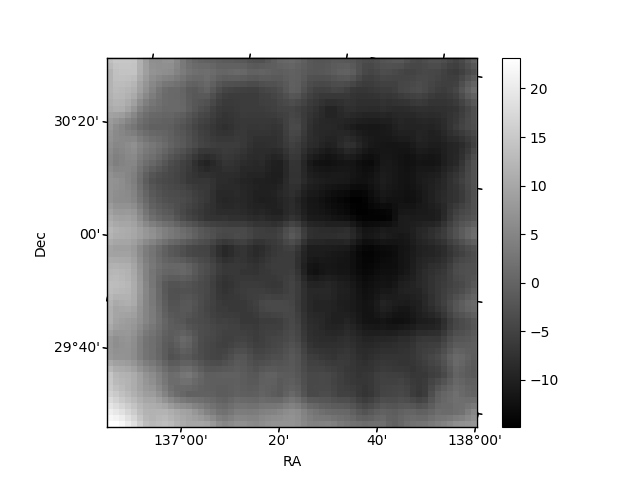
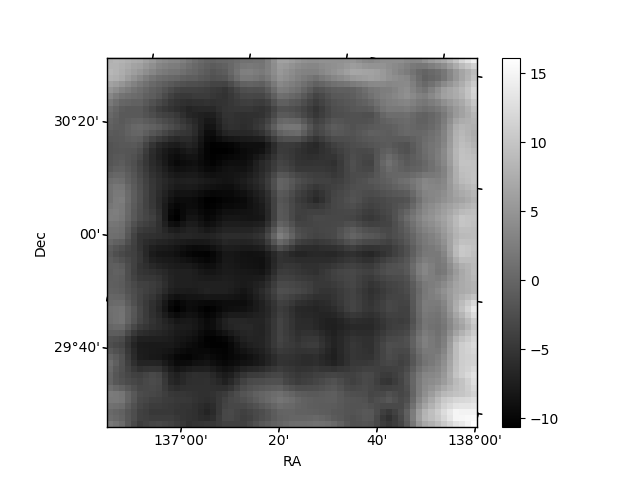
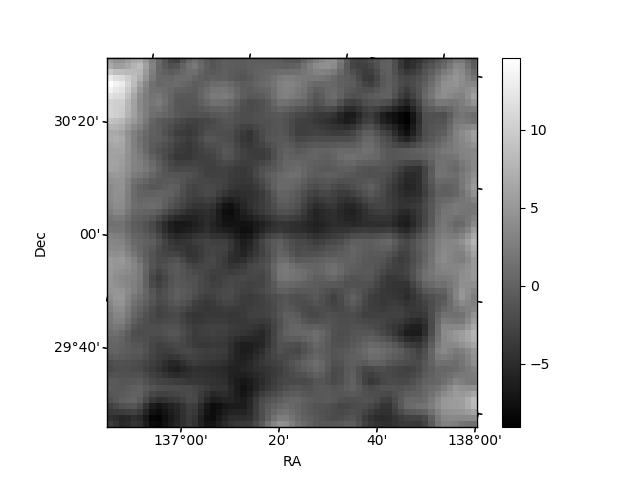
Histogram calculated using DETX and DETY for each event in the final _common_clean file
| Quadrant A | 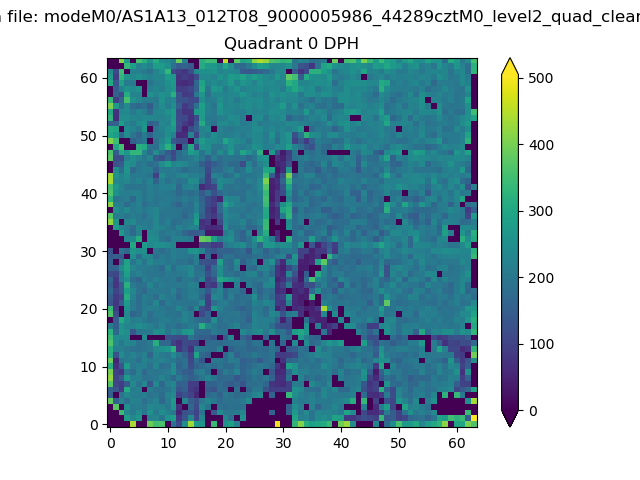 |
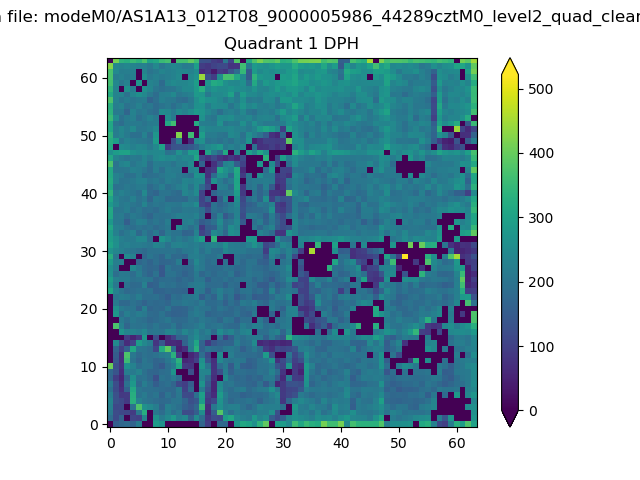 |
Quadrant B |
|---|---|---|---|
| Quadrant D | 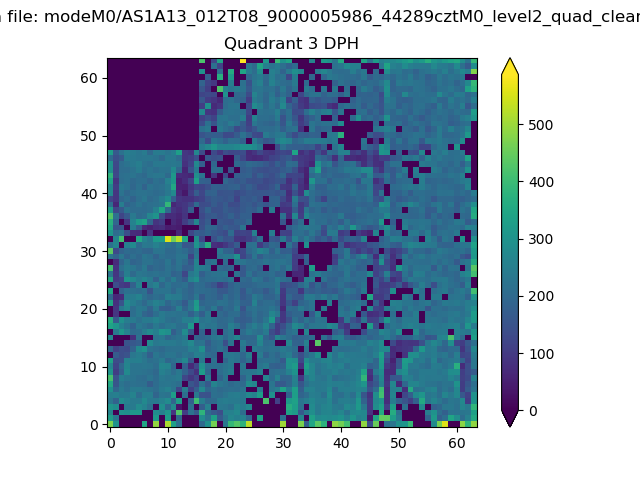 |
 |
Quadrant C |
| Plot type | Count rate plots | Images |
|---|---|---|
| Comparison with Poisson distribution Blue bars denote a histogram of data divided into 1 sec bins. Red curve is a Poisson curve with rate = median count rate of data. |
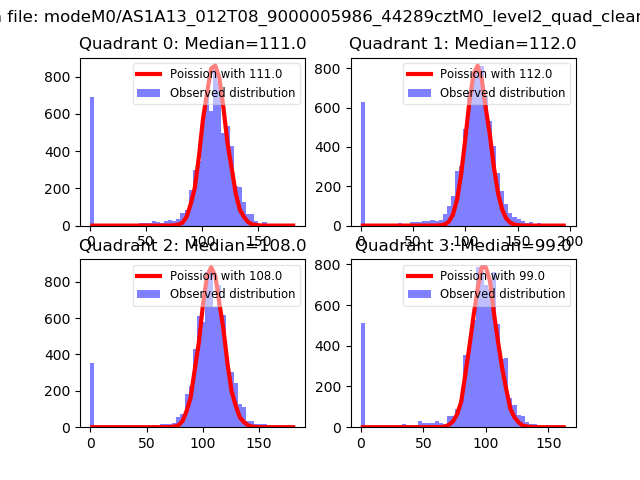 |
 |
| Quadrant-wise count rates Data is divided into 100 sec bins |
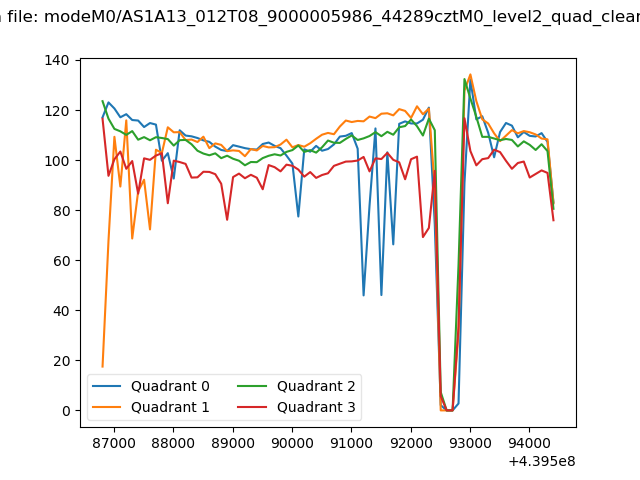 |
|
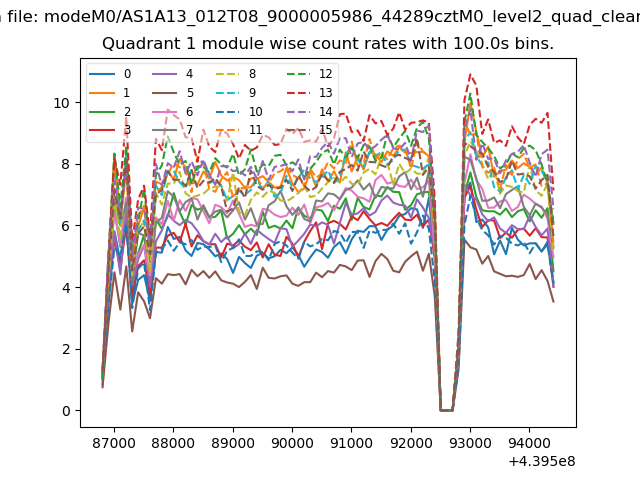
| Module-wise count rates for Quadrant A Data is divided into 100 sec bins |
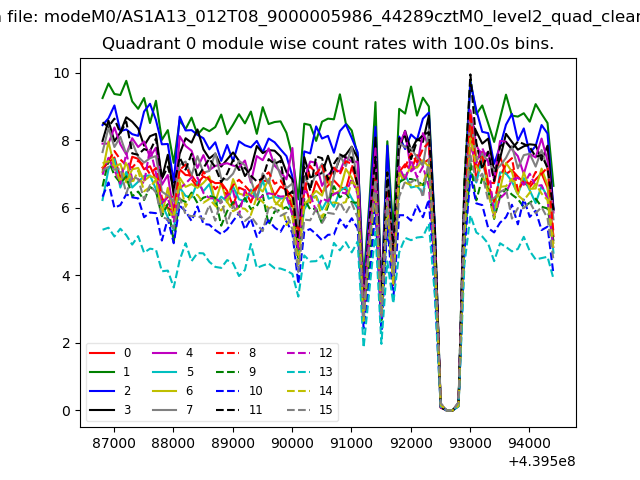 |
 |
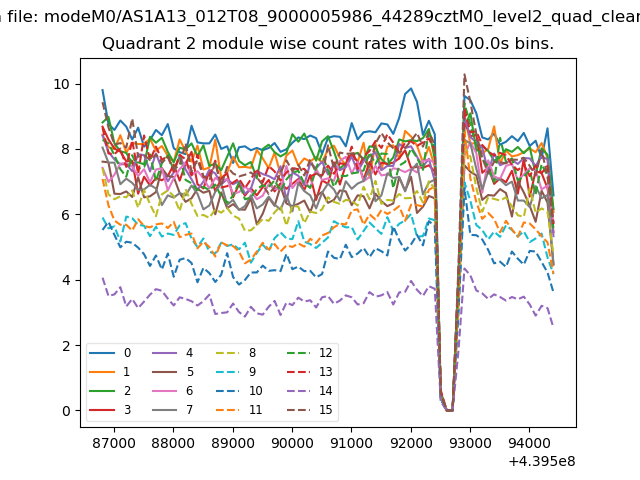
| Module-wise count rates for Quadrant B Data is divided into 100 sec bins |
 |
 |
| Module-wise count rates for Quadrant C Data is divided into 100 sec bins |
 |
 |
| Module-wise count rates for Quadrant D Data is divided into 100 sec bins |
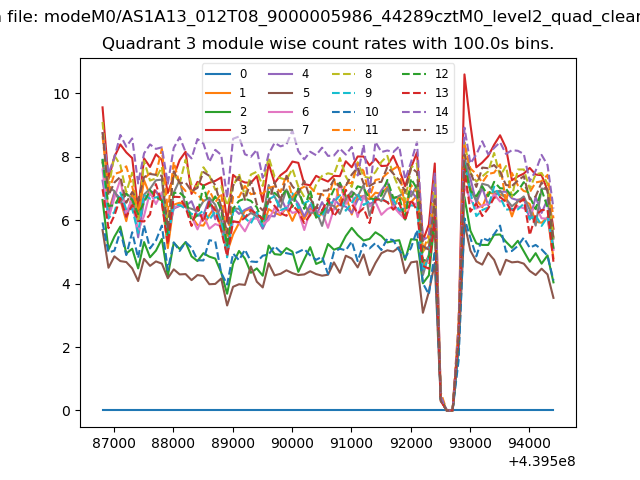 |
 |
| Parameter | Plot |
|---|---|
| CZT HV Monitor | 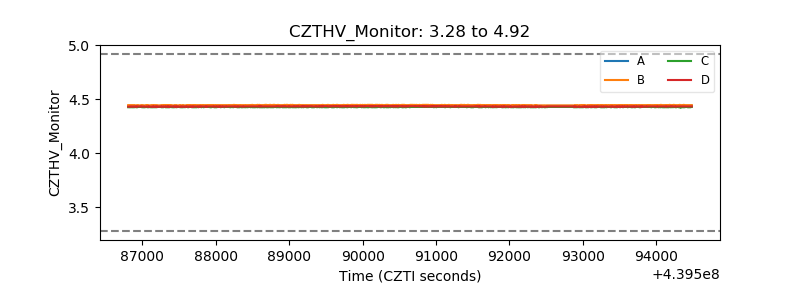 |
| D_VDD | 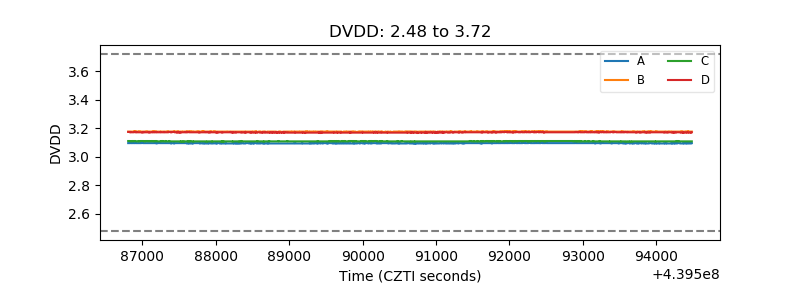 |
| Temperature 1 | 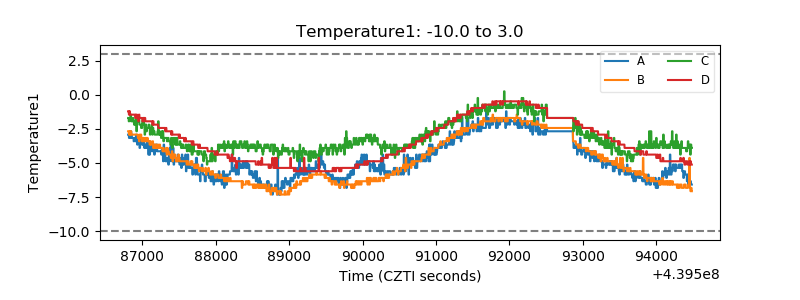 |
| Veto HV Monitor | 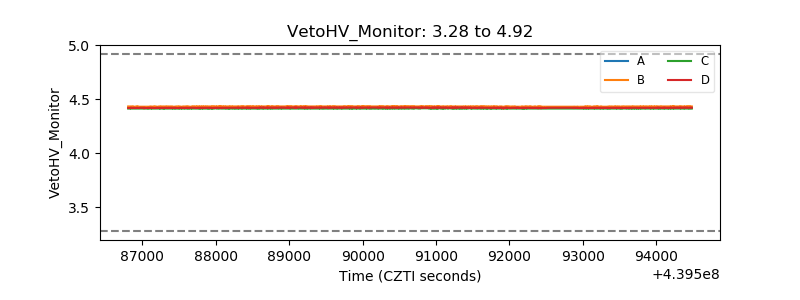 |
| Veto LLD | 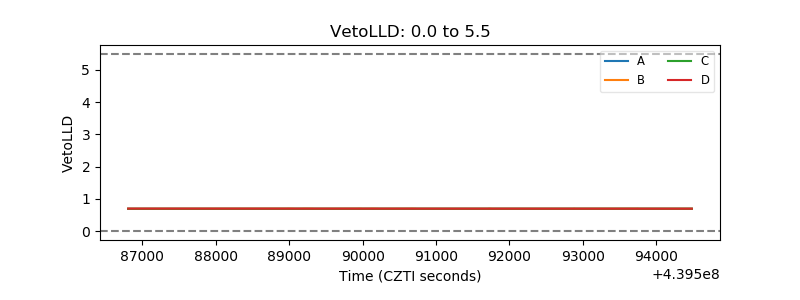 |
| Alpha Counter | 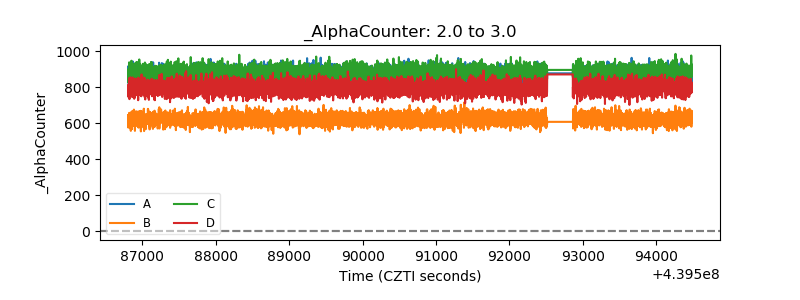 |
| _CPM_Rate | 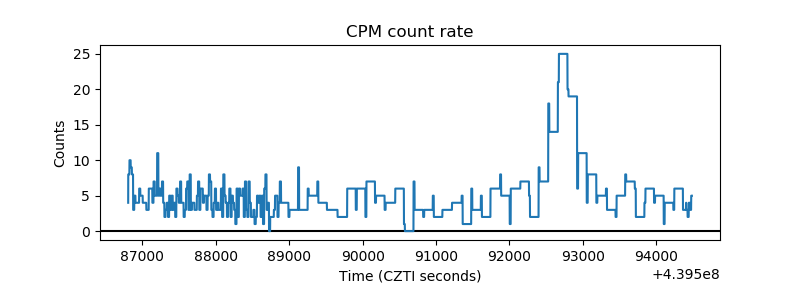 |
| CZT Counter | 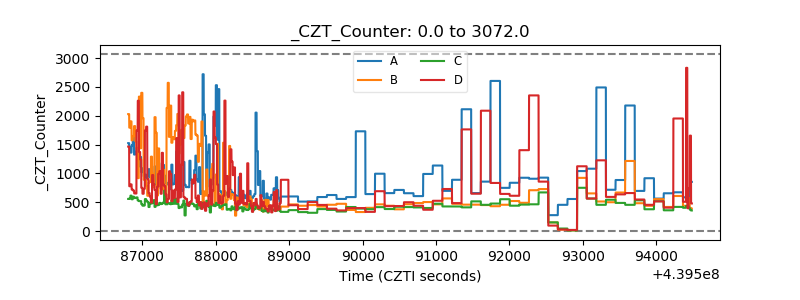 |
| +2.5 Volts monitor | 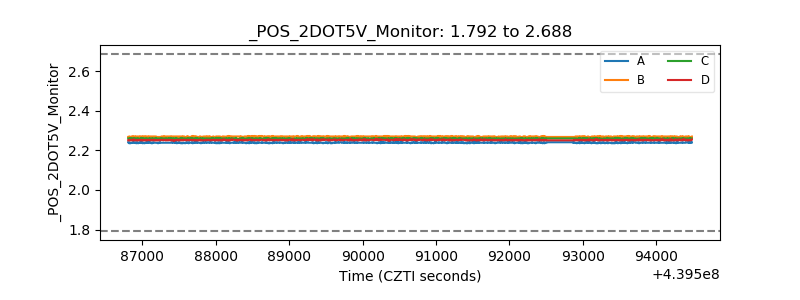 |
| +5 Volts monitor | 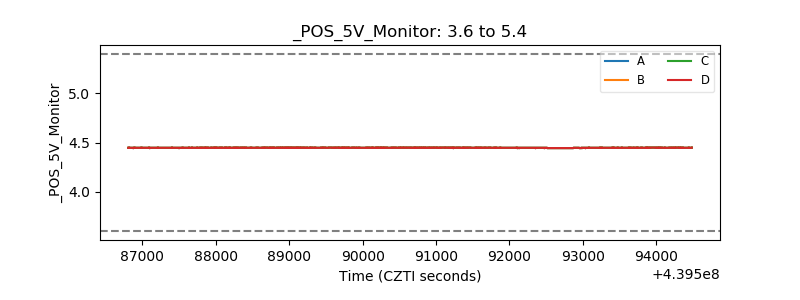 |
| _ROLL_ROT | 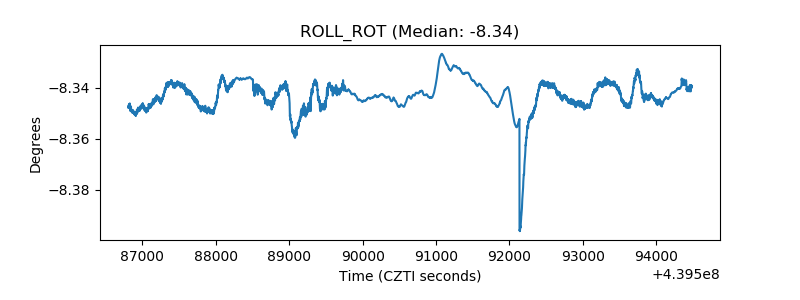 |
| _Roll_DEC | 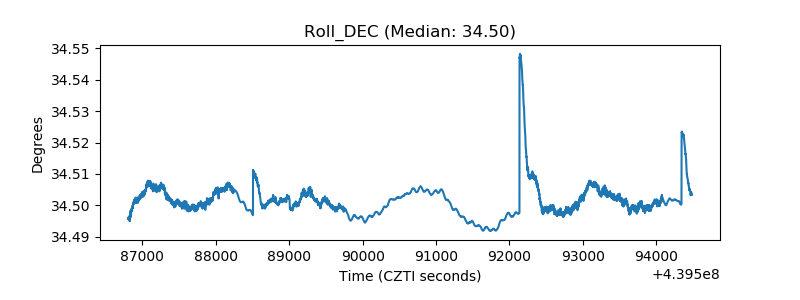 |
| _Roll_RA |  |
| Veto Counter | 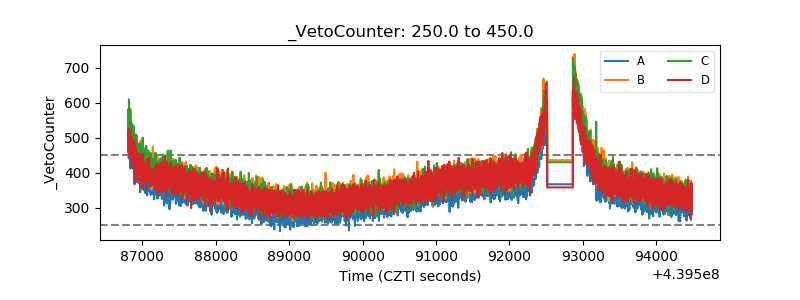 |