| Param | Original file | Final file |
|---|---|---|
| Filename | modeM0/AS1A13_012T08_9000005986_44290cztM0_level2.fits | modeM0/AS1A13_012T08_9000005986_44290cztM0_level2_quad_clean.evt |
| Size (bytes) | 556,211,520 | 128,782,080 |
| Size | 530.4 MB | 122.8 MB |
| Events in quadrant A | 5,646,234 | 869,046 |
| Events in quadrant B | 4,426,402 | 883,422 |
| Events in quadrant C | 3,820,730 | 847,967 |
| Events in quadrant D | 6,081,526 | 748,478 |
| Mode SS | |||
|---|---|---|---|
| Quadrant | BADHDUFLAG | Total packets | Discarded packets |
| A | 0 | 158 | 0 |
| B | 0 | 158 | 0 |
| C | 0 | 158 | 0 |
| D | 0 | 158 | 0 |
| Mode M9 | |||
|---|---|---|---|
| Quadrant | BADHDUFLAG | Total packets | Discarded packets |
| A | 0 | 2 | 0 |
| B | 0 | 3 | 0 |
| C | 0 | 3 | 0 |
| D | 0 | 3 | 0 |
| Mode M0 | |||
|---|---|---|---|
| Quadrant | BADHDUFLAG | Total packets | Discarded packets |
| A | 0 | 22539 | 1 |
| B | 0 | 18493 | 1 |
| C | 0 | 17162 | 1 |
| D | 0 | 23713 | 1 |
| Quadrant | Total seconds | Saturated seconds | Saturation percentage |
|---|---|---|---|
| A | 7916 | 185 | 2.337039% |
| B | 7916 | 196 | 2.475998% |
| C | 7916 | 60 | 0.757959% |
| D | 7916 | 565 | 7.137443% |
Noise dominated data is calculated using 1-second bins in cleaned event files. If a bin has >2000 counts, and if more than 50% of those come from <1% of pixels, then it is considered to be noise-dominated and hence unusable.
| Quadrant | # 1 sec bins | Bins with >0 counts | Bins with >2000 counts | High rate bins dominated by noise | Noise dominated (total time) | Noise dominated (detector-on time) | Marked lightcurve |
|---|---|---|---|---|---|---|---|
| A | 7916 | 7916 | 32 | 32 | 0.40% | 0.40% | 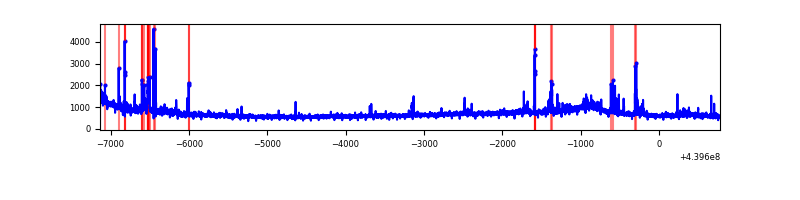 |
| B | 7916 | 7916 | 42 | 42 | 0.53% | 0.53% | 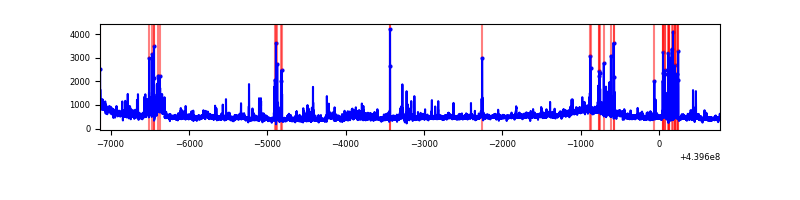 |
| C | 7916 | 7916 | 22 | 22 | 0.28% | 0.28% | 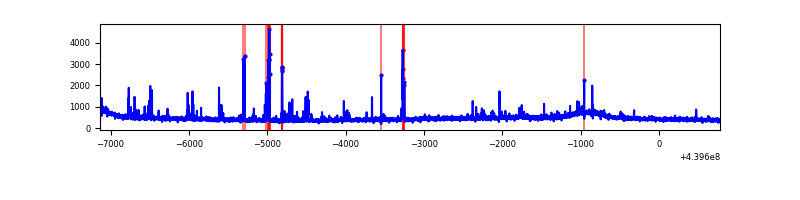 |
| D | 7916 | 7916 | 405 | 405 | 5.12% | 5.12% | 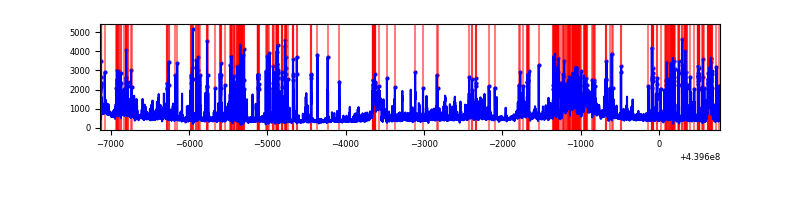 |
Top three noisy pixels from each quadrant. If the there are fewer than three noisy pixels in the level2.evt file, extra rows are filled as -1
| Pixel properties | Quadrant properties | ||||||
|---|---|---|---|---|---|---|---|
| Quadrant | DetID | PixID | Counts | Sigma | Mean | Median | Sigma |
| A | 10 | 83 | 1668153 | 8698.92 | 915 | 894 | 191.7 |
| A | 15 | 223 | 361306 | 1880.45 | 915 | 894 | 191.7 |
| A | 13 | 248 | 50786 | 260.31 | 915 | 894 | 191.7 |
| B | 5 | 172 | 146867 | 793.33 | 915 | 885 | 184.0 |
| B | 0 | 219 | 145192 | 784.23 | 915 | 885 | 184.0 |
| B | 0 | 229 | 119830 | 646.4 | 915 | 885 | 184.0 |
| C | 14 | 254 | 227819 | 1062.06 | 901 | 906 | 213.7 |
| C | 1 | 3 | 57993 | 267.19 | 901 | 906 | 213.7 |
| C | 3 | 233 | 13830 | 60.49 | 901 | 906 | 213.7 |
| D | 1 | 52 | 611000 | 2766.14 | 877 | 851 | 220.6 |
| D | 13 | 249 | 464711 | 2102.93 | 877 | 851 | 220.6 |
| D | 5 | 235 | 388724 | 1758.44 | 877 | 851 | 220.6 |
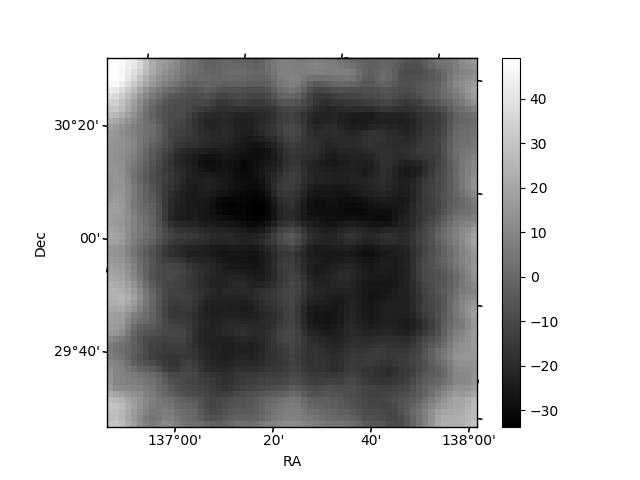
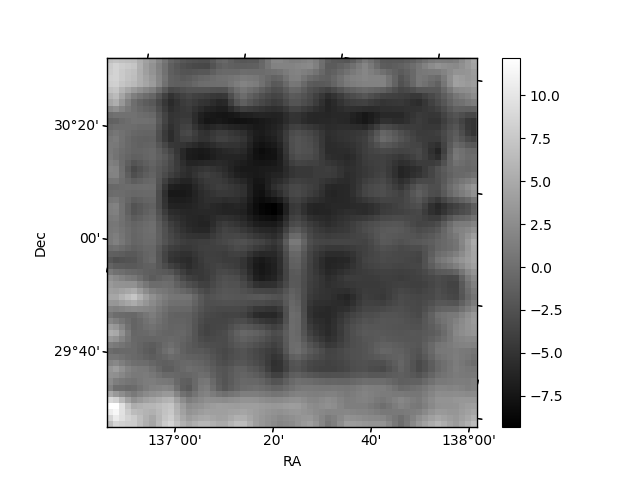
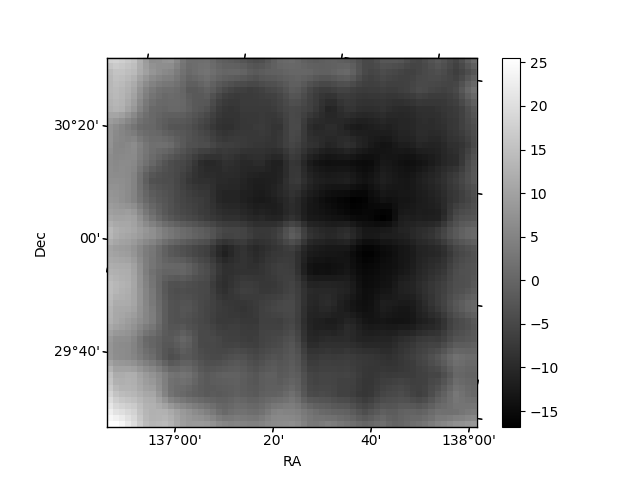
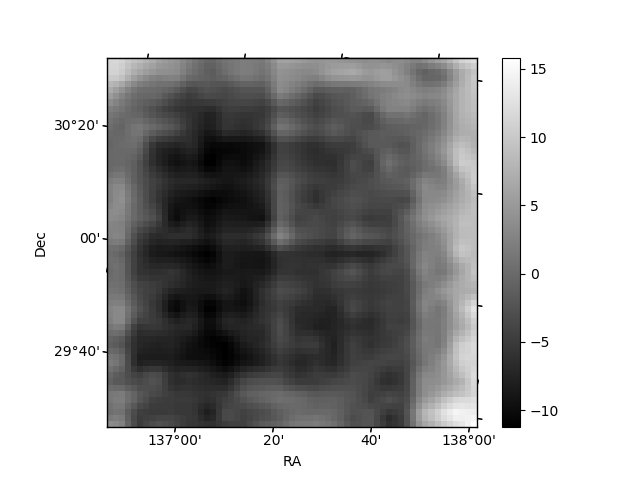
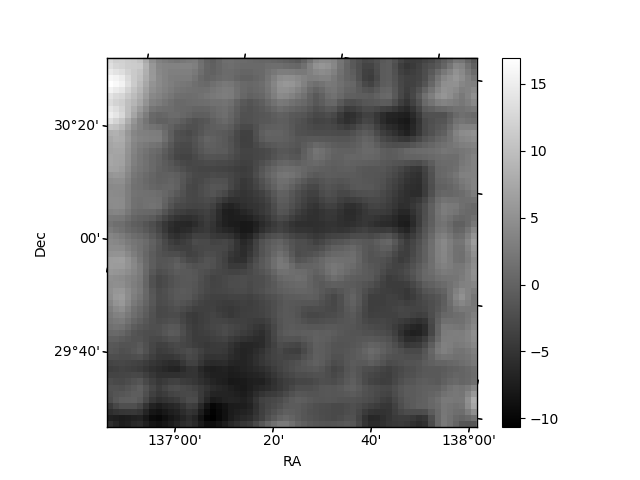
Histogram calculated using DETX and DETY for each event in the final _common_clean file
| Quadrant A | 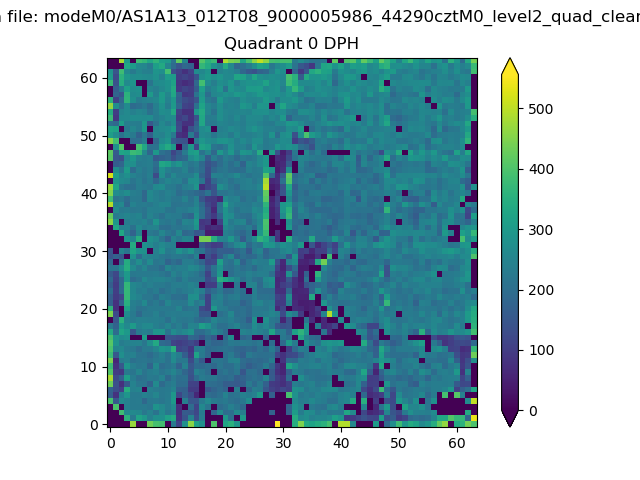 |
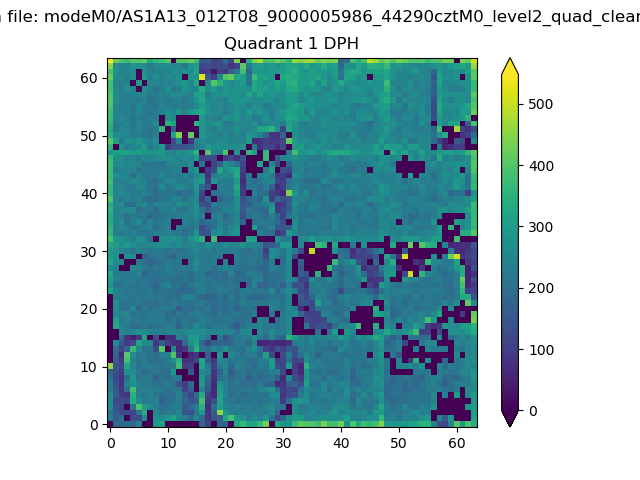 |
Quadrant B |
|---|---|---|---|
| Quadrant D | 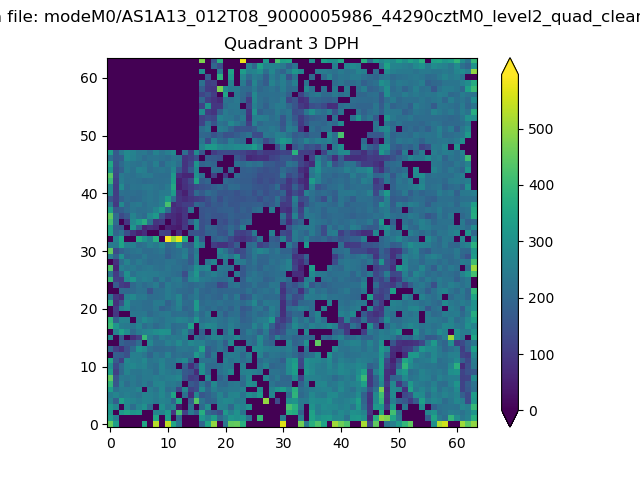 |
 |
Quadrant C |
| Plot type | Count rate plots | Images |
|---|---|---|
| Comparison with Poisson distribution Blue bars denote a histogram of data divided into 1 sec bins. Red curve is a Poisson curve with rate = median count rate of data. |
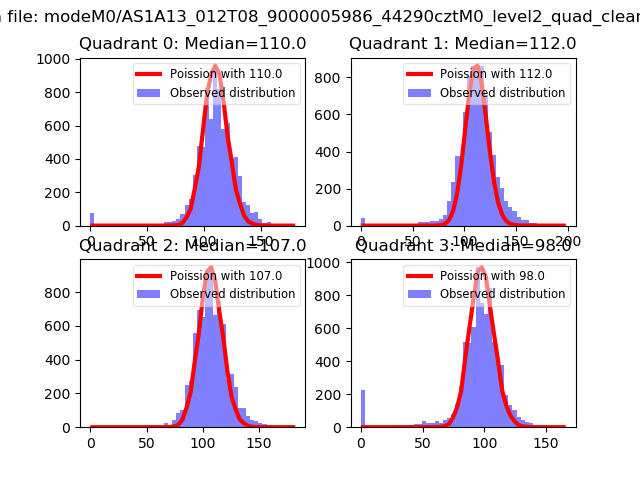 |
 |
| Quadrant-wise count rates Data is divided into 100 sec bins |
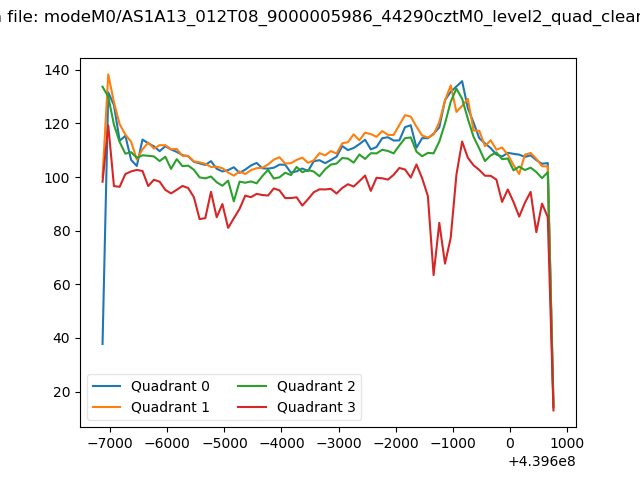 |
|
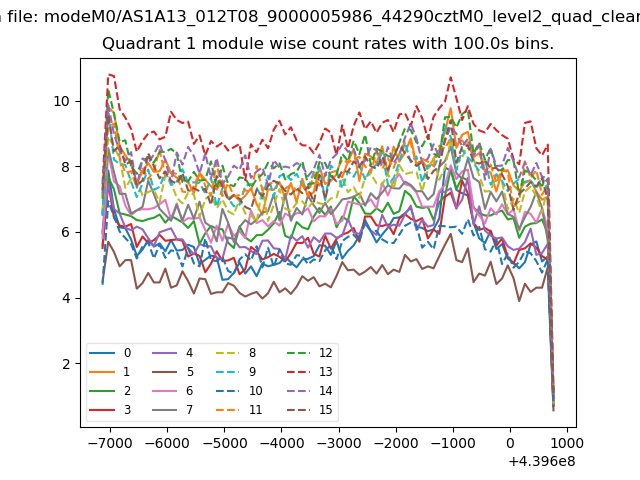
| Module-wise count rates for Quadrant A Data is divided into 100 sec bins |
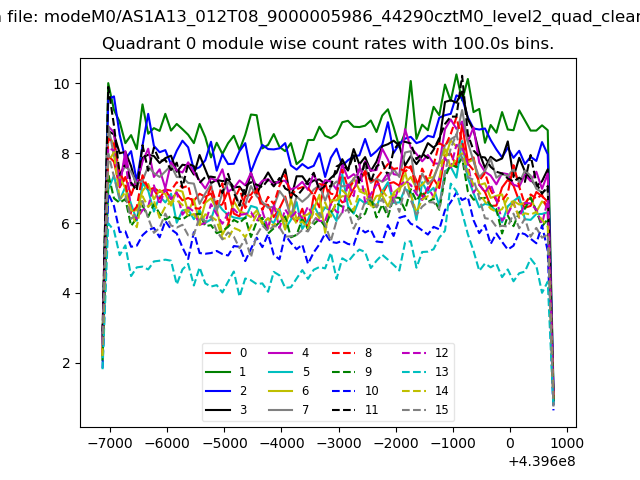 |
 |
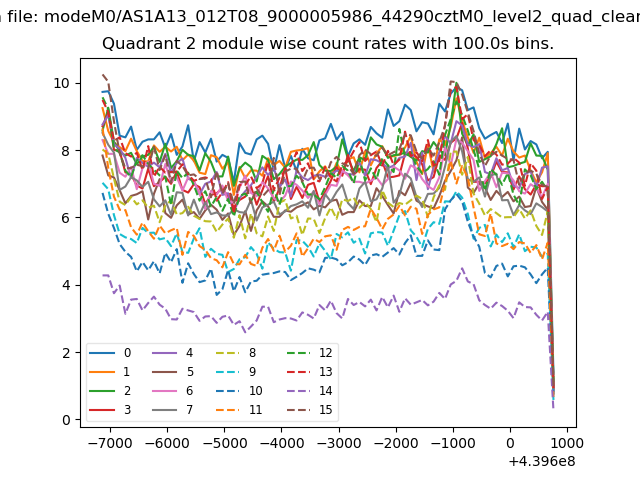
| Module-wise count rates for Quadrant B Data is divided into 100 sec bins |
 |
 |
| Module-wise count rates for Quadrant C Data is divided into 100 sec bins |
 |
 |
| Module-wise count rates for Quadrant D Data is divided into 100 sec bins |
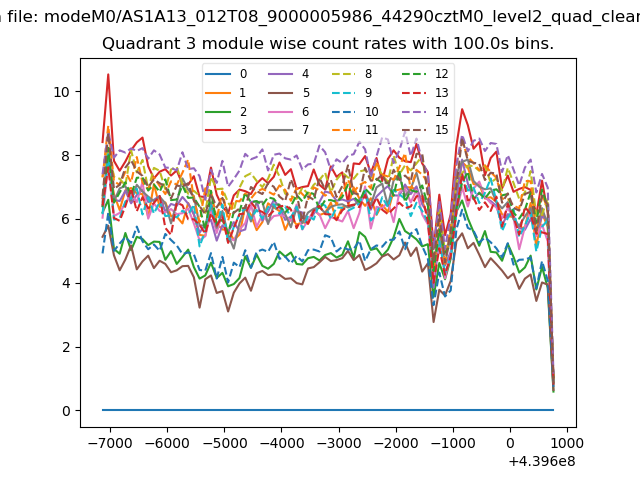 |
 |
| Parameter | Plot |
|---|---|
| CZT HV Monitor | 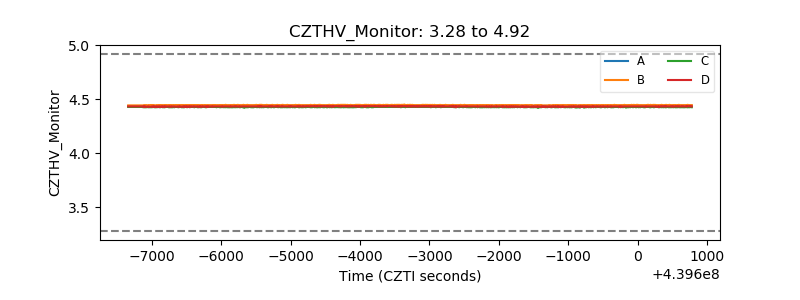 |
| D_VDD | 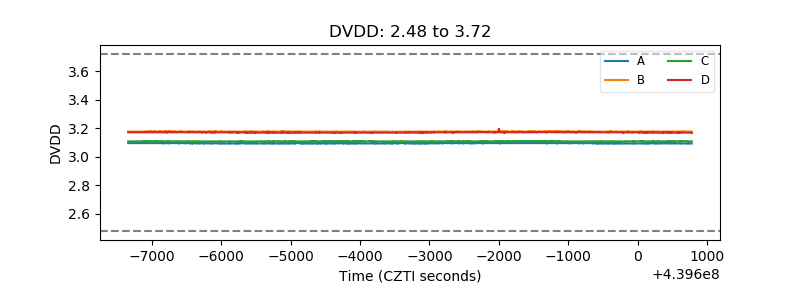 |
| Temperature 1 | 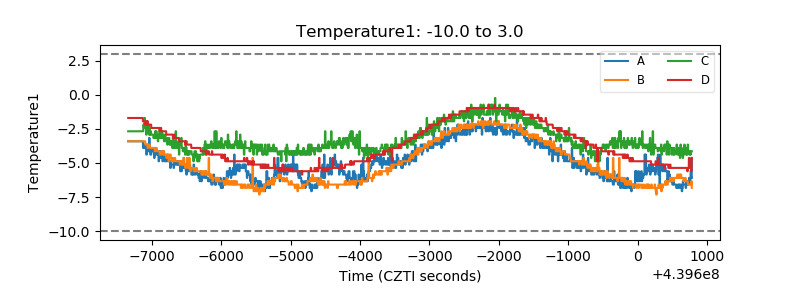 |
| Veto HV Monitor | 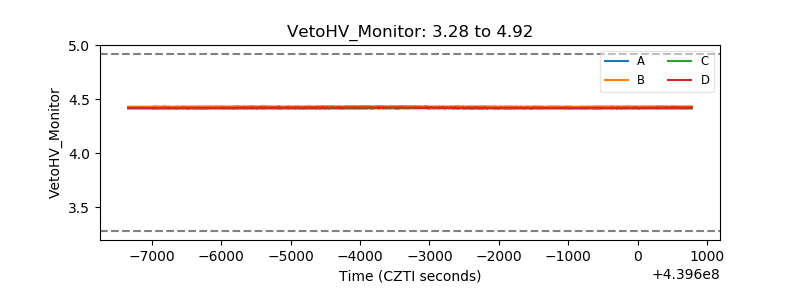 |
| Veto LLD | 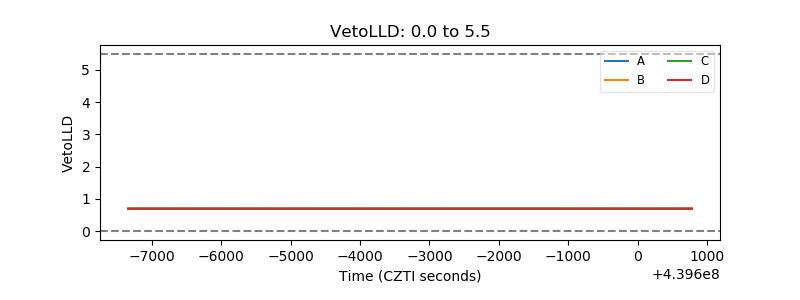 |
| Alpha Counter | 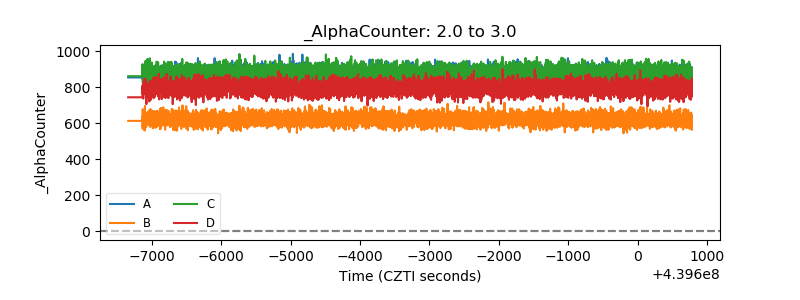 |
| _CPM_Rate | 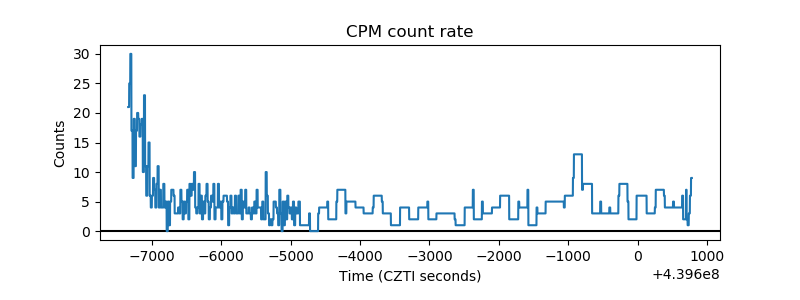 |
| CZT Counter | 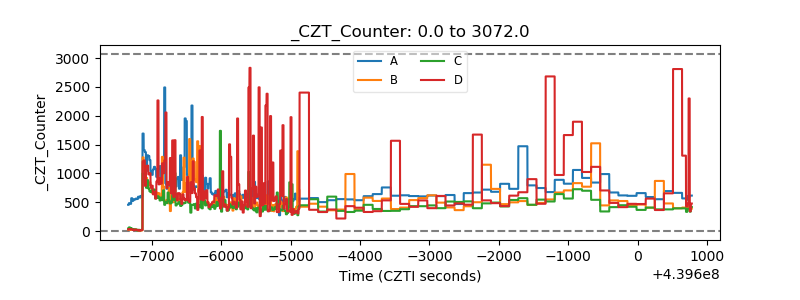 |
| +2.5 Volts monitor | 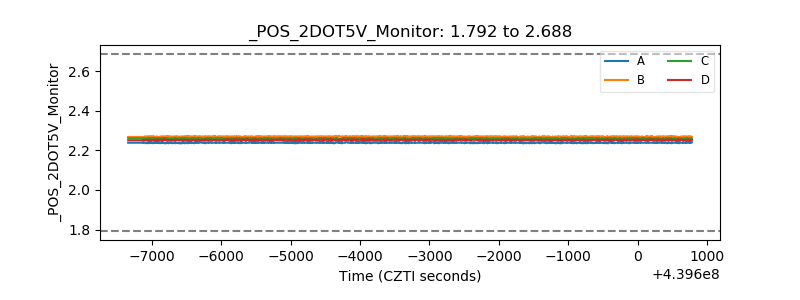 |
| +5 Volts monitor | 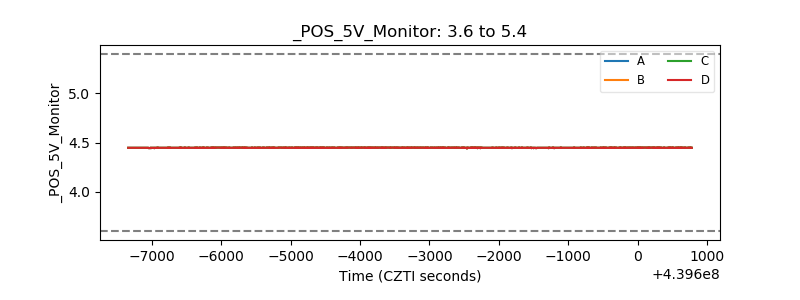 |
| _ROLL_ROT | 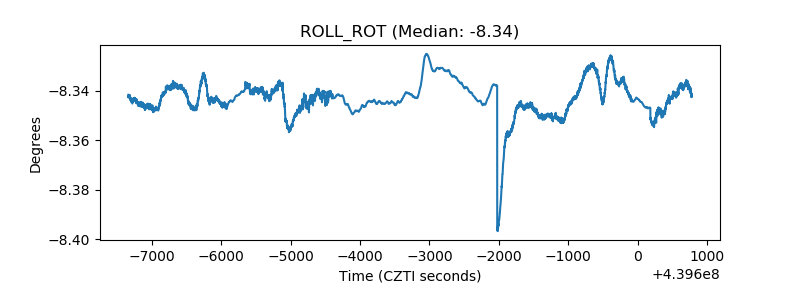 |
| _Roll_DEC | 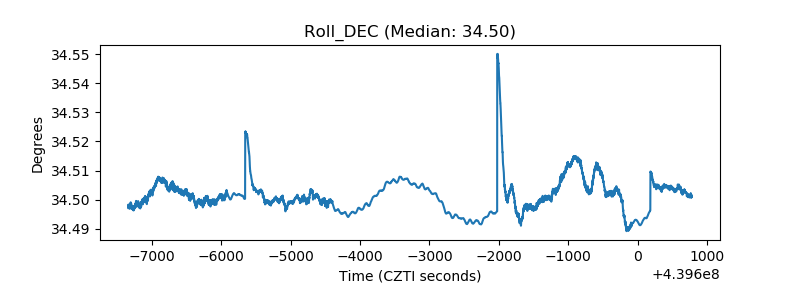 |
| _Roll_RA | 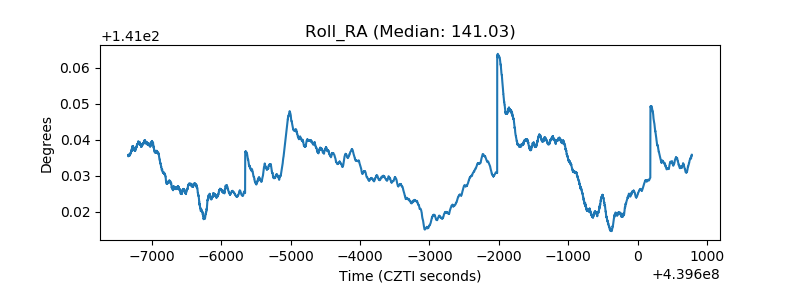 |
| Veto Counter | 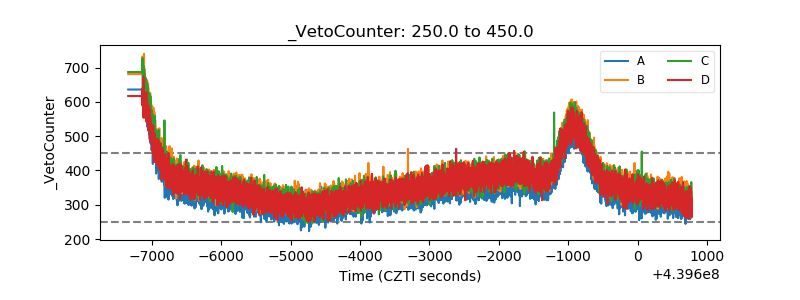 |