| Param | Original file | Final file |
|---|---|---|
| Filename | modeM0/AS1A13_012T08_9000005986_44297cztM0_level2.fits | modeM0/AS1A13_012T08_9000005986_44297cztM0_level2_quad_clean.evt |
| Size (bytes) | 524,479,680 | 103,910,400 |
| Size | 500.2 MB | 99.1 MB |
| Events in quadrant A | 6,663,124 | 674,753 |
| Events in quadrant B | 3,875,469 | 726,085 |
| Events in quadrant C | 3,035,659 | 697,586 |
| Events in quadrant D | 5,336,065 | 594,293 |
| Mode SS | |||
|---|---|---|---|
| Quadrant | BADHDUFLAG | Total packets | Discarded packets |
| A | 0 | 134 | 2 |
| B | 0 | 134 | 2 |
| C | 0 | 134 | 2 |
| D | 0 | 134 | 2 |
| Mode M9 | |||
|---|---|---|---|
| Quadrant | BADHDUFLAG | Total packets | Discarded packets |
| A | 0 | 10 | 0 |
| B | 0 | 10 | 0 |
| C | 0 | 10 | 0 |
| D | 0 | 10 | 0 |
| Mode M0 | |||
|---|---|---|---|
| Quadrant | BADHDUFLAG | Total packets | Discarded packets |
| A | 0 | 25219 | 512 |
| B | 0 | 16018 | 202 |
| C | 0 | 13825 | 182 |
| D | 0 | 20513 | 231 |
| Quadrant | Total seconds | Saturated seconds | Saturation percentage |
|---|---|---|---|
| A | 6477 | 630 | 9.726725% |
| B | 6505 | 174 | 2.674865% |
| C | 6511 | 86 | 1.320842% |
| D | 6503 | 643 | 9.887744% |
Noise dominated data is calculated using 1-second bins in cleaned event files. If a bin has >2000 counts, and if more than 50% of those come from <1% of pixels, then it is considered to be noise-dominated and hence unusable.
| Quadrant | # 1 sec bins | Bins with >0 counts | Bins with >2000 counts | High rate bins dominated by noise | Noise dominated (total time) | Noise dominated (detector-on time) | Marked lightcurve |
|---|---|---|---|---|---|---|---|
| A | 7491 | 6496 | 348 | 348 | 4.65% | 5.36% | 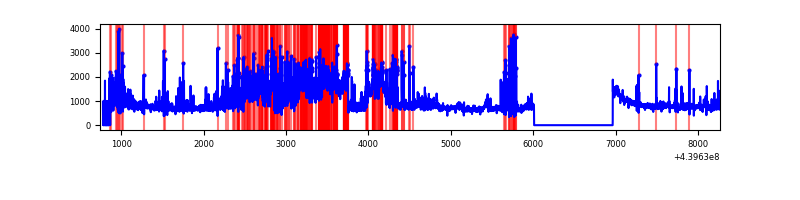 |
| B | 7501 | 6528 | 30 | 30 | 0.40% | 0.46% | 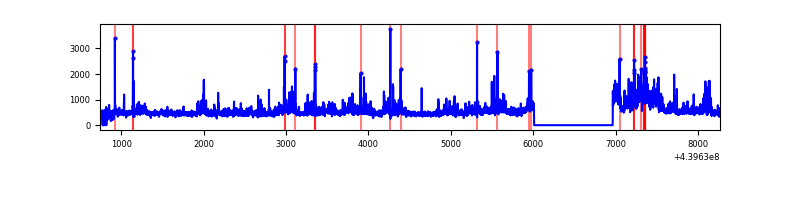 |
| C | 7526 | 6531 | 17 | 17 | 0.23% | 0.26% | 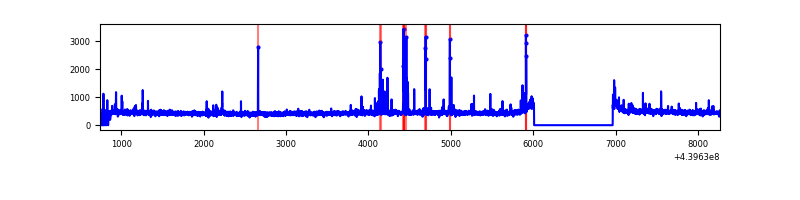 |
| D | 7515 | 6530 | 492 | 492 | 6.55% | 7.53% | 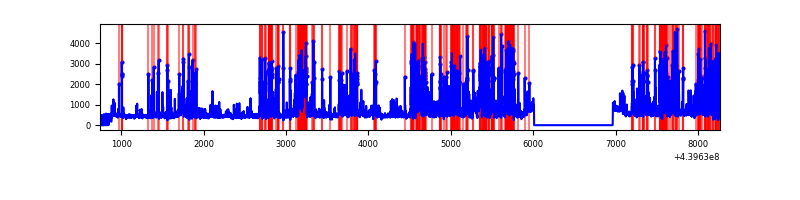 |
Top three noisy pixels from each quadrant. If the there are fewer than three noisy pixels in the level2.evt file, extra rows are filled as -1
| Pixel properties | Quadrant properties | ||||||
|---|---|---|---|---|---|---|---|
| Quadrant | DetID | PixID | Counts | Sigma | Mean | Median | Sigma |
| A | 15 | 223 | 2167750 | 14414.14 | 729 | 714 | 150.3 |
| A | 10 | 83 | 1484045 | 9866.45 | 729 | 714 | 150.3 |
| A | 12 | 227 | 70282 | 462.73 | 729 | 714 | 150.3 |
| B | 5 | 255 | 439597 | 3009.71 | 737 | 715 | 145.8 |
| B | 0 | 229 | 213200 | 1457.15 | 737 | 715 | 145.8 |
| B | 0 | 190 | 137908 | 940.82 | 737 | 715 | 145.8 |
| C | 14 | 254 | 142701 | 826.6 | 727 | 730 | 171.8 |
| C | 15 | 208 | 24951 | 141.02 | 727 | 730 | 171.8 |
| C | 1 | 3 | 16262 | 90.43 | 727 | 730 | 171.8 |
| D | 13 | 249 | 801435 | 4544.38 | 704 | 682 | 176.2 |
| D | 12 | 2 | 421628 | 2388.92 | 704 | 682 | 176.2 |
| D | 12 | 1 | 306290 | 1734.37 | 704 | 682 | 176.2 |
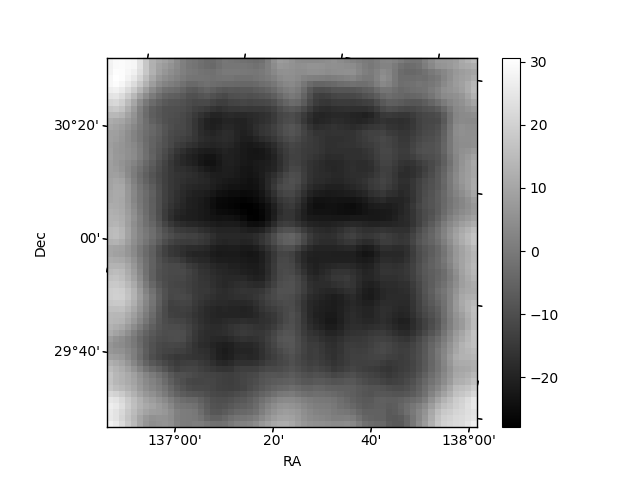
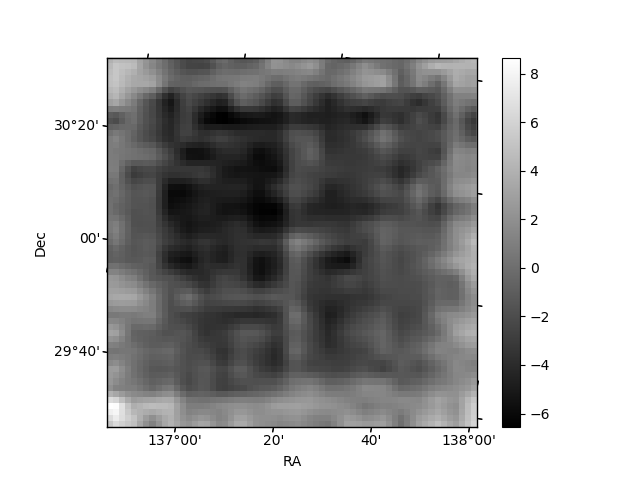
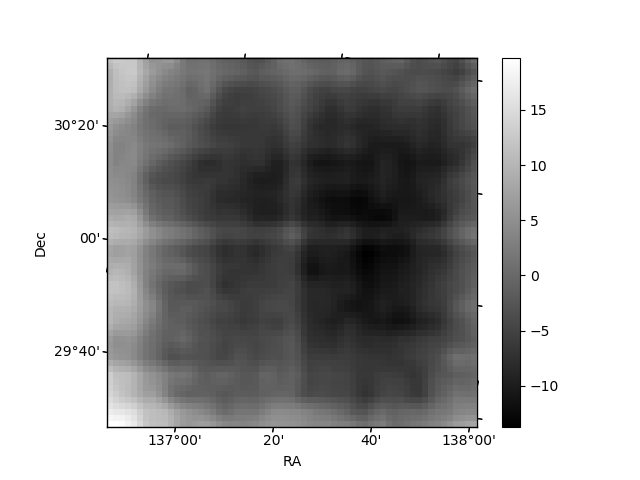
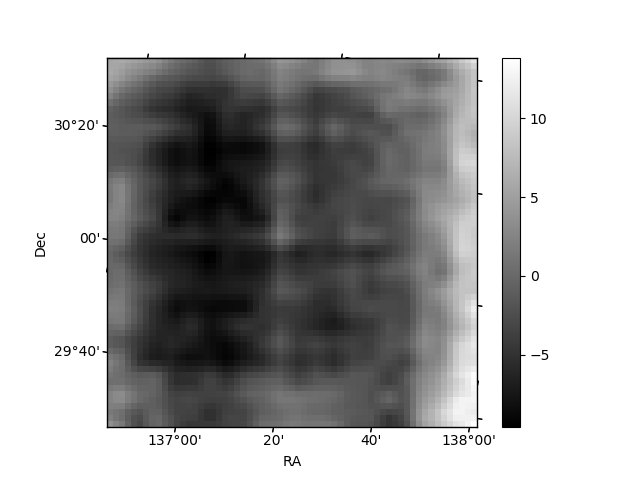
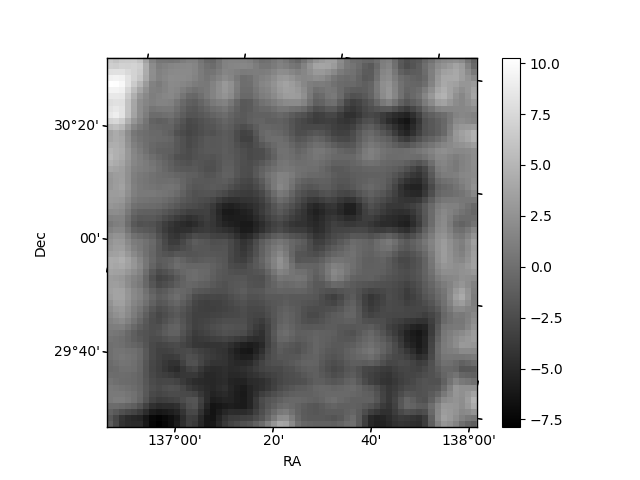
Histogram calculated using DETX and DETY for each event in the final _common_clean file
| Quadrant A | 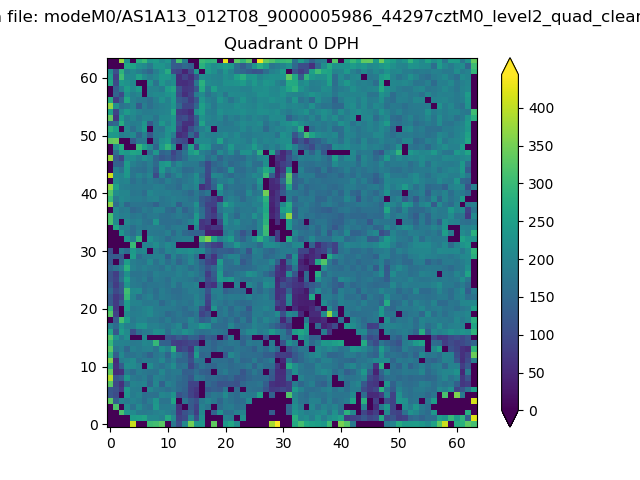 |
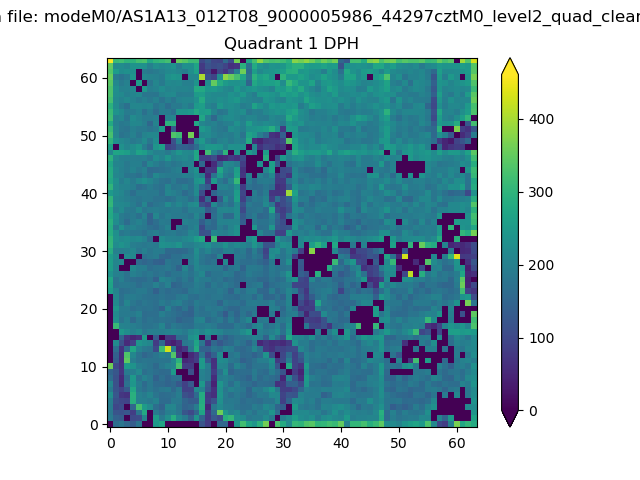 |
Quadrant B |
|---|---|---|---|
| Quadrant D | 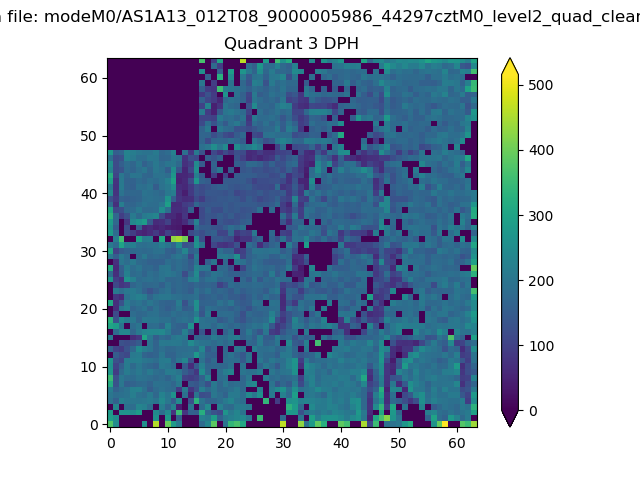 |
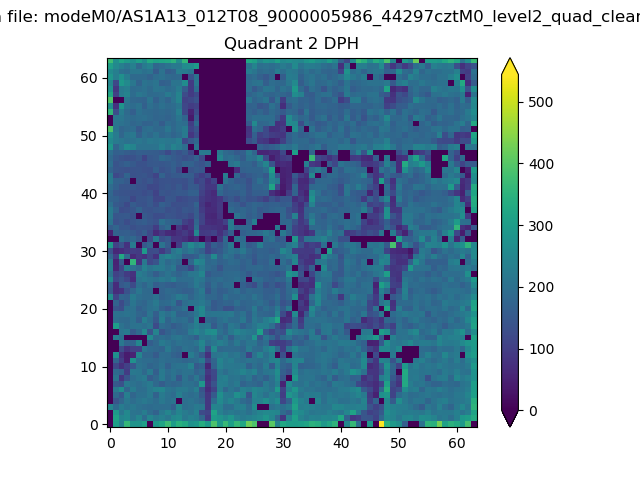 |
Quadrant C |
| Plot type | Count rate plots | Images |
|---|---|---|
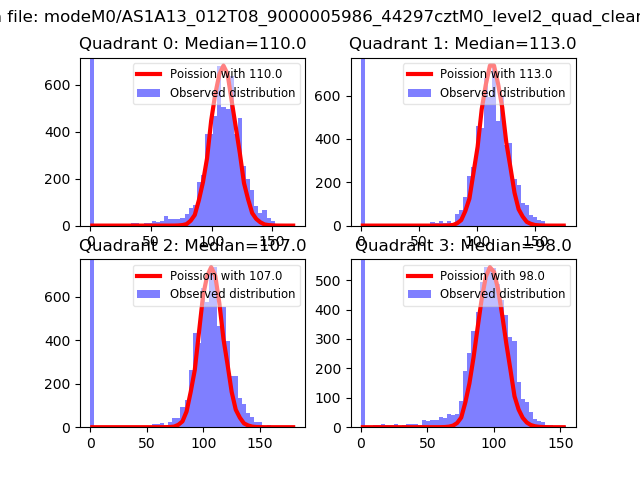
| Comparison with Poisson distribution Blue bars denote a histogram of data divided into 1 sec bins. Red curve is a Poisson curve with rate = median count rate of data. |
 |
 |
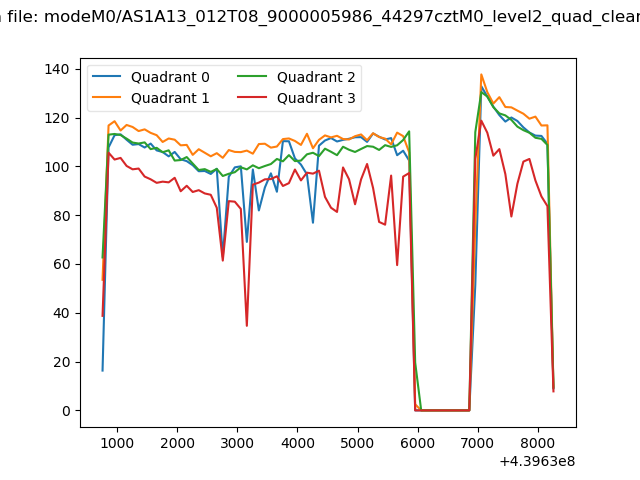
| Quadrant-wise count rates Data is divided into 100 sec bins |
 |
|
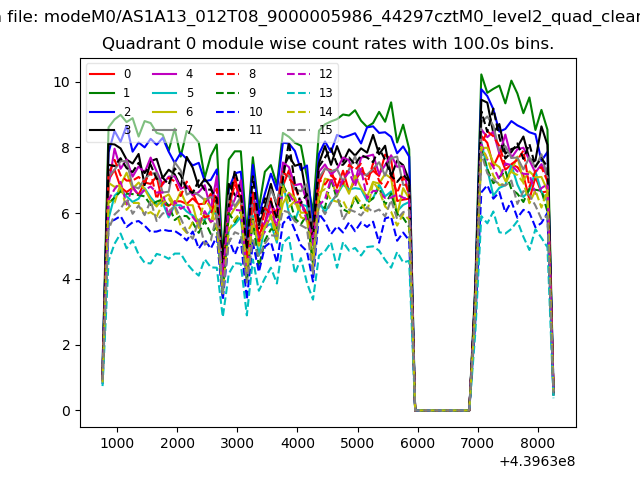
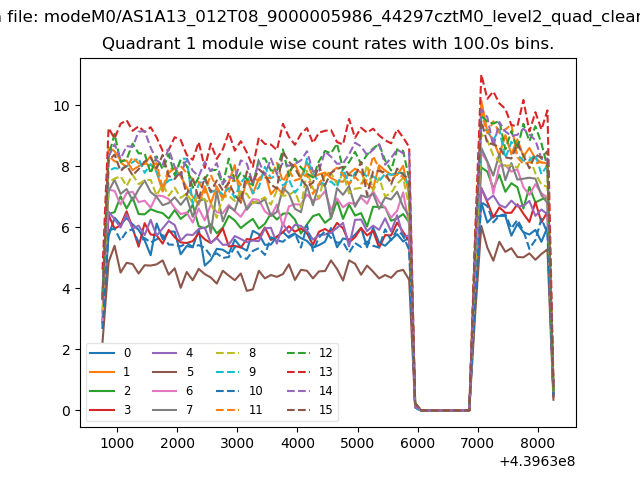
| Module-wise count rates for Quadrant A Data is divided into 100 sec bins |
 |
 |
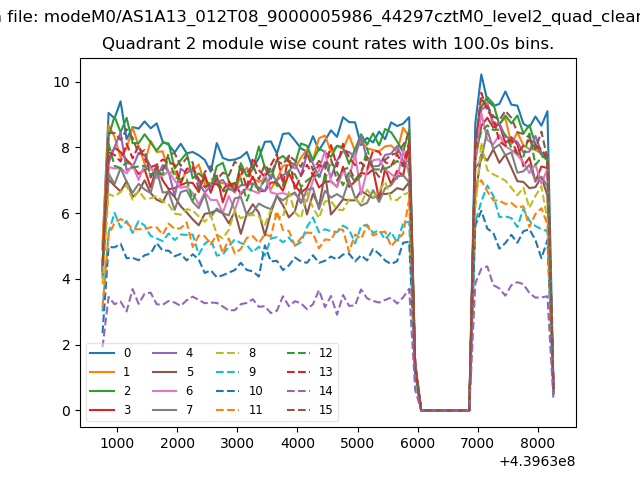
| Module-wise count rates for Quadrant B Data is divided into 100 sec bins |
 |
 |
| Module-wise count rates for Quadrant C Data is divided into 100 sec bins |
 |
 |
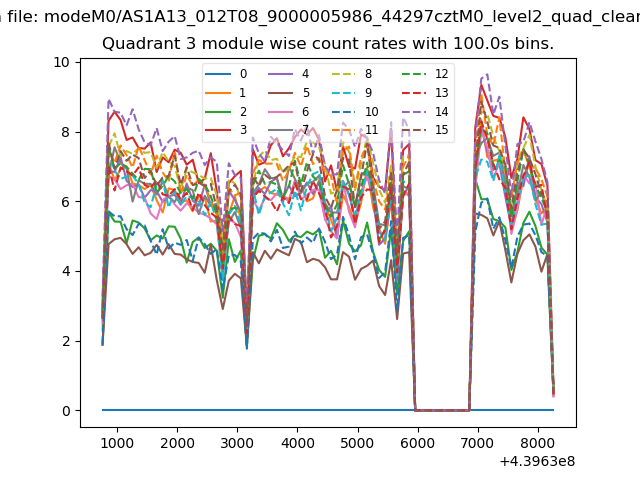
| Module-wise count rates for Quadrant D Data is divided into 100 sec bins |
 |
 |
| Parameter | Plot |
|---|---|
| CZT HV Monitor | 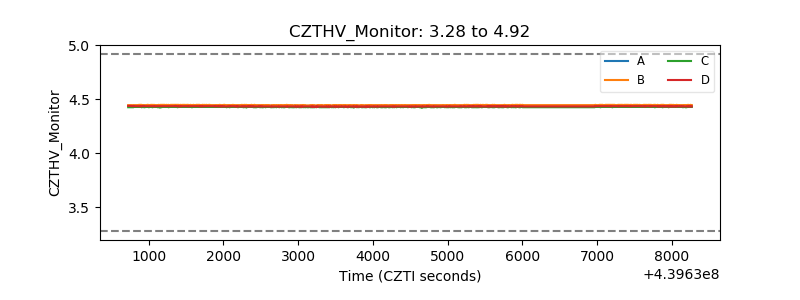 |
| D_VDD | 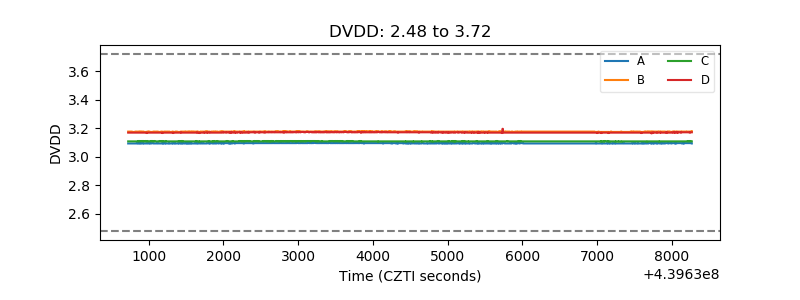 |
| Temperature 1 | 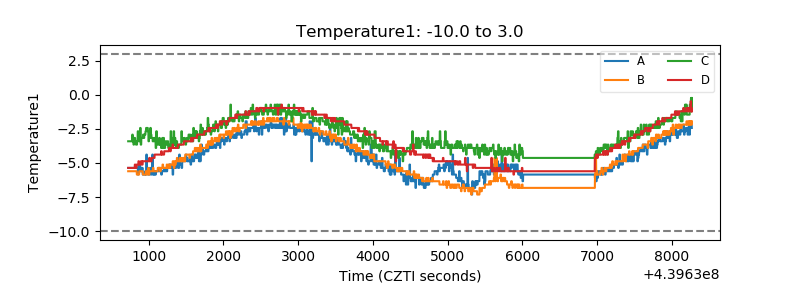 |
| Veto HV Monitor |  |
| Veto LLD | 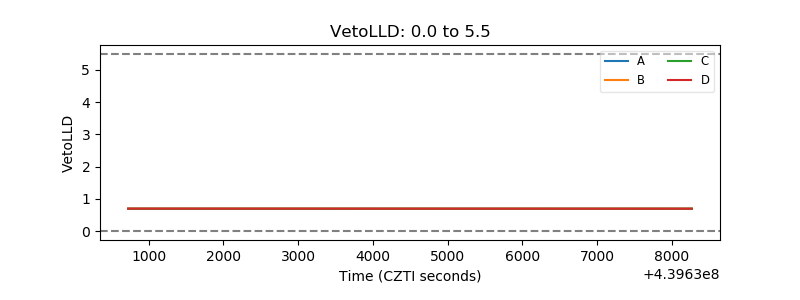 |
| Alpha Counter | 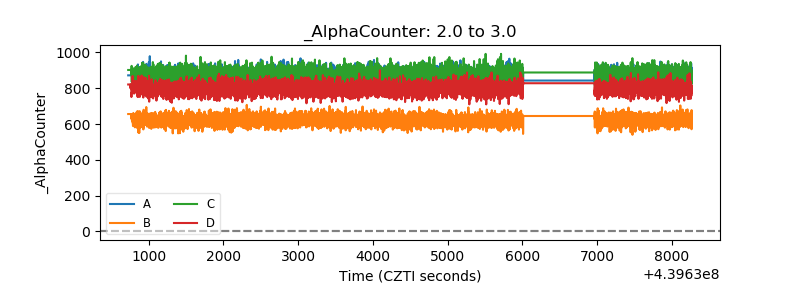 |
| _CPM_Rate | 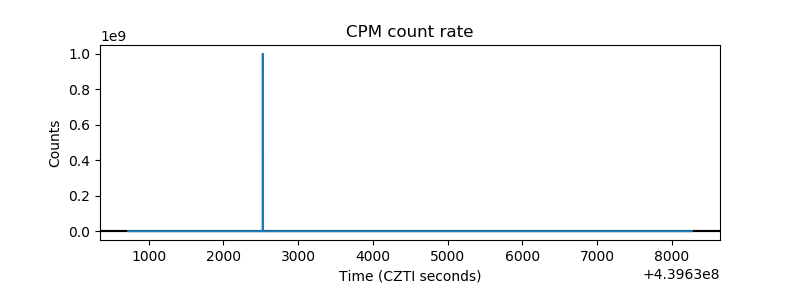 |
| CZT Counter | 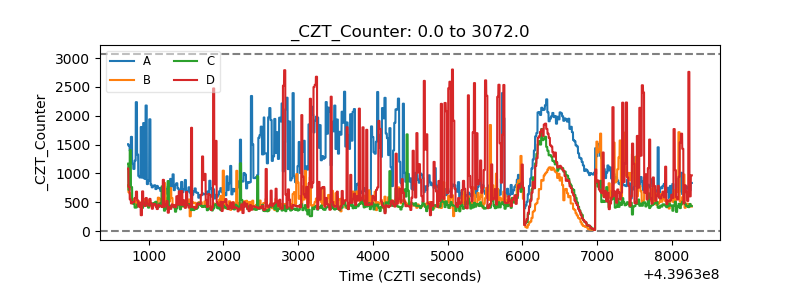 |
| +2.5 Volts monitor | 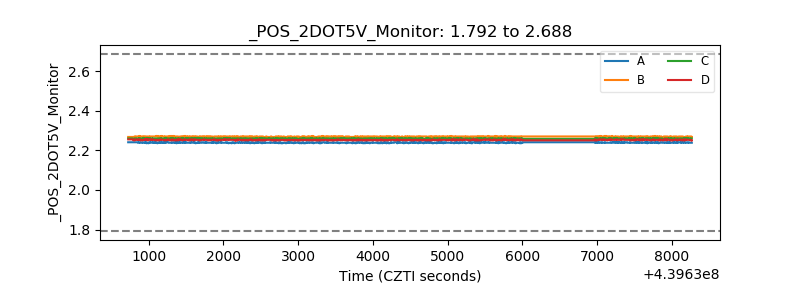 |
| +5 Volts monitor | 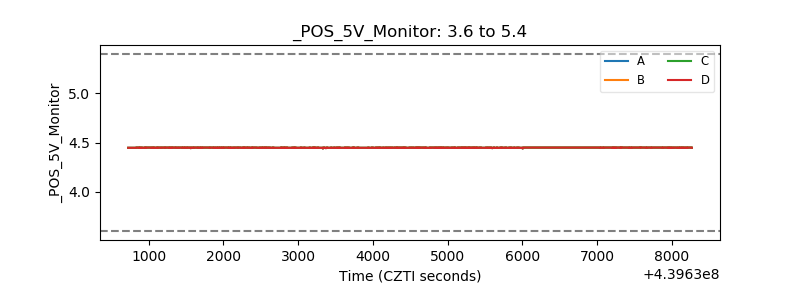 |
| _ROLL_ROT | 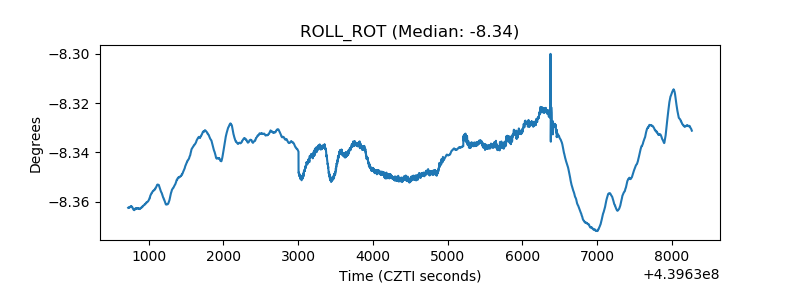 |
| _Roll_DEC | 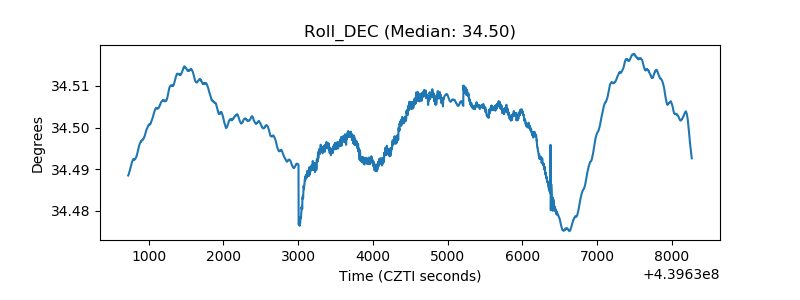 |
| _Roll_RA | 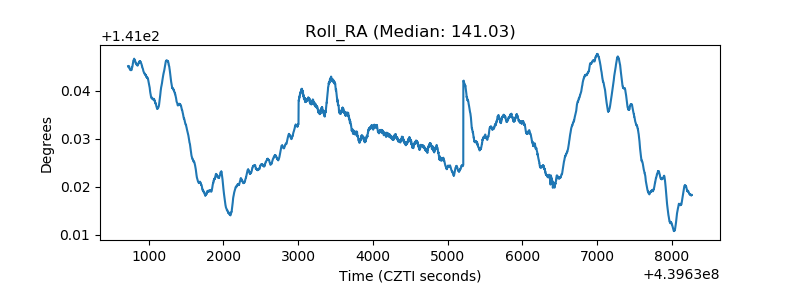 |
| Veto Counter | 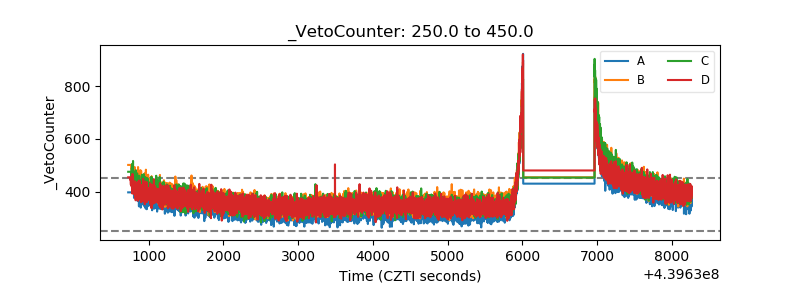 |