| Param | Original file | Final file |
|---|---|---|
| Filename | modeM0/AS1A13_012T08_9000005986_44298cztM0_level2.fits | modeM0/AS1A13_012T08_9000005986_44298cztM0_level2_quad_clean.evt |
| Size (bytes) | 301,587,840 | 62,308,800 |
| Size | 287.6 MB | 59.4 MB |
| Events in quadrant A | 2,775,717 | 430,935 |
| Events in quadrant B | 2,668,936 | 427,533 |
| Events in quadrant C | 1,758,649 | 409,958 |
| Events in quadrant D | 3,663,316 | 349,256 |
| Mode SS | |||
|---|---|---|---|
| Quadrant | BADHDUFLAG | Total packets | Discarded packets |
| A | 0 | 76 | 0 |
| B | 0 | 76 | 0 |
| C | 0 | 76 | 0 |
| D | 0 | 76 | 0 |
| Mode M0 | |||
|---|---|---|---|
| Quadrant | BADHDUFLAG | Total packets | Discarded packets |
| A | 0 | 11428 | 0 |
| B | 0 | 10467 | 0 |
| C | 0 | 7883 | 0 |
| D | 0 | 13450 | 0 |
| Quadrant | Total seconds | Saturated seconds | Saturation percentage |
|---|---|---|---|
| A | 3810 | 27 | 0.708661% |
| B | 3811 | 166 | 4.355812% |
| C | 3811 | 14 | 0.367358% |
| D | 3811 | 441 | 11.571766% |
Noise dominated data is calculated using 1-second bins in cleaned event files. If a bin has >2000 counts, and if more than 50% of those come from <1% of pixels, then it is considered to be noise-dominated and hence unusable.
| Quadrant | # 1 sec bins | Bins with >0 counts | Bins with >2000 counts | High rate bins dominated by noise | Noise dominated (total time) | Noise dominated (detector-on time) | Marked lightcurve |
|---|---|---|---|---|---|---|---|
| A | 3810 | 3810 | 7 | 7 | 0.18% | 0.18% | 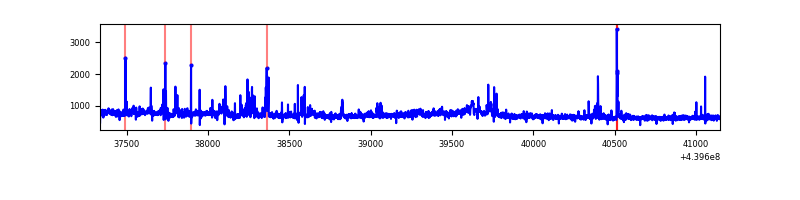 |
| B | 3811 | 3811 | 136 | 136 | 3.57% | 3.57% | 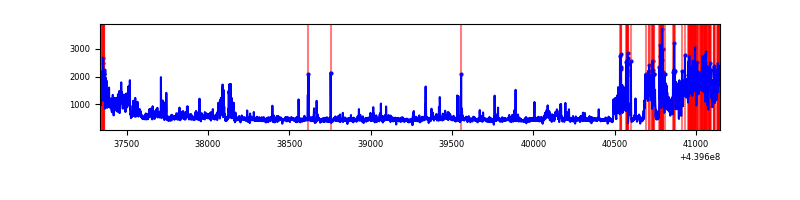 |
| C | 3811 | 3811 | 6 | 6 | 0.16% | 0.16% | 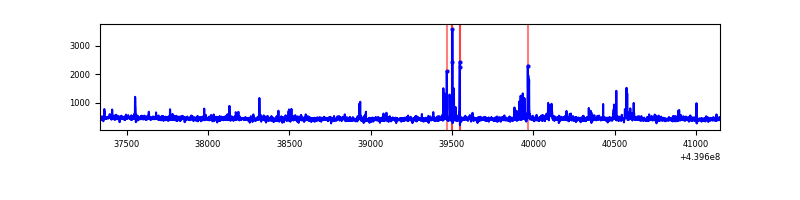 |
| D | 3811 | 3811 | 381 | 381 | 10.00% | 10.00% | 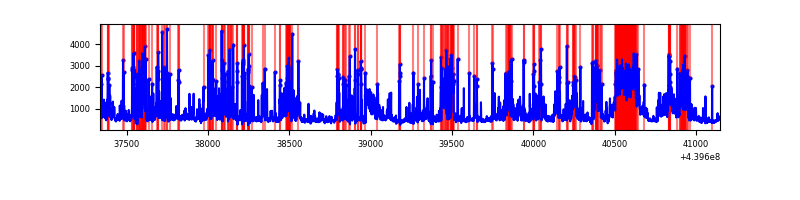 |
Top three noisy pixels from each quadrant. If the there are fewer than three noisy pixels in the level2.evt file, extra rows are filled as -1
| Pixel properties | Quadrant properties | ||||||
|---|---|---|---|---|---|---|---|
| Quadrant | DetID | PixID | Counts | Sigma | Mean | Median | Sigma |
| A | 10 | 83 | 818637 | 9112.24 | 429 | 420 | 89.8 |
| A | 15 | 223 | 209467 | 2328.1 | 429 | 420 | 89.8 |
| A | 13 | 248 | 43889 | 484.1 | 429 | 420 | 89.8 |
| B | 5 | 255 | 780096 | 9311.02 | 422 | 410 | 83.7 |
| B | 0 | 190 | 84630 | 1005.76 | 422 | 410 | 83.7 |
| B | 4 | 158 | 20755 | 242.96 | 422 | 410 | 83.7 |
| C | 14 | 254 | 64114 | 643.91 | 418 | 421 | 98.9 |
| C | 3 | 233 | 47827 | 479.26 | 418 | 421 | 98.9 |
| C | 1 | 3 | 11386 | 110.85 | 418 | 421 | 98.9 |
| D | 12 | 1 | 1049217 | 10194.69 | 405 | 392 | 102.9 |
| D | 12 | 2 | 300346 | 2915.58 | 405 | 392 | 102.9 |
| D | 1 | 52 | 263849 | 2560.83 | 405 | 392 | 102.9 |
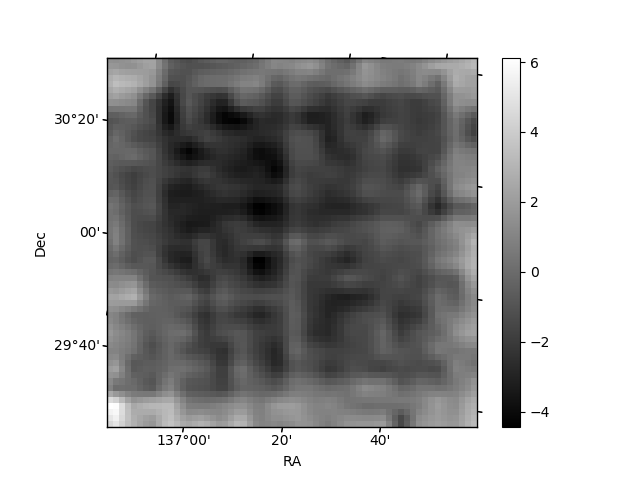
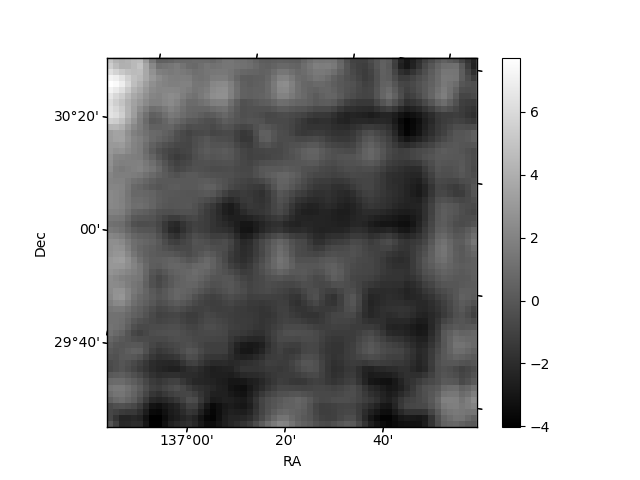
Histogram calculated using DETX and DETY for each event in the final _common_clean file
| Quadrant A | 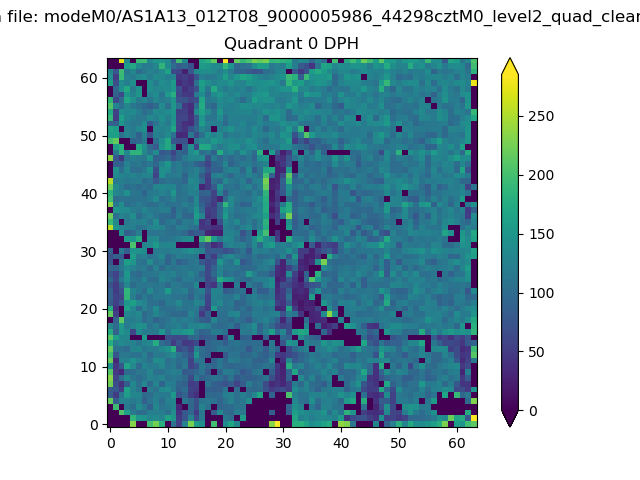 |
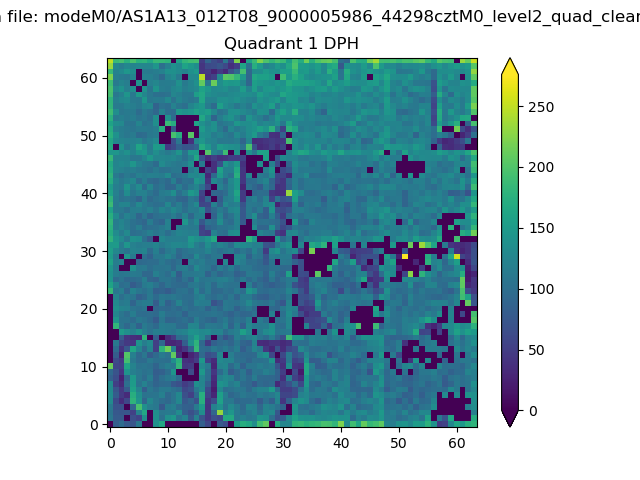 |
Quadrant B |
|---|---|---|---|
| Quadrant D | 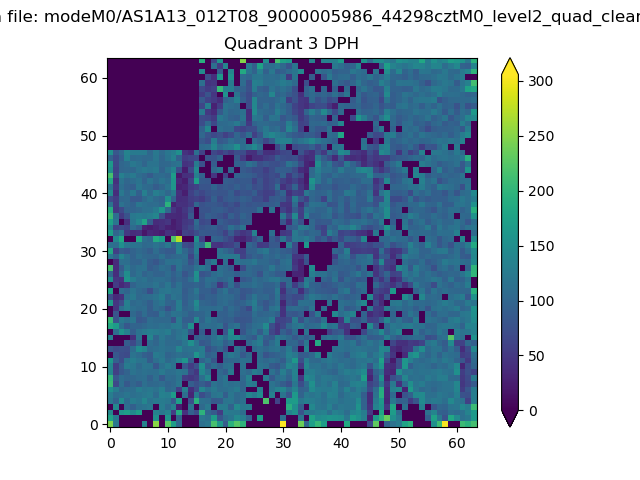 |
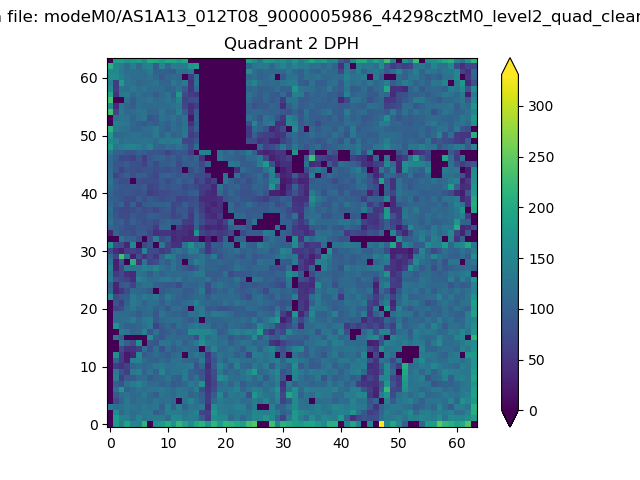 |
Quadrant C |
| Plot type | Count rate plots | Images |
|---|---|---|
| Comparison with Poisson distribution Blue bars denote a histogram of data divided into 1 sec bins. Red curve is a Poisson curve with rate = median count rate of data. |
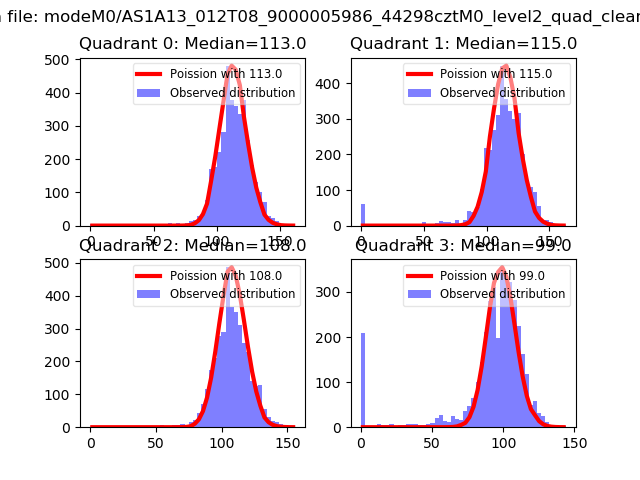 |
 |
| Quadrant-wise count rates Data is divided into 100 sec bins |
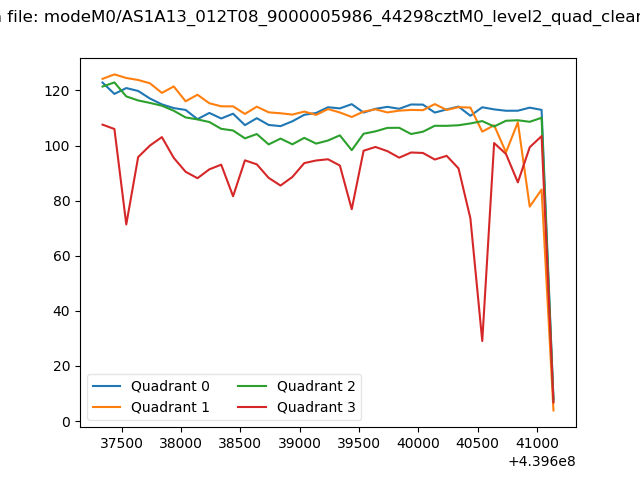 |
|
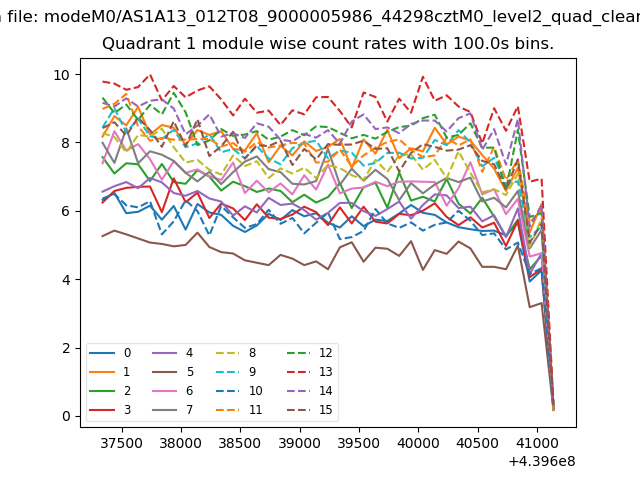
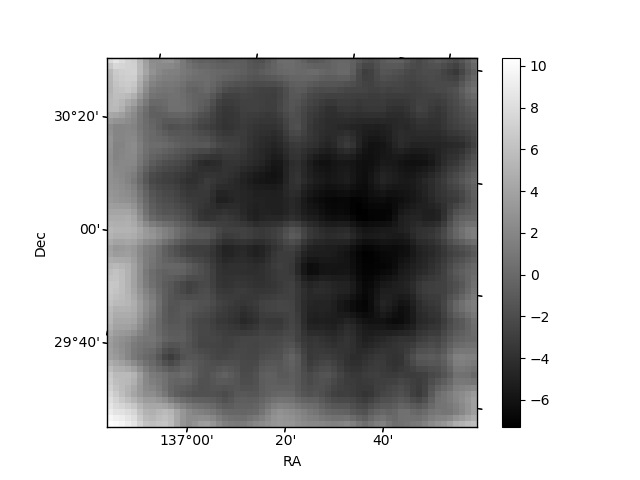
| Module-wise count rates for Quadrant A Data is divided into 100 sec bins |
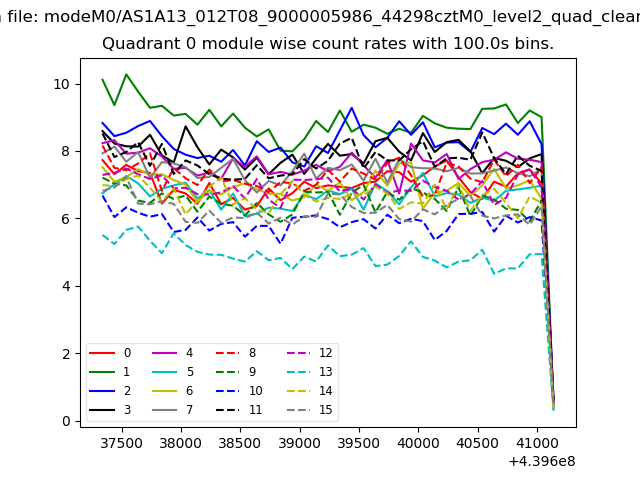 |
 |
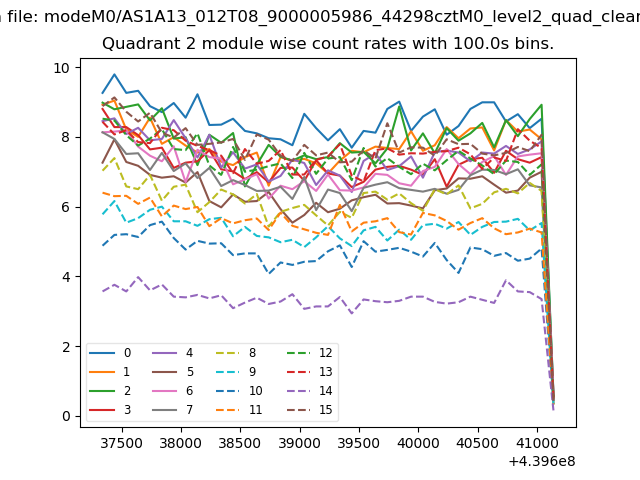
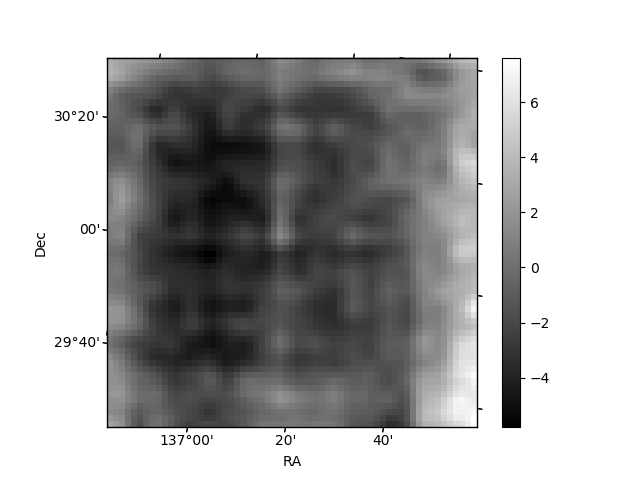
| Module-wise count rates for Quadrant B Data is divided into 100 sec bins |
 |
 |
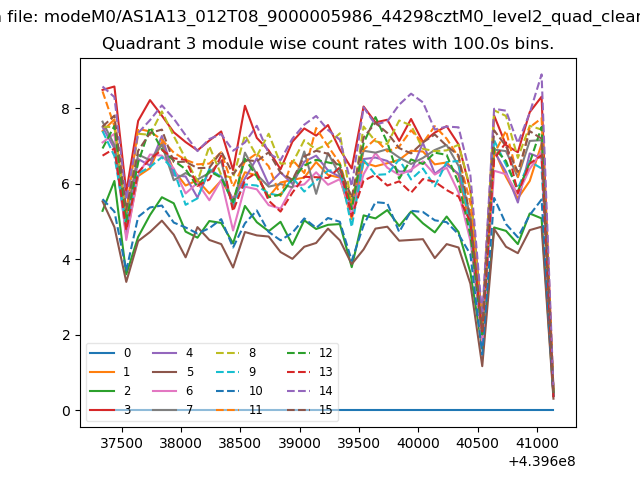
| Module-wise count rates for Quadrant C Data is divided into 100 sec bins |
 |
 |
| Module-wise count rates for Quadrant D Data is divided into 100 sec bins |
 |
 |
| Parameter | Plot |
|---|---|
| CZT HV Monitor |  |
| D_VDD | 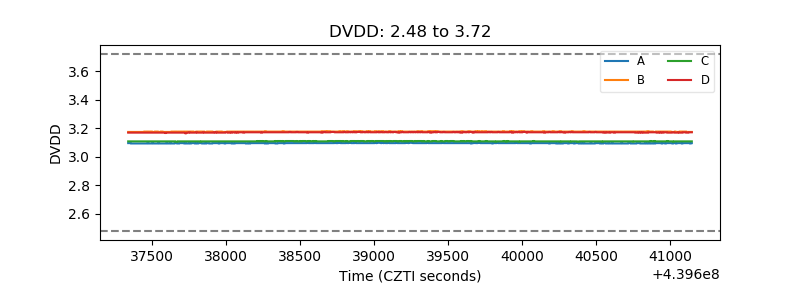 |
| Temperature 1 | 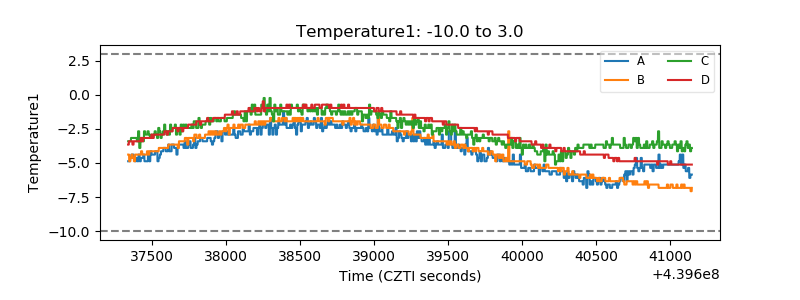 |
| Veto HV Monitor | 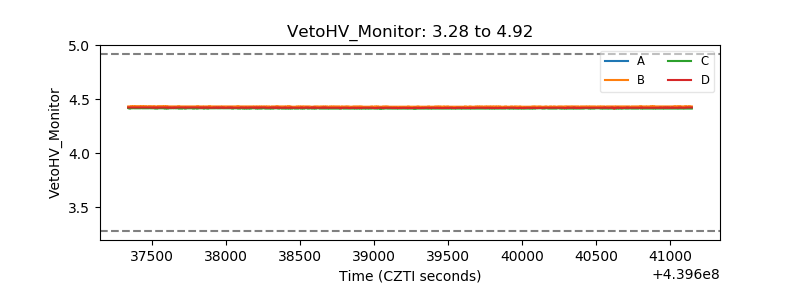 |
| Veto LLD | 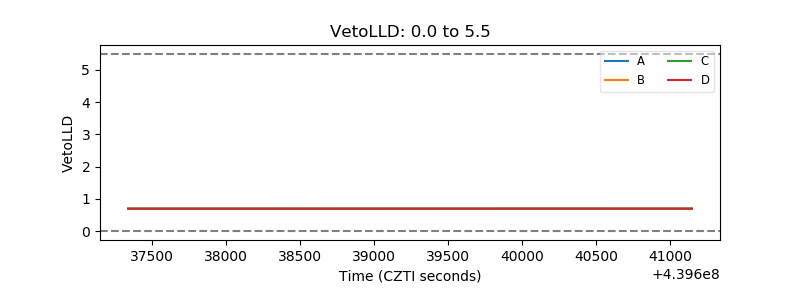 |
| Alpha Counter | 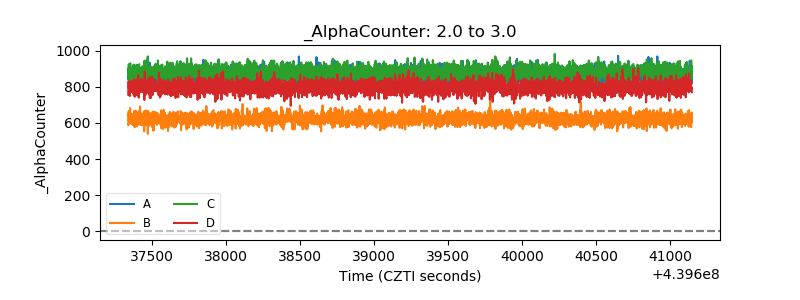 |
| _CPM_Rate | 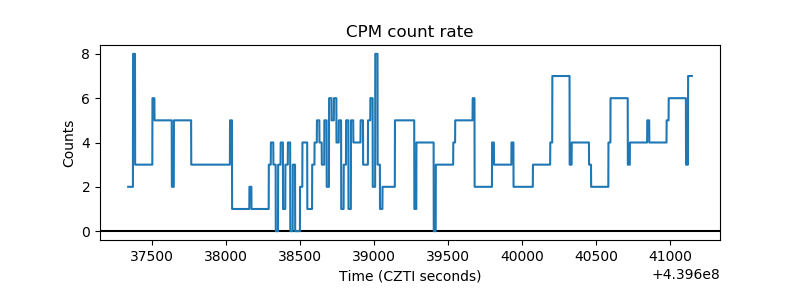 |
| CZT Counter |  |
| +2.5 Volts monitor | 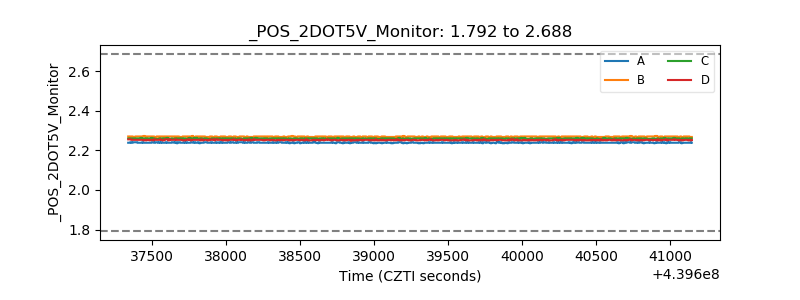 |
| +5 Volts monitor | 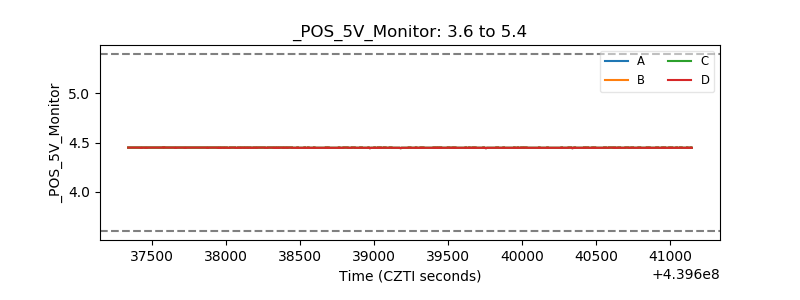 |
| _ROLL_ROT | 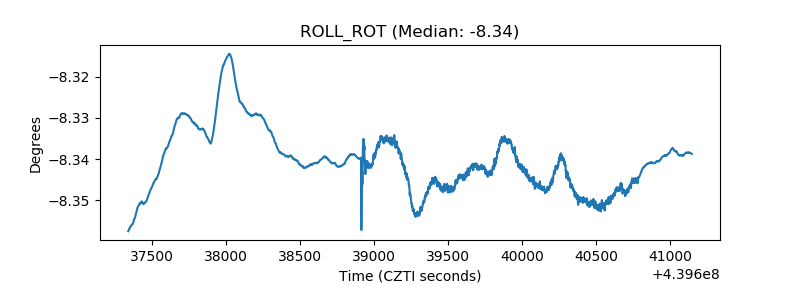 |
| _Roll_DEC | 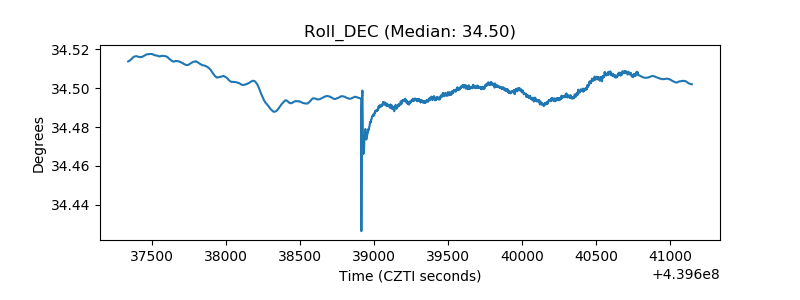 |
| _Roll_RA | 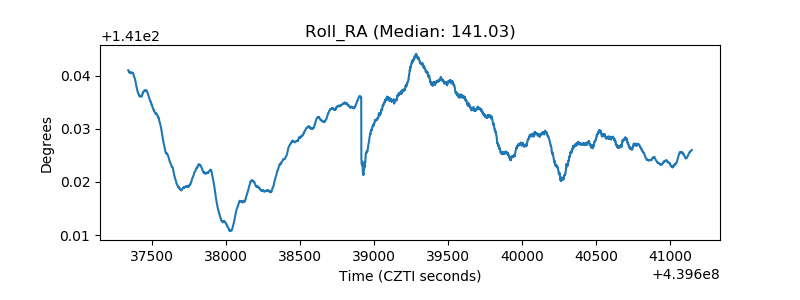 |
| Veto Counter | 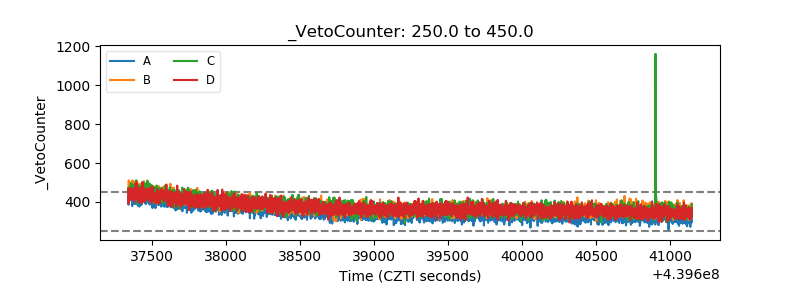 |