| Param | Original file | Final file |
|---|---|---|
| Filename | modeM0/AS1A13_004T13_9000005988_44298cztM0_level2.fits | modeM0/AS1A13_004T13_9000005988_44298cztM0_level2_quad_clean.evt |
| Size (bytes) | 102,150,720 | 25,669,440 |
| Size | 97.4 MB | 24.5 MB |
| Events in quadrant A | 1,123,968 | 172,393 |
| Events in quadrant B | 896,294 | 176,758 |
| Events in quadrant C | 717,532 | 171,943 |
| Events in quadrant D | 934,757 | 154,439 |
| Mode M0 | |||
|---|---|---|---|
| Quadrant | BADHDUFLAG | Total packets | Discarded packets |
| A | 0 | 4477 | 1 |
| B | 0 | 3507 | 1 |
| C | 0 | 2971 | 1 |
| D | 0 | 3633 | 1 |
| Mode SS | |||
|---|---|---|---|
| Quadrant | BADHDUFLAG | Total packets | Discarded packets |
| A | 0 | 28 | 0 |
| B | 0 | 28 | 0 |
| C | 0 | 28 | 0 |
| D | 0 | 28 | 0 |
| Mode M9 | |||
|---|---|---|---|
| Quadrant | BADHDUFLAG | Total packets | Discarded packets |
| A | 0 | 9 | 0 |
| B | 0 | 9 | 0 |
| C | 0 | 9 | 0 |
| D | 0 | 9 | 0 |
| Quadrant | Total seconds | Saturated seconds | Saturation percentage |
|---|---|---|---|
| A | 1363 | 65 | 4.768892% |
| B | 1363 | 71 | 5.209098% |
| C | 1363 | 5 | 0.366838% |
| D | 1363 | 68 | 4.988995% |
Noise dominated data is calculated using 1-second bins in cleaned event files. If a bin has >2000 counts, and if more than 50% of those come from <1% of pixels, then it is considered to be noise-dominated and hence unusable.
| Quadrant | # 1 sec bins | Bins with >0 counts | Bins with >2000 counts | High rate bins dominated by noise | Noise dominated (total time) | Noise dominated (detector-on time) | Marked lightcurve |
|---|---|---|---|---|---|---|---|
| A | 1363 | 1363 | 5 | 5 | 0.37% | 0.37% | 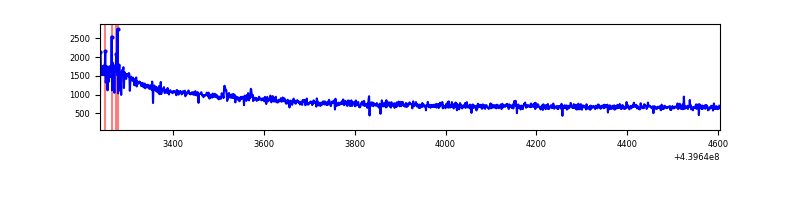 |
| B | 1363 | 1363 | 18 | 18 | 1.32% | 1.32% | 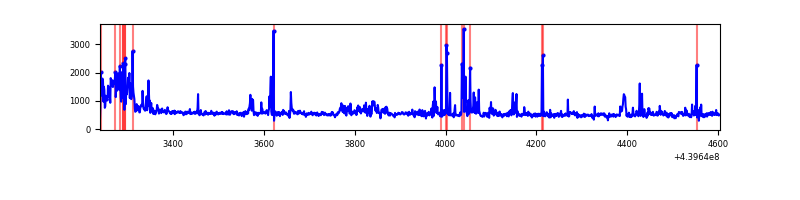 |
| C | 1363 | 1363 | 3 | 3 | 0.22% | 0.22% | 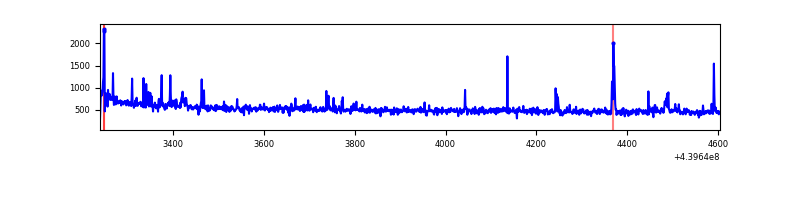 |
| D | 1363 | 1363 | 33 | 33 | 2.42% | 2.42% | 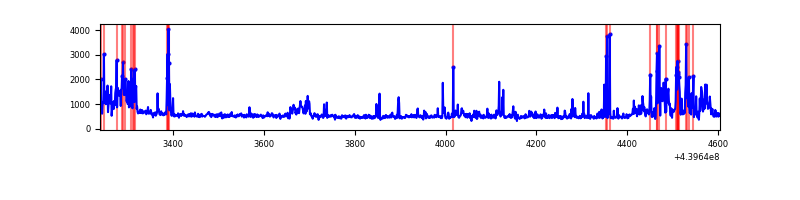 |
Top three noisy pixels from each quadrant. If the there are fewer than three noisy pixels in the level2.evt file, extra rows are filled as -1
| Pixel properties | Quadrant properties | ||||||
|---|---|---|---|---|---|---|---|
| Quadrant | DetID | PixID | Counts | Sigma | Mean | Median | Sigma |
| A | 10 | 83 | 410590 | 10663.51 | 180 | 177 | 38.5 |
| A | 15 | 223 | 13224 | 338.99 | 180 | 177 | 38.5 |
| A | 0 | 243 | 2206 | 52.72 | 180 | 177 | 38.5 |
| B | 5 | 255 | 148578 | 4143.28 | 176 | 171 | 35.8 |
| B | 0 | 190 | 22035 | 610.41 | 176 | 171 | 35.8 |
| B | 0 | 229 | 8489 | 232.23 | 176 | 171 | 35.8 |
| C | 14 | 254 | 22941 | 543.87 | 172 | 172 | 41.9 |
| C | 1 | 3 | 14710 | 347.26 | 172 | 172 | 41.9 |
| C | 3 | 233 | 7670 | 179.09 | 172 | 172 | 41.9 |
| D | 5 | 235 | 84555 | 1859.36 | 173 | 167 | 45.4 |
| D | 13 | 249 | 71350 | 1568.41 | 173 | 167 | 45.4 |
| D | 1 | 52 | 34046 | 746.47 | 173 | 167 | 45.4 |
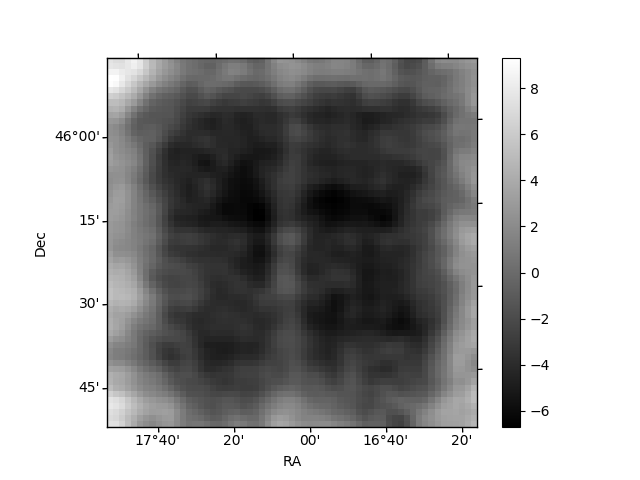
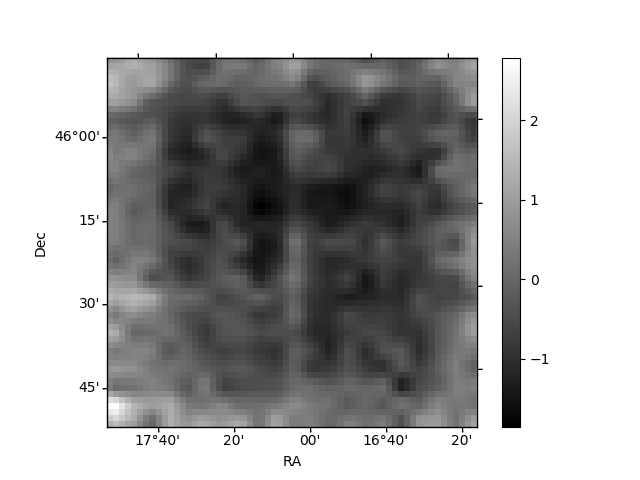
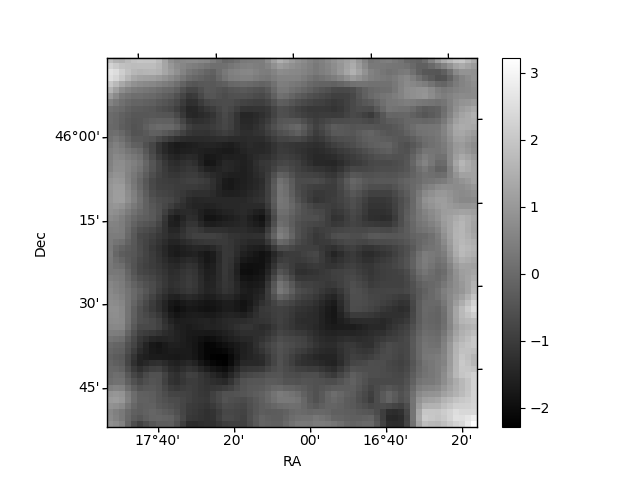
Histogram calculated using DETX and DETY for each event in the final _common_clean file
| Quadrant A | 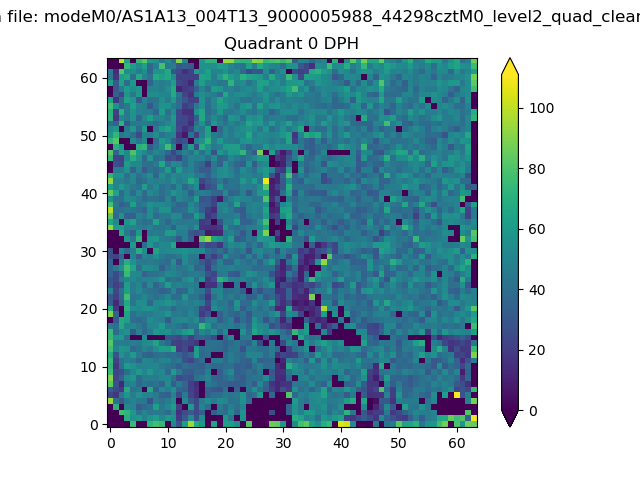 |
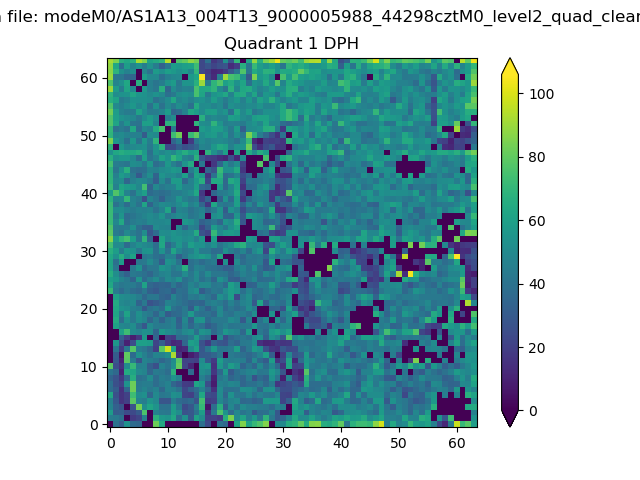 |
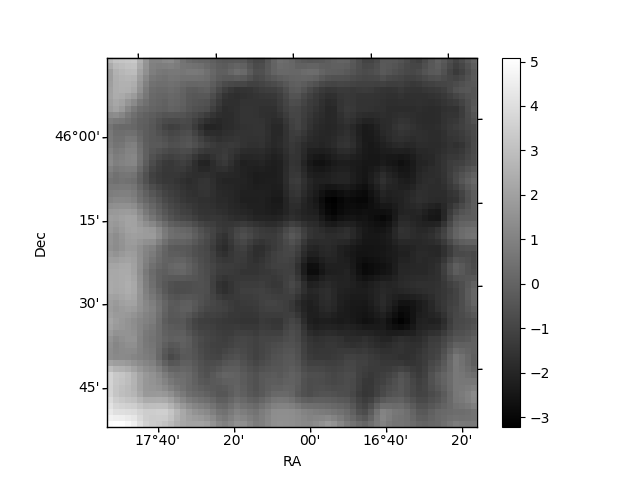
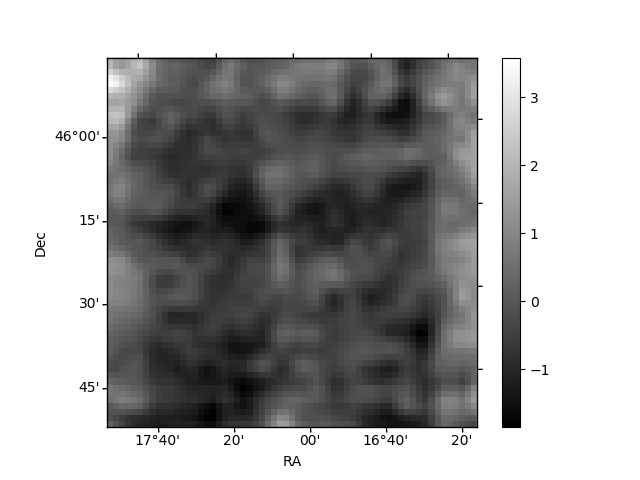
Quadrant B |
|---|---|---|---|
| Quadrant D | 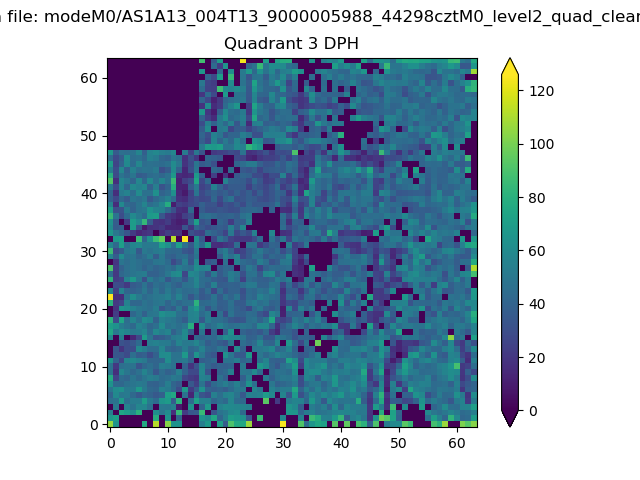 |
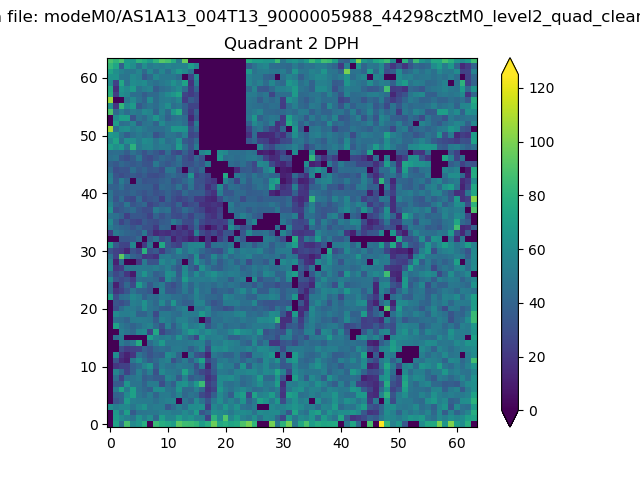 |
Quadrant C |
| Plot type | Count rate plots | Images |
|---|---|---|
| Comparison with Poisson distribution Blue bars denote a histogram of data divided into 1 sec bins. Red curve is a Poisson curve with rate = median count rate of data. |
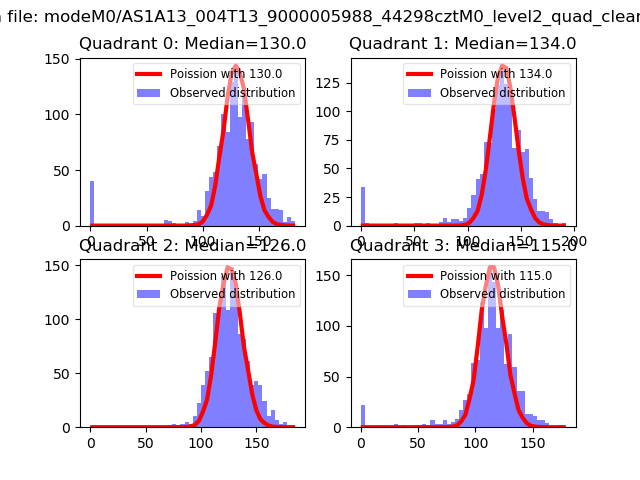 |
 |
| Quadrant-wise count rates Data is divided into 100 sec bins |
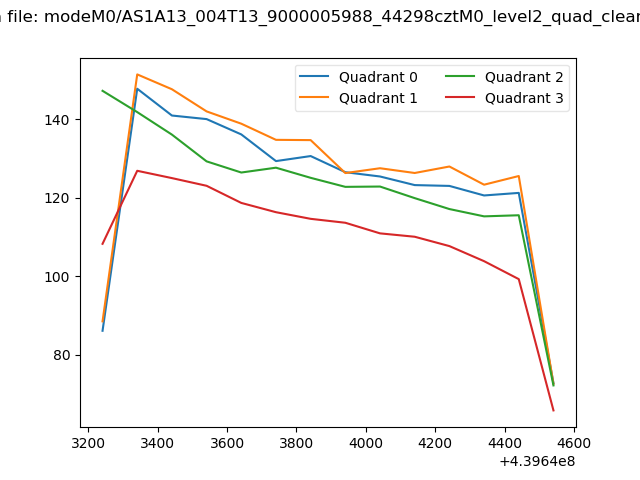 |
|
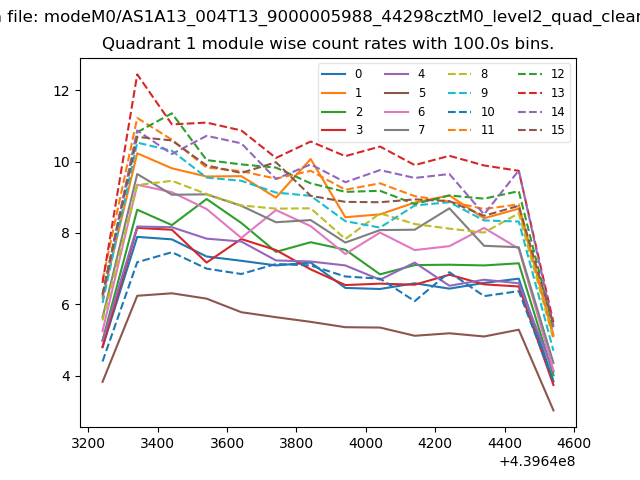
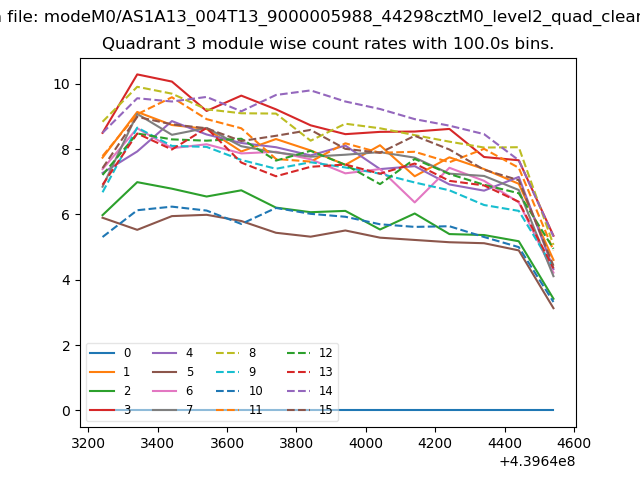
| Module-wise count rates for Quadrant A Data is divided into 100 sec bins |
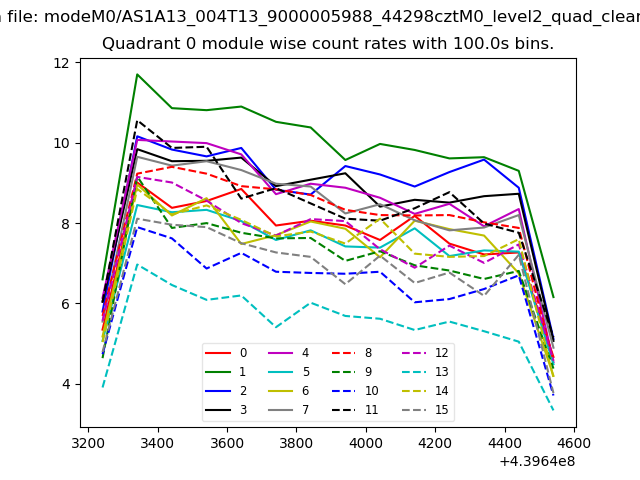 |
 |
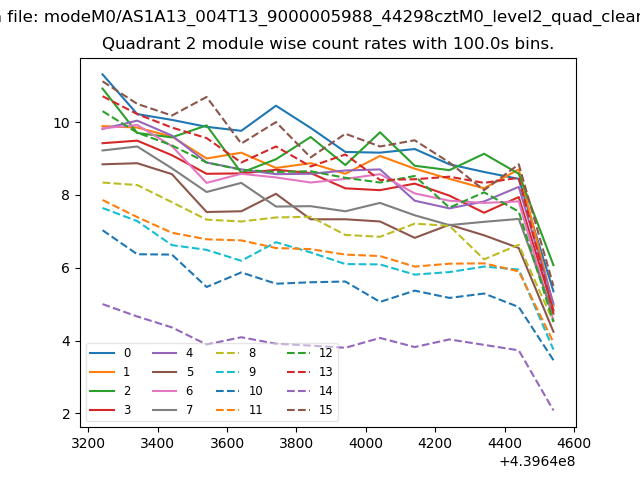
| Module-wise count rates for Quadrant B Data is divided into 100 sec bins |
 |
 |
| Module-wise count rates for Quadrant C Data is divided into 100 sec bins |
 |
 |
| Module-wise count rates for Quadrant D Data is divided into 100 sec bins |
 |
 |
| Parameter | Plot |
|---|---|
| CZT HV Monitor | 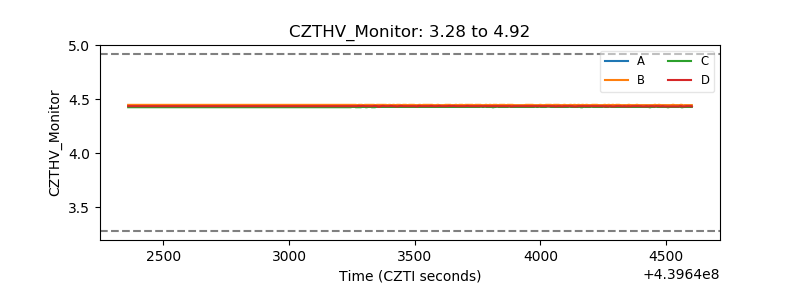 |
| D_VDD | 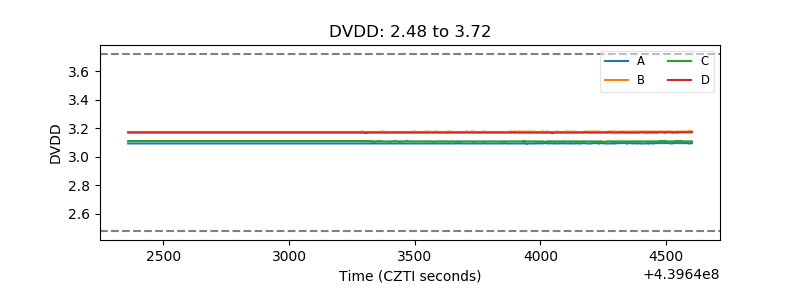 |
| Temperature 1 | 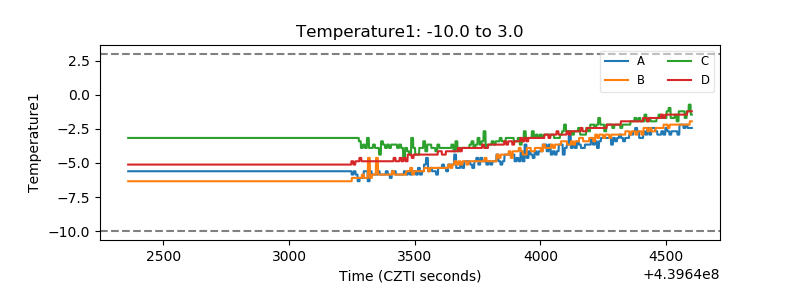 |
| Veto HV Monitor | 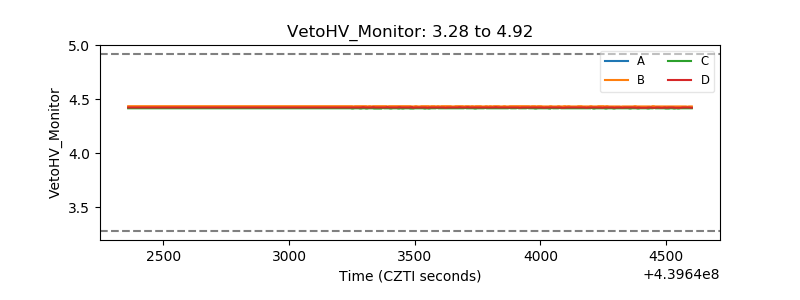 |
| Veto LLD | 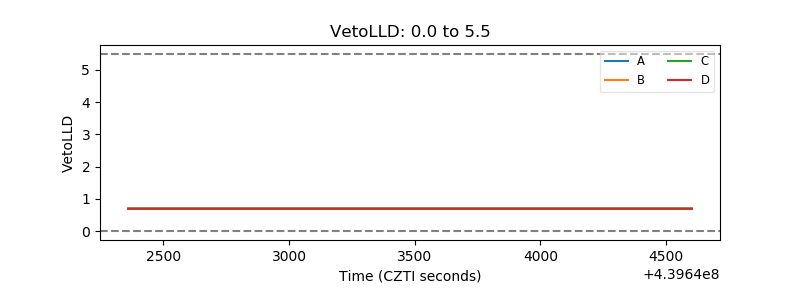 |
| Alpha Counter | 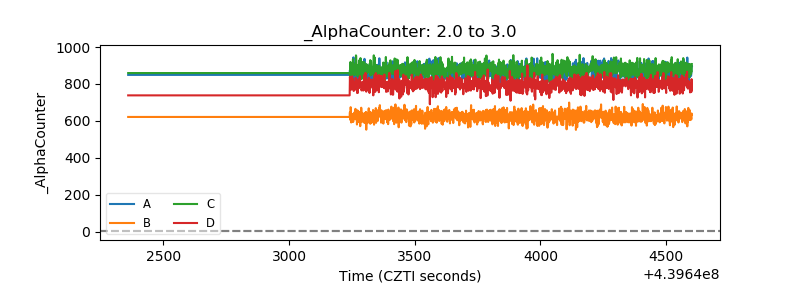 |
| _CPM_Rate | 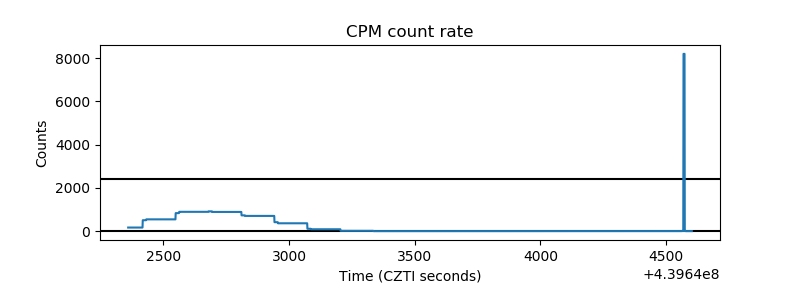 |
| CZT Counter | 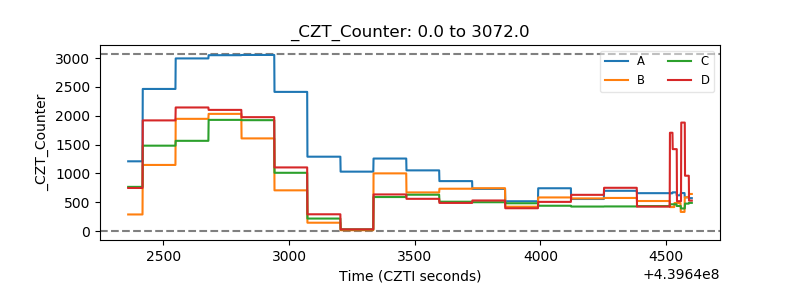 |
| +2.5 Volts monitor | 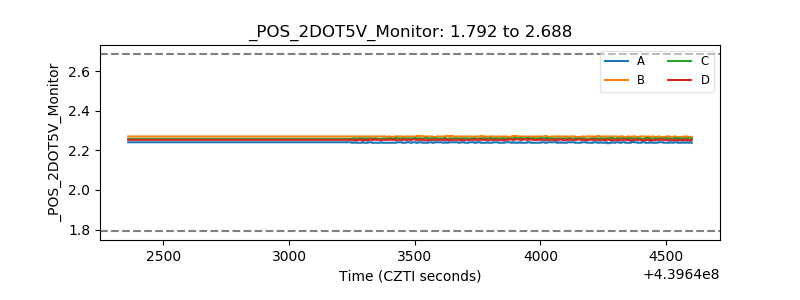 |
| +5 Volts monitor | 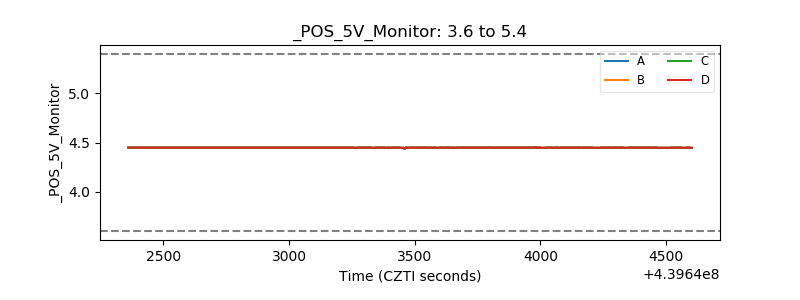 |
| _ROLL_ROT | 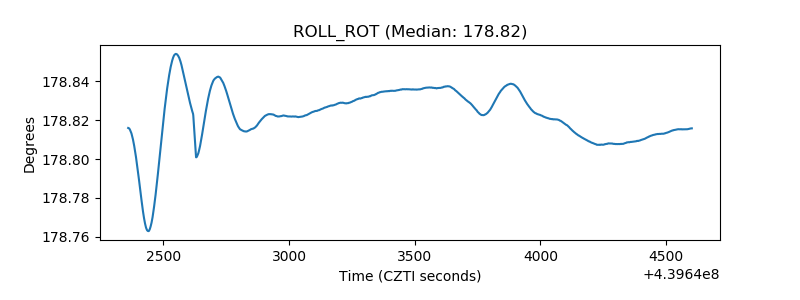 |
| _Roll_DEC | 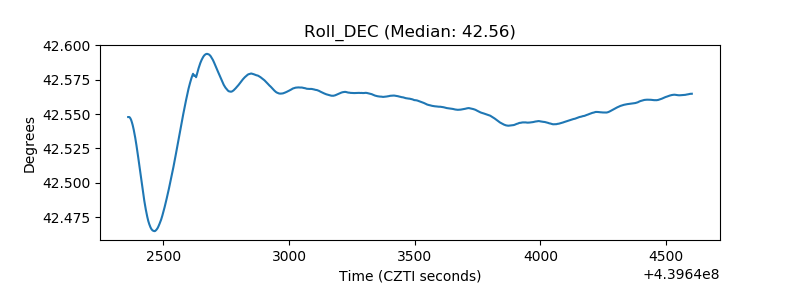 |
| _Roll_RA | 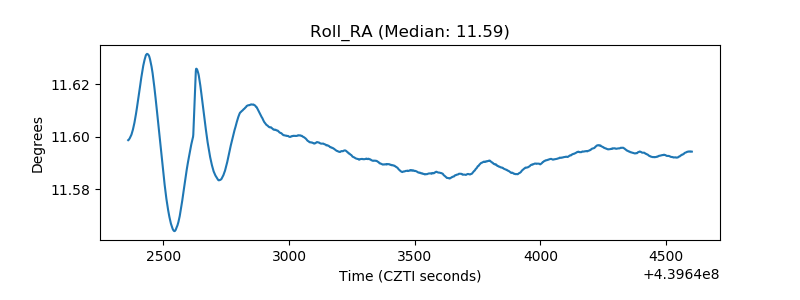 |
| Veto Counter | 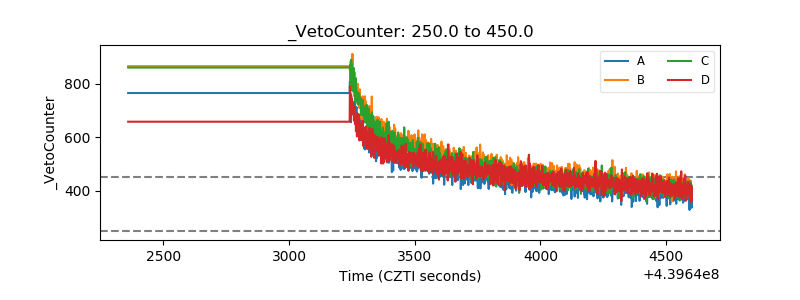 |