| Param | Original file | Final file |
|---|---|---|
| Filename | modeM0/AS1A13_004T13_9000005988_44299cztM0_level2.fits | modeM0/AS1A13_004T13_9000005988_44299cztM0_level2_quad_clean.evt |
| Size (bytes) | 474,909,120 | 112,919,040 |
| Size | 452.9 MB | 107.7 MB |
| Events in quadrant A | 5,051,631 | 768,198 |
| Events in quadrant B | 3,996,643 | 779,817 |
| Events in quadrant C | 3,261,804 | 751,119 |
| Events in quadrant D | 4,769,774 | 671,369 |
| Mode M0 | |||
|---|---|---|---|
| Quadrant | BADHDUFLAG | Total packets | Discarded packets |
| A | 0 | 20419 | 2 |
| B | 0 | 16241 | 2 |
| C | 0 | 13991 | 2 |
| D | 0 | 18412 | 2 |
| Mode SS | |||
|---|---|---|---|
| Quadrant | BADHDUFLAG | Total packets | Discarded packets |
| A | 0 | 130 | 0 |
| B | 0 | 130 | 0 |
| C | 0 | 130 | 0 |
| D | 0 | 130 | 0 |
| Mode M9 | |||
|---|---|---|---|
| Quadrant | BADHDUFLAG | Total packets | Discarded packets |
| A | 0 | 20 | 0 |
| B | 0 | 21 | 0 |
| C | 0 | 21 | 0 |
| D | 0 | 21 | 0 |
| Quadrant | Total seconds | Saturated seconds | Saturation percentage |
|---|---|---|---|
| A | 6437 | 254 | 3.945938% |
| B | 6437 | 273 | 4.241106% |
| C | 6437 | 103 | 1.600124% |
| D | 6437 | 439 | 6.819947% |
Noise dominated data is calculated using 1-second bins in cleaned event files. If a bin has >2000 counts, and if more than 50% of those come from <1% of pixels, then it is considered to be noise-dominated and hence unusable.
| Quadrant | # 1 sec bins | Bins with >0 counts | Bins with >2000 counts | High rate bins dominated by noise | Noise dominated (total time) | Noise dominated (detector-on time) | Marked lightcurve |
|---|---|---|---|---|---|---|---|
| A | 7582 | 6437 | 33 | 33 | 0.44% | 0.51% | 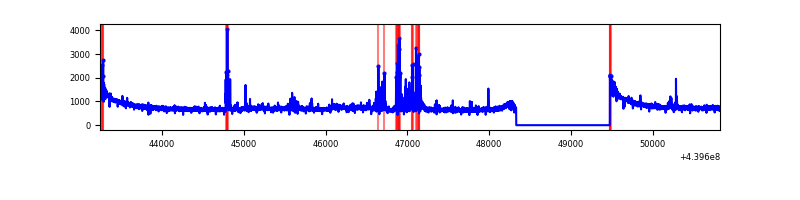 |
| B | 7582 | 6437 | 72 | 72 | 0.95% | 1.12% | 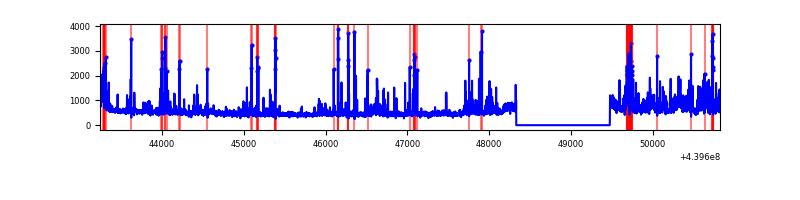 |
| C | 7582 | 6437 | 24 | 24 | 0.32% | 0.37% | 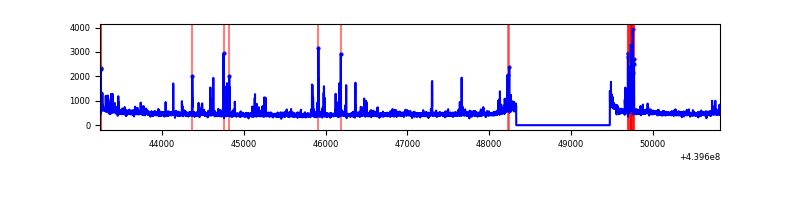 |
| D | 7582 | 6437 | 290 | 290 | 3.82% | 4.51% | 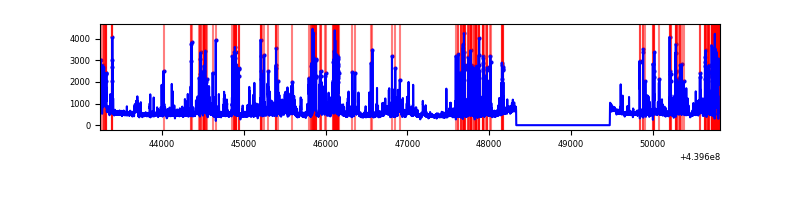 |
Top three noisy pixels from each quadrant. If the there are fewer than three noisy pixels in the level2.evt file, extra rows are filled as -1
| Pixel properties | Quadrant properties | ||||||
|---|---|---|---|---|---|---|---|
| Quadrant | DetID | PixID | Counts | Sigma | Mean | Median | Sigma |
| A | 10 | 83 | 1632917 | 10160.91 | 781 | 766 | 160.6 |
| A | 15 | 223 | 309768 | 1923.68 | 781 | 766 | 160.6 |
| A | 13 | 248 | 35971 | 219.17 | 781 | 766 | 160.6 |
| B | 5 | 255 | 363528 | 2452.11 | 765 | 741 | 147.9 |
| B | 0 | 200 | 164636 | 1107.78 | 765 | 741 | 147.9 |
| B | 0 | 190 | 150190 | 1010.14 | 765 | 741 | 147.9 |
| C | 14 | 254 | 197070 | 1101.61 | 757 | 763 | 178.2 |
| C | 3 | 233 | 50233 | 277.61 | 757 | 763 | 178.2 |
| C | 1 | 3 | 39448 | 217.09 | 757 | 763 | 178.2 |
| D | 13 | 249 | 822410 | 4416.13 | 752 | 731 | 186.1 |
| D | 1 | 52 | 182596 | 977.44 | 752 | 731 | 186.1 |
| D | 10 | 199 | 139024 | 743.26 | 752 | 731 | 186.1 |
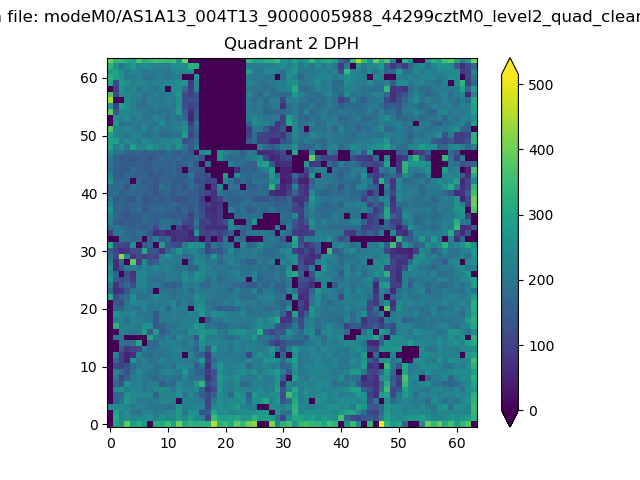
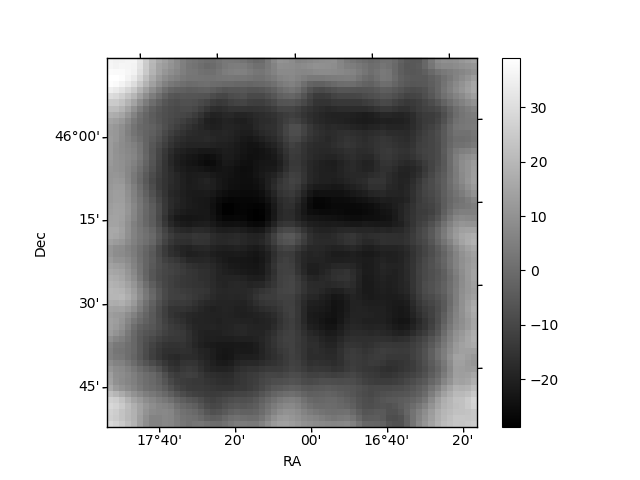
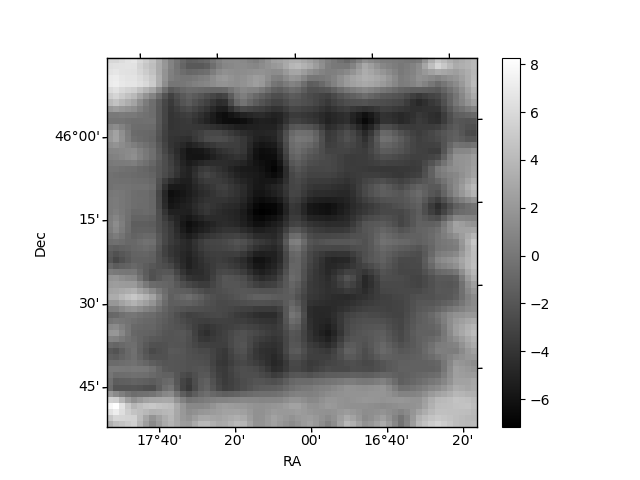
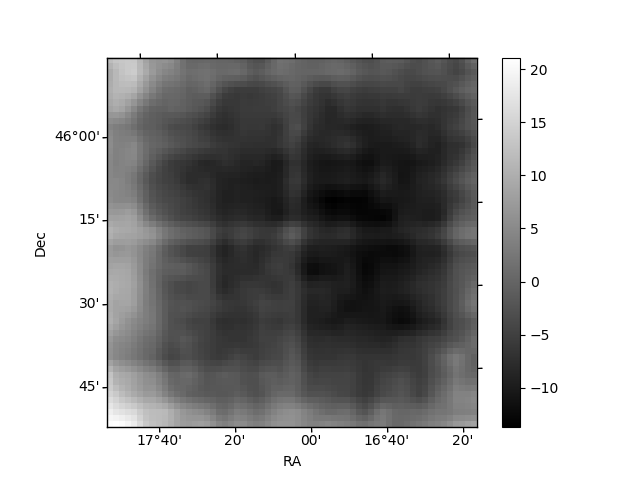
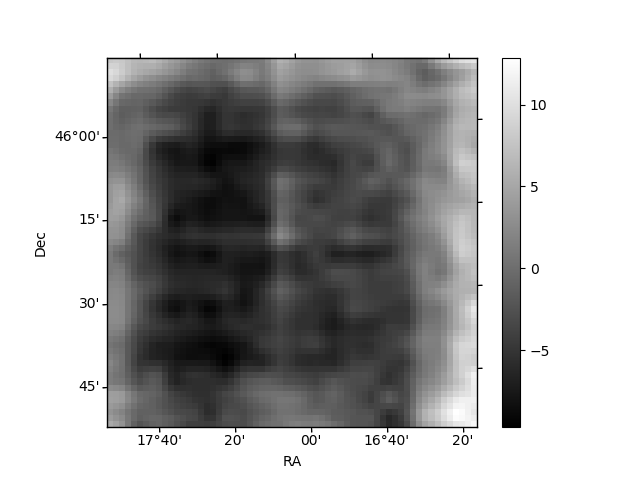
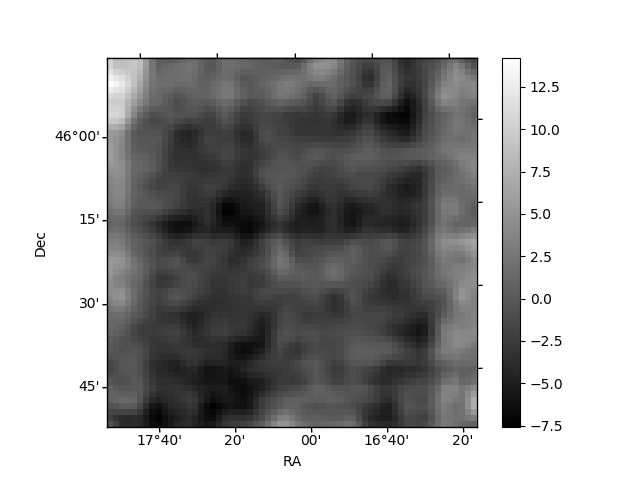
Histogram calculated using DETX and DETY for each event in the final _common_clean file
| Quadrant A | 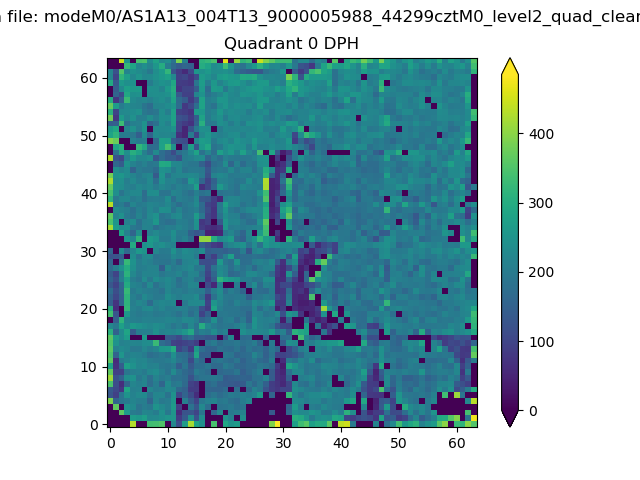 |
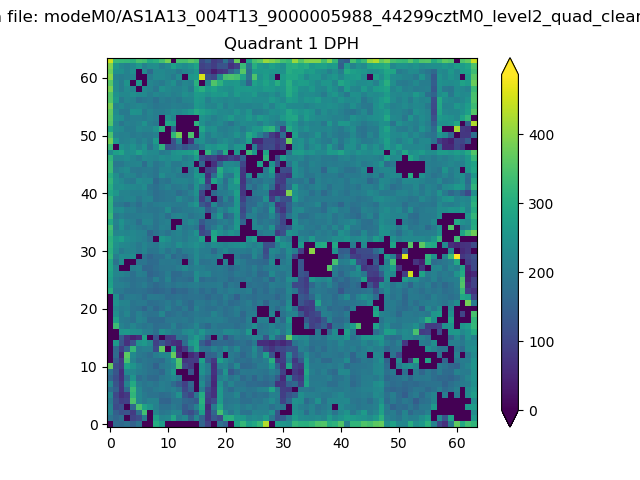 |
Quadrant B |
|---|---|---|---|
| Quadrant D | 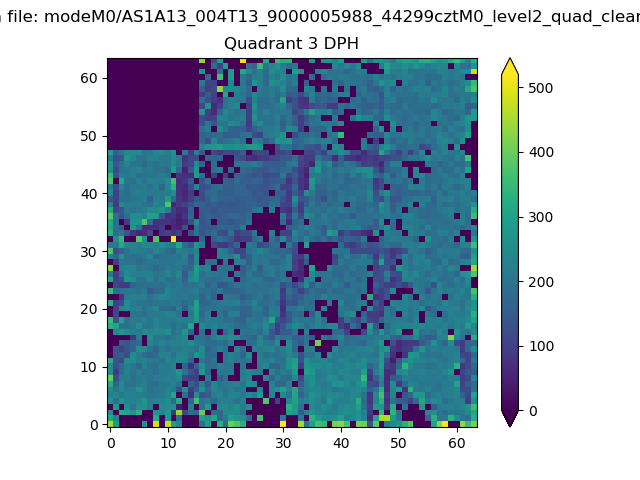 |
 |
Quadrant C |
| Plot type | Count rate plots | Images |
|---|---|---|
| Comparison with Poisson distribution Blue bars denote a histogram of data divided into 1 sec bins. Red curve is a Poisson curve with rate = median count rate of data. |
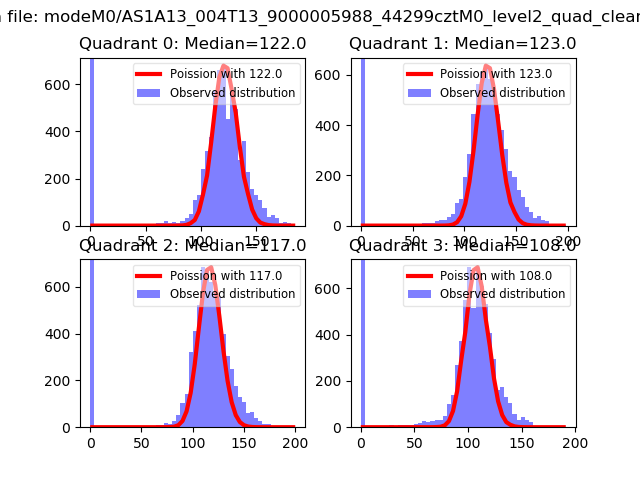 |
 |
| Quadrant-wise count rates Data is divided into 100 sec bins |
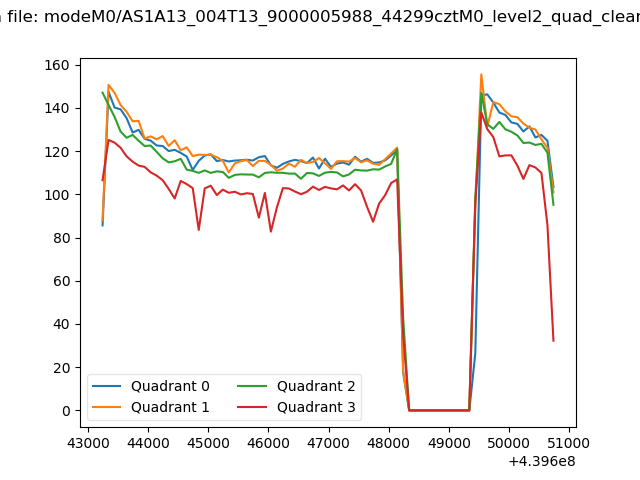 |
|
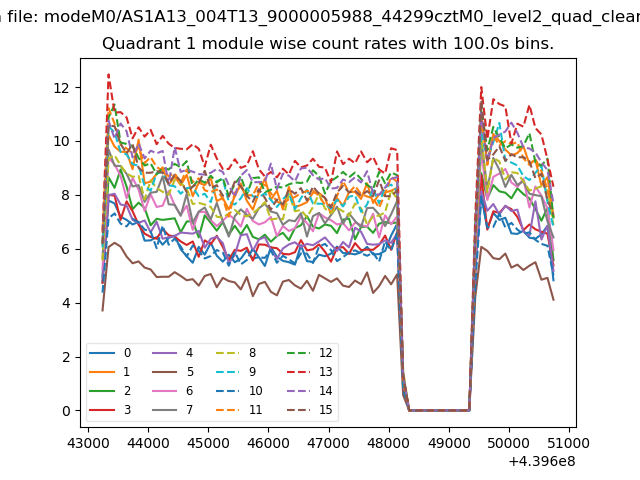
| Module-wise count rates for Quadrant A Data is divided into 100 sec bins |
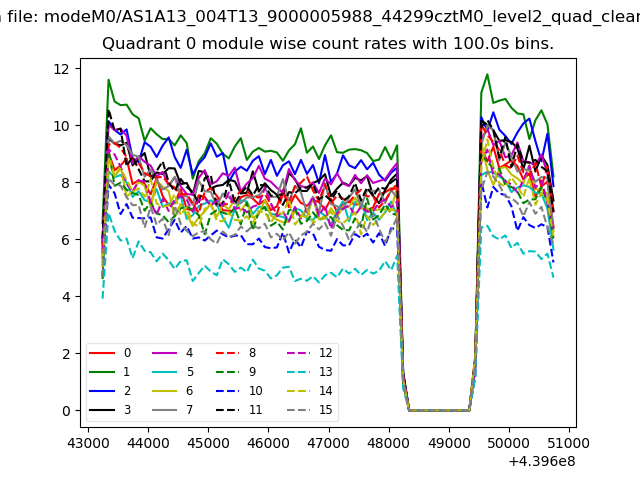 |
 |
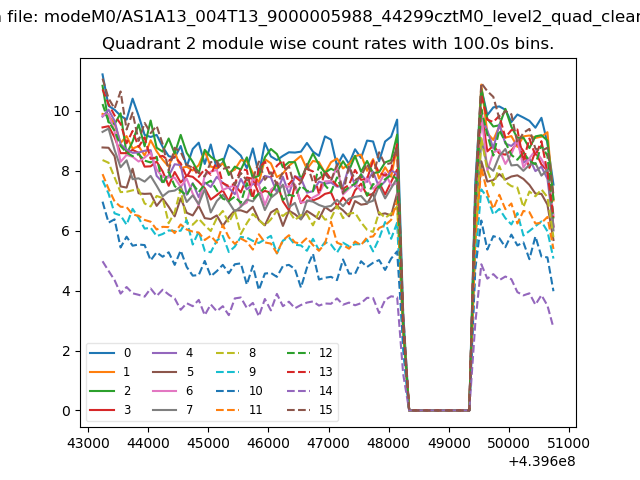
| Module-wise count rates for Quadrant B Data is divided into 100 sec bins |
 |
 |
| Module-wise count rates for Quadrant C Data is divided into 100 sec bins |
 |
 |
| Module-wise count rates for Quadrant D Data is divided into 100 sec bins |
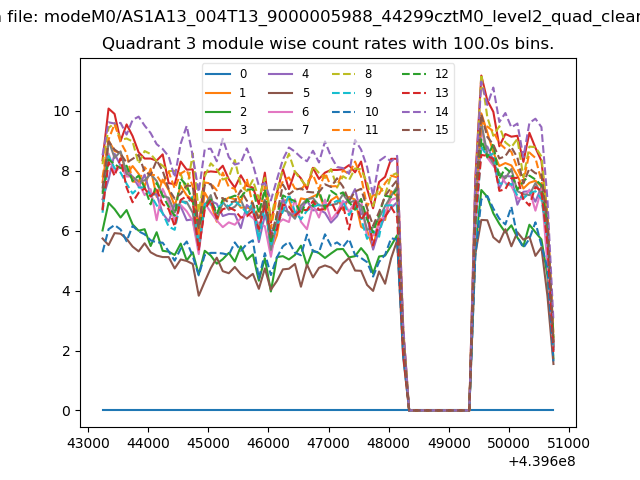 |
 |
| Parameter | Plot |
|---|---|
| CZT HV Monitor | 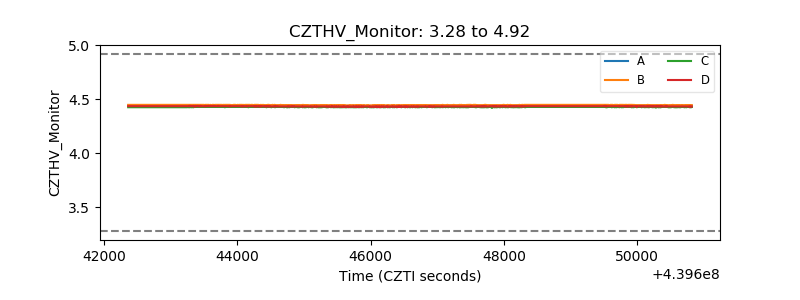 |
| D_VDD | 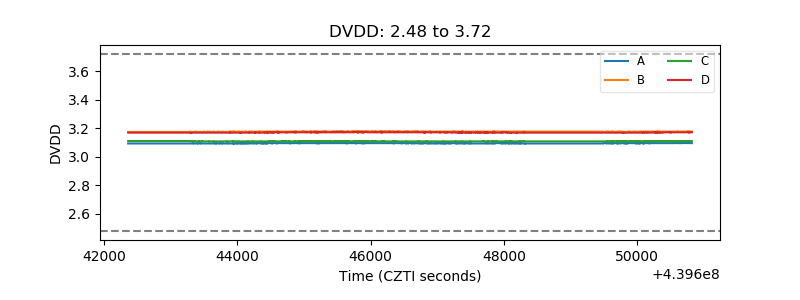 |
| Temperature 1 |  |
| Veto HV Monitor | 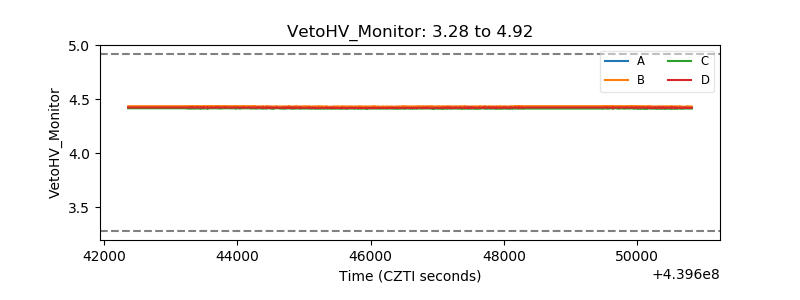 |
| Veto LLD | 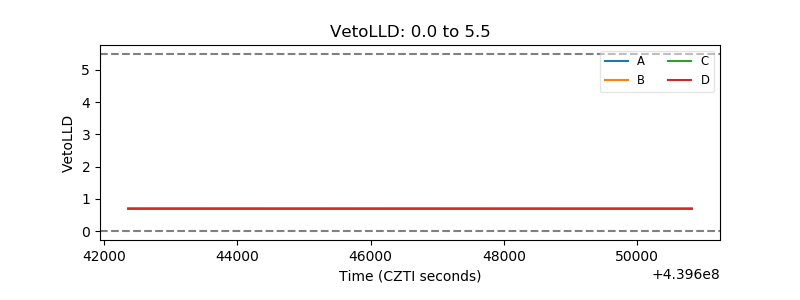 |
| Alpha Counter | 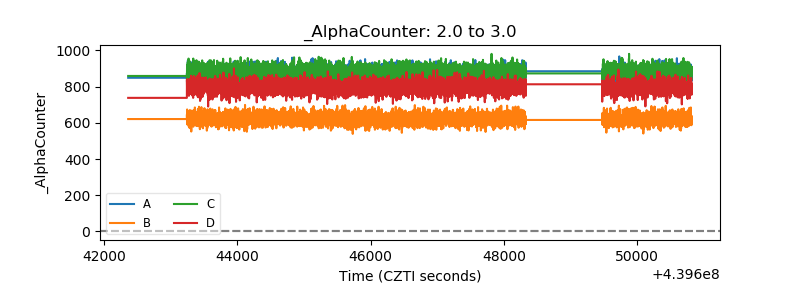 |
| _CPM_Rate | 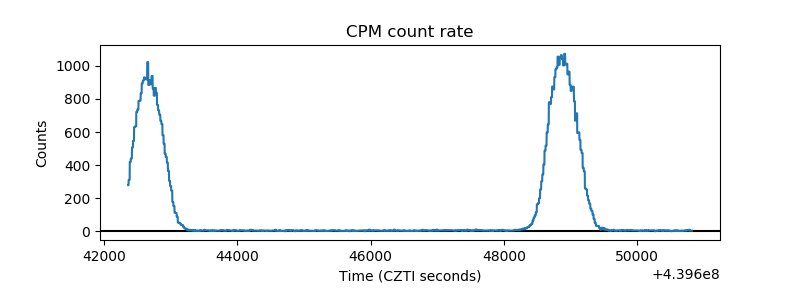 |
| CZT Counter | 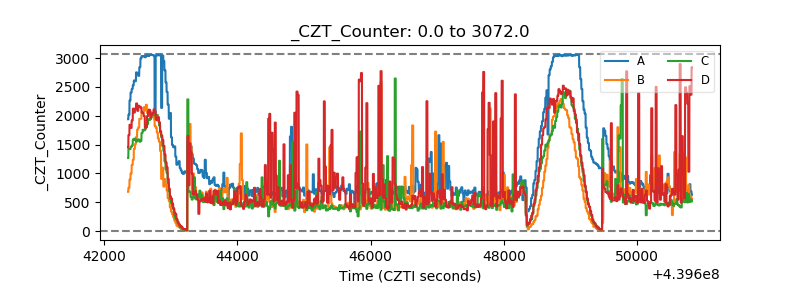 |
| +2.5 Volts monitor | 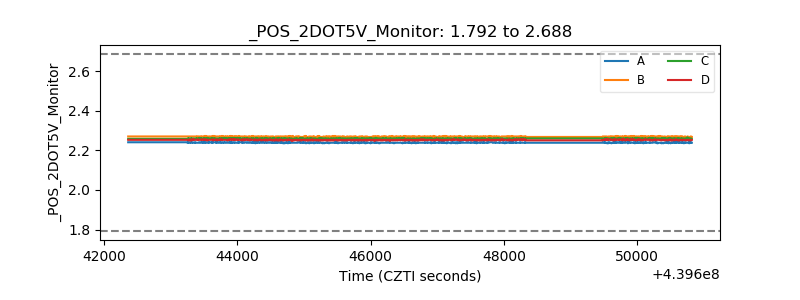 |
| +5 Volts monitor | 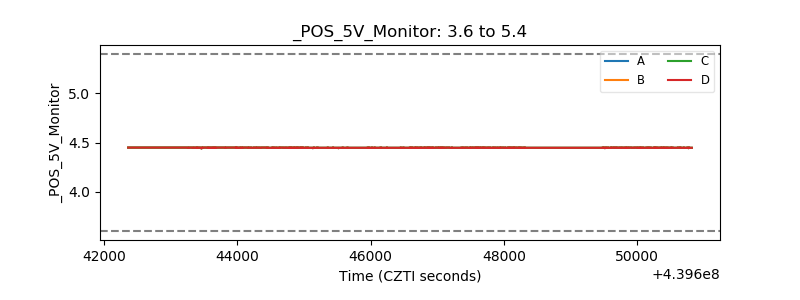 |
| _ROLL_ROT | 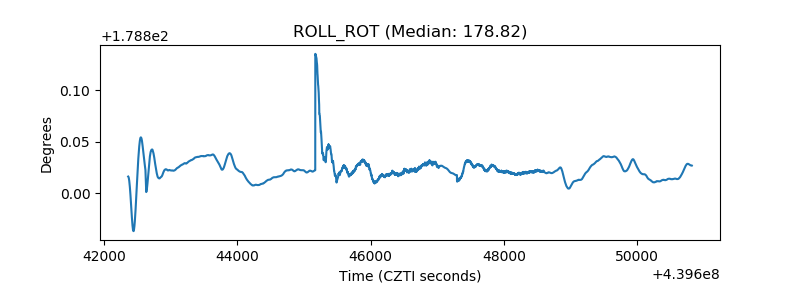 |
| _Roll_DEC | 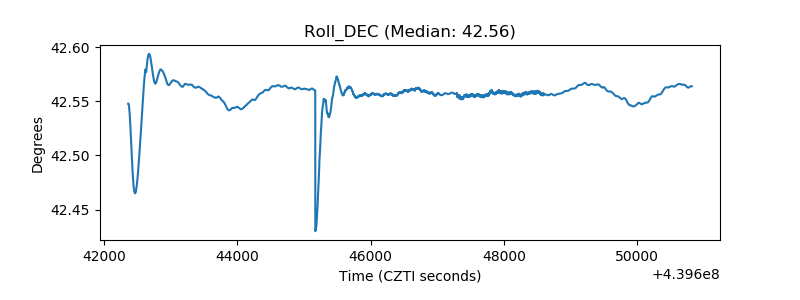 |
| _Roll_RA | 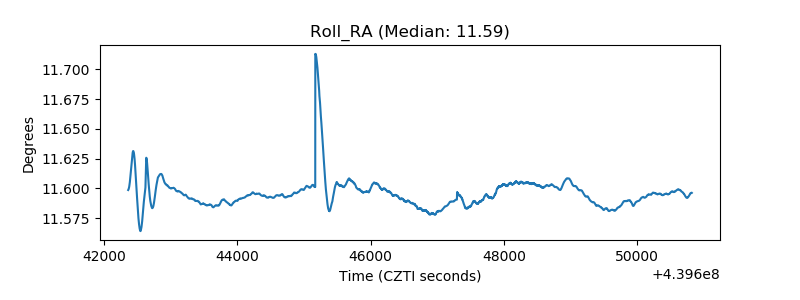 |
| Veto Counter | 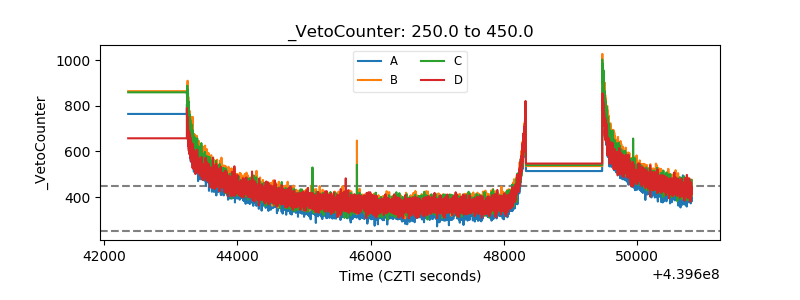 |