| Param | Original file | Final file |
|---|---|---|
| Filename | modeM0/AS1A13_004T13_9000005988_44300cztM0_level2.fits | modeM0/AS1A13_004T13_9000005988_44300cztM0_level2_quad_clean.evt |
| Size (bytes) | 498,571,200 | 115,151,040 |
| Size | 475.5 MB | 109.8 MB |
| Events in quadrant A | 4,934,943 | 798,549 |
| Events in quadrant B | 4,046,248 | 802,087 |
| Events in quadrant C | 3,246,772 | 774,360 |
| Events in quadrant D | 5,719,605 | 655,373 |
| Mode M0 | |||
|---|---|---|---|
| Quadrant | BADHDUFLAG | Total packets | Discarded packets |
| A | 0 | 20123 | 2 |
| B | 0 | 16412 | 2 |
| C | 0 | 14011 | 2 |
| D | 0 | 21414 | 2 |
| Mode SS | |||
|---|---|---|---|
| Quadrant | BADHDUFLAG | Total packets | Discarded packets |
| A | 0 | 134 | 0 |
| B | 0 | 134 | 0 |
| C | 0 | 134 | 0 |
| D | 0 | 134 | 0 |
| Mode M9 | |||
|---|---|---|---|
| Quadrant | BADHDUFLAG | Total packets | Discarded packets |
| A | 0 | 12 | 0 |
| B | 0 | 12 | 0 |
| C | 0 | 12 | 0 |
| D | 0 | 12 | 0 |
| Quadrant | Total seconds | Saturated seconds | Saturation percentage |
|---|---|---|---|
| A | 6542 | 187 | 2.858453% |
| B | 6542 | 230 | 3.515744% |
| C | 6542 | 76 | 1.161724% |
| D | 6541 | 782 | 11.955359% |
Noise dominated data is calculated using 1-second bins in cleaned event files. If a bin has >2000 counts, and if more than 50% of those come from <1% of pixels, then it is considered to be noise-dominated and hence unusable.
| Quadrant | # 1 sec bins | Bins with >0 counts | Bins with >2000 counts | High rate bins dominated by noise | Noise dominated (total time) | Noise dominated (detector-on time) | Marked lightcurve |
|---|---|---|---|---|---|---|---|
| A | 7742 | 6543 | 11 | 11 | 0.14% | 0.17% | 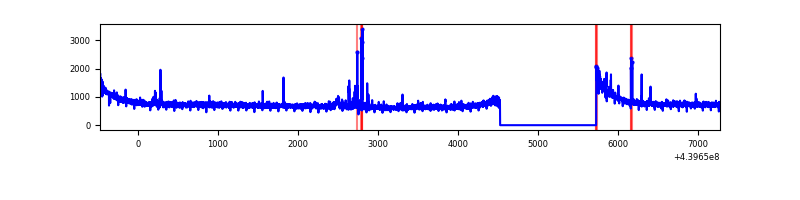 |
| B | 7742 | 6543 | 87 | 87 | 1.12% | 1.33% | 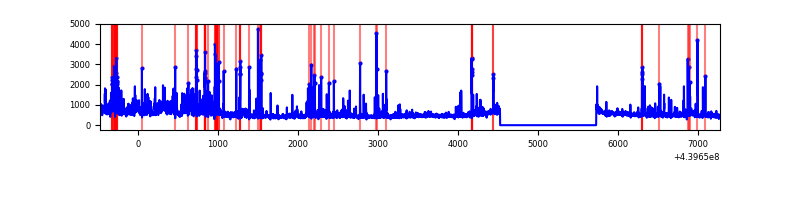 |
| C | 7742 | 6543 | 25 | 25 | 0.32% | 0.38% | 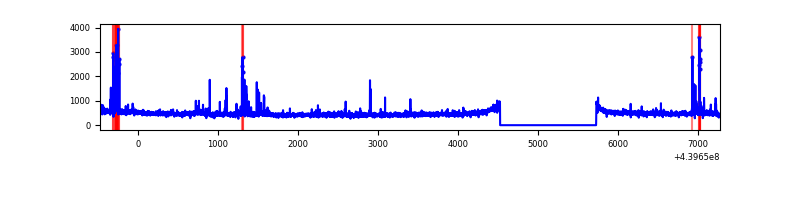 |
| D | 7741 | 6542 | 643 | 643 | 8.31% | 9.83% | 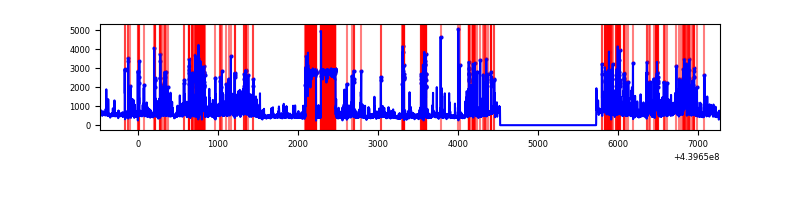 |
Top three noisy pixels from each quadrant. If the there are fewer than three noisy pixels in the level2.evt file, extra rows are filled as -1
| Pixel properties | Quadrant properties | ||||||
|---|---|---|---|---|---|---|---|
| Quadrant | DetID | PixID | Counts | Sigma | Mean | Median | Sigma |
| A | 10 | 83 | 1735386 | 10567.72 | 794 | 777 | 164.1 |
| A | 15 | 223 | 46422 | 278.08 | 794 | 777 | 164.1 |
| A | 13 | 248 | 36545 | 217.91 | 794 | 777 | 164.1 |
| B | 5 | 255 | 215566 | 1438.72 | 775 | 751 | 149.3 |
| B | 0 | 200 | 181563 | 1210.98 | 775 | 751 | 149.3 |
| B | 5 | 172 | 181051 | 1207.55 | 775 | 751 | 149.3 |
| C | 14 | 254 | 187155 | 1043.97 | 766 | 771 | 178.5 |
| C | 3 | 233 | 49691 | 274.01 | 766 | 771 | 178.5 |
| C | 15 | 208 | 12347 | 64.84 | 766 | 771 | 178.5 |
| D | 13 | 249 | 954194 | 5214.77 | 732 | 712 | 182.8 |
| D | 1 | 20 | 825849 | 4512.83 | 732 | 712 | 182.8 |
| D | 13 | 171 | 235541 | 1284.32 | 732 | 712 | 182.8 |
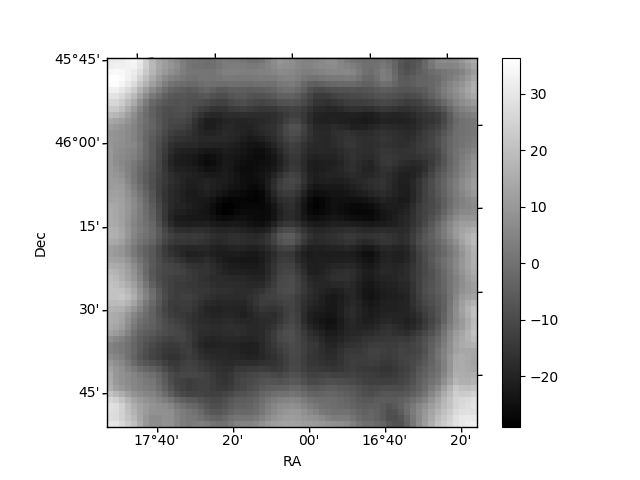
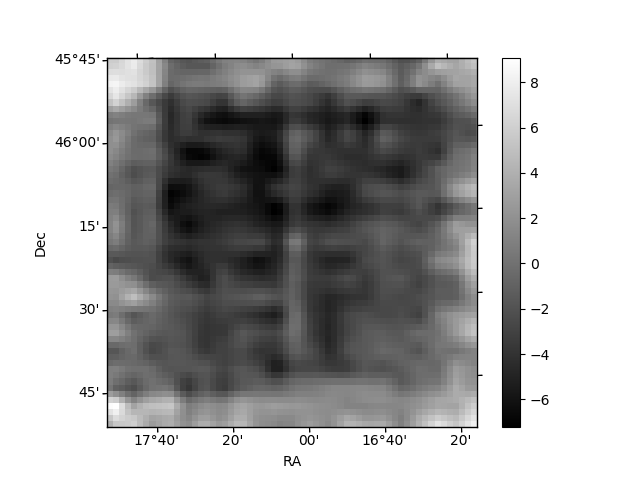
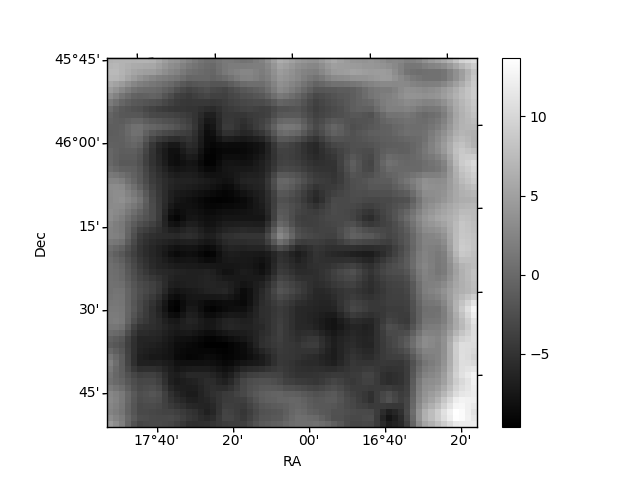
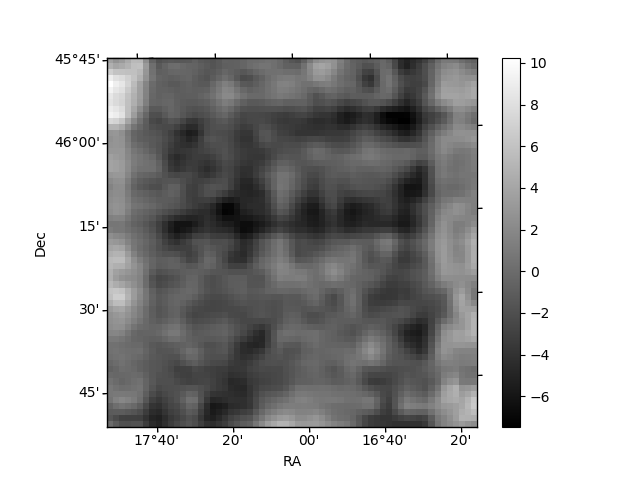
Histogram calculated using DETX and DETY for each event in the final _common_clean file
| Quadrant A | 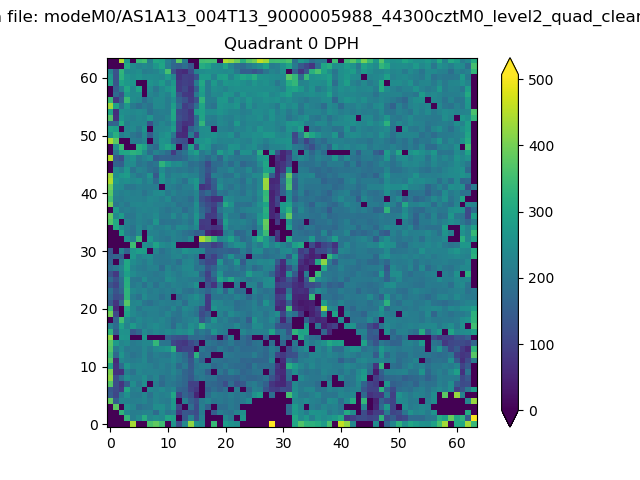 |
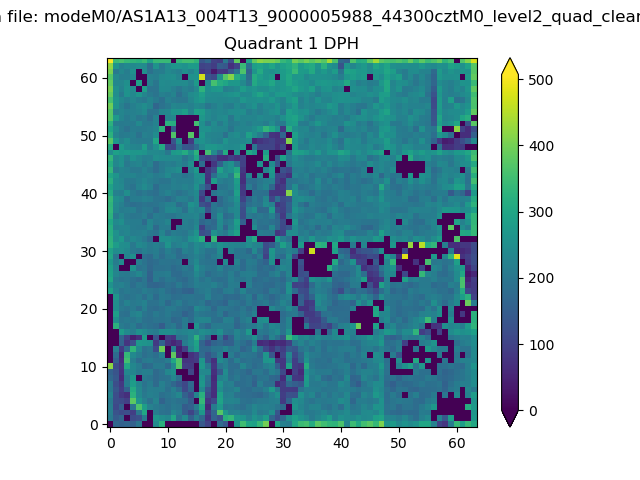 |
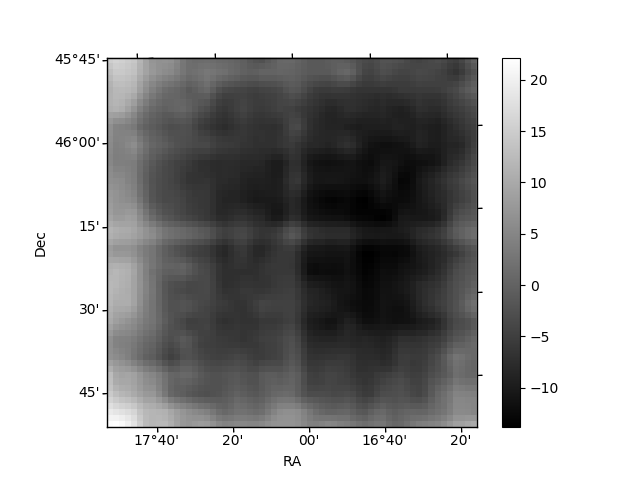
Quadrant B |
|---|---|---|---|
| Quadrant D | 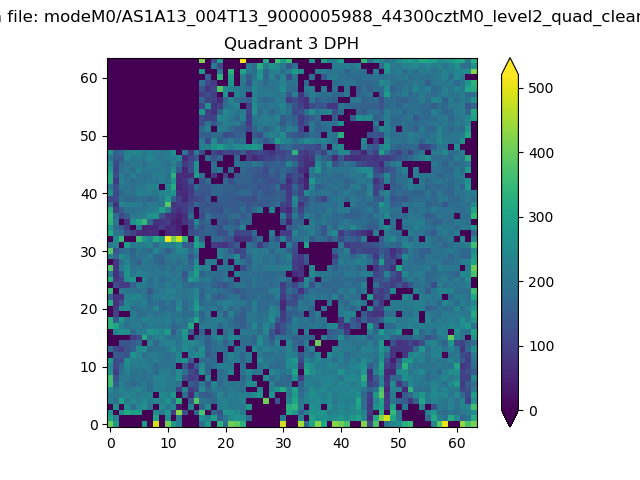 |
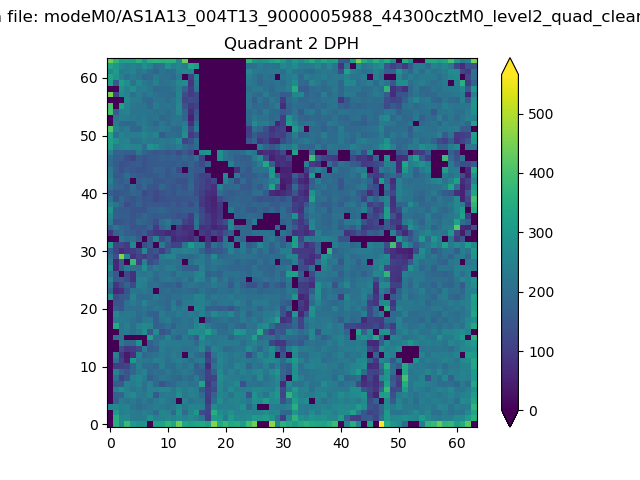 |
Quadrant C |
| Plot type | Count rate plots | Images |
|---|---|---|
| Comparison with Poisson distribution Blue bars denote a histogram of data divided into 1 sec bins. Red curve is a Poisson curve with rate = median count rate of data. |
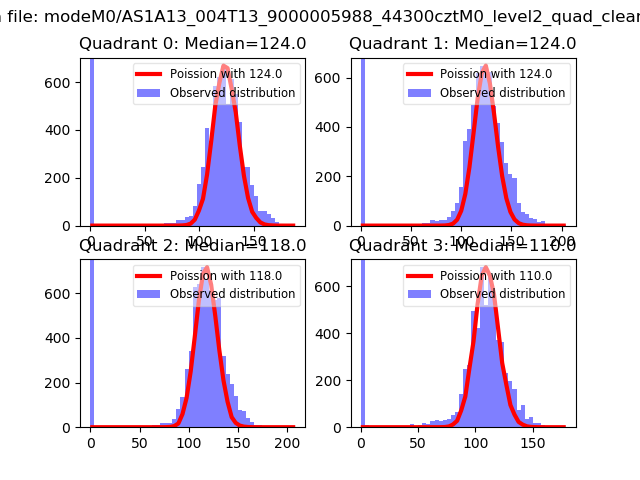 |
 |
| Quadrant-wise count rates Data is divided into 100 sec bins |
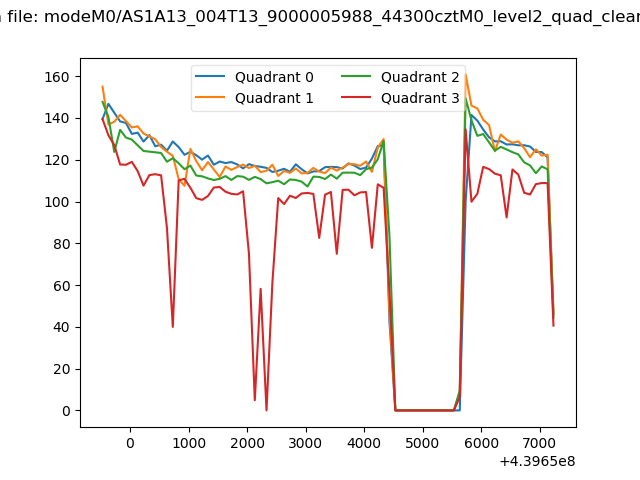 |
|
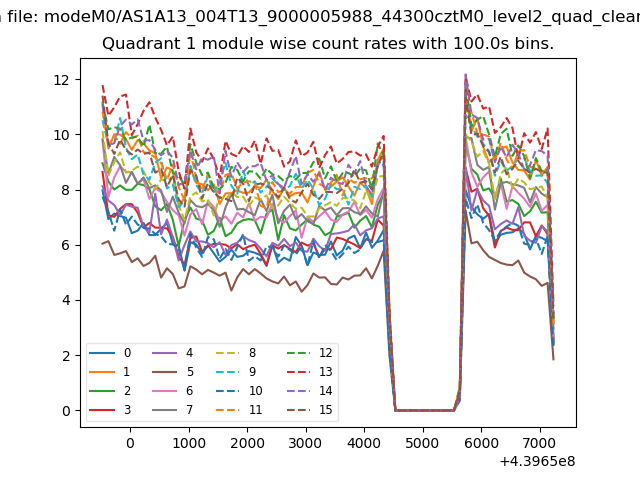
| Module-wise count rates for Quadrant A Data is divided into 100 sec bins |
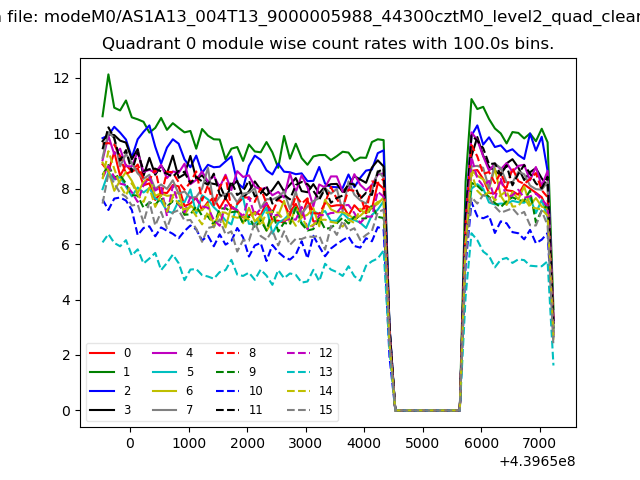 |
 |
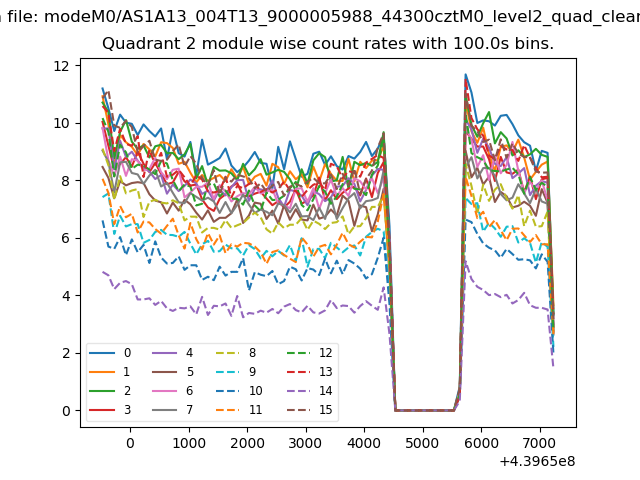
| Module-wise count rates for Quadrant B Data is divided into 100 sec bins |
 |
 |
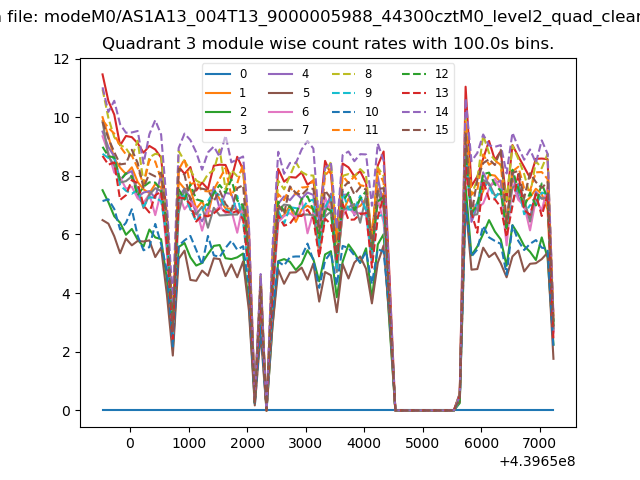
| Module-wise count rates for Quadrant C Data is divided into 100 sec bins |
 |
 |
| Module-wise count rates for Quadrant D Data is divided into 100 sec bins |
 |
 |
| Parameter | Plot |
|---|---|
| CZT HV Monitor | 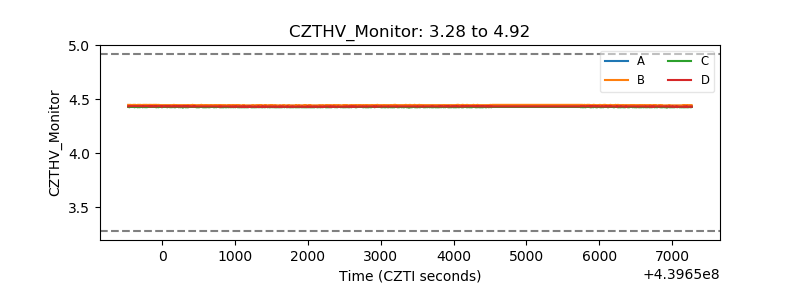 |
| D_VDD | 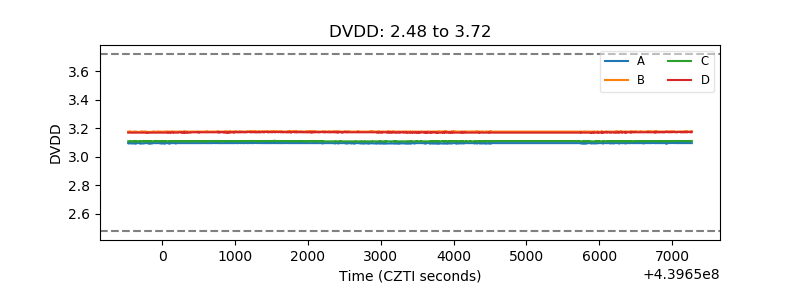 |
| Temperature 1 | 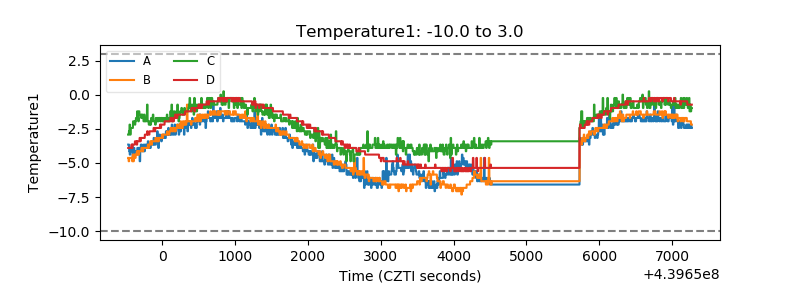 |
| Veto HV Monitor | 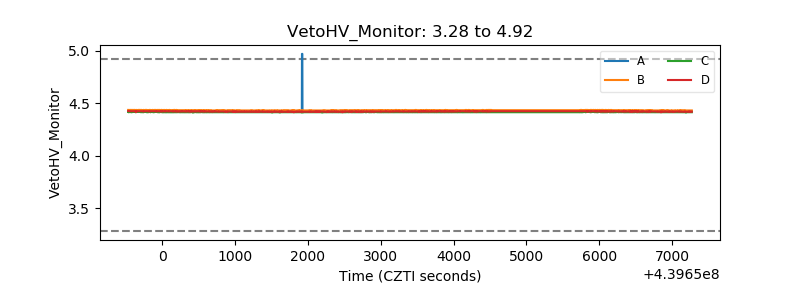 |
| Veto LLD | 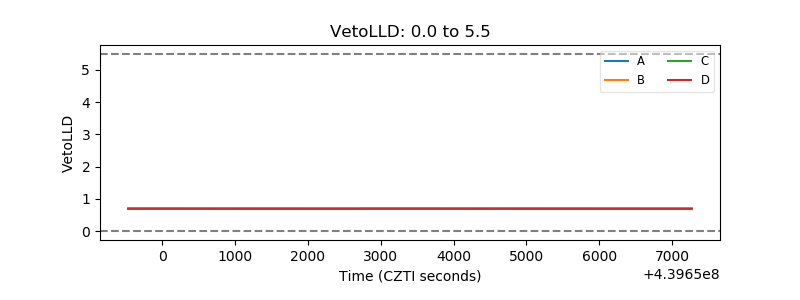 |
| Alpha Counter | 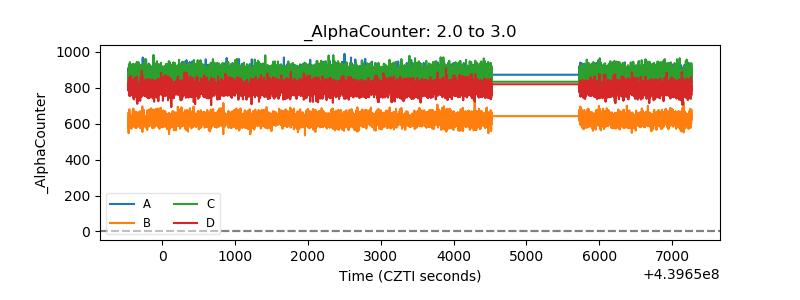 |
| _CPM_Rate | 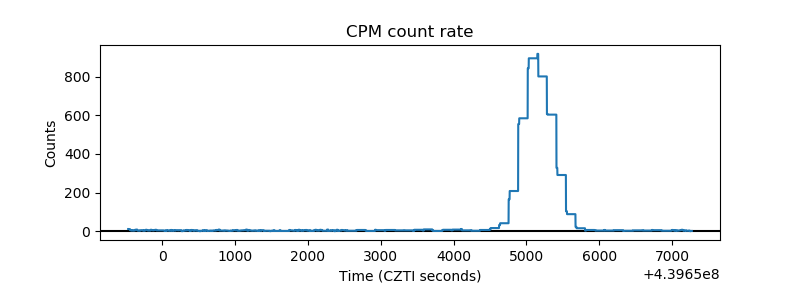 |
| CZT Counter | 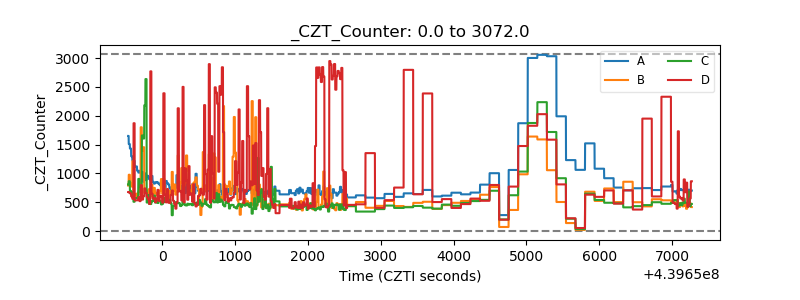 |
| +2.5 Volts monitor | 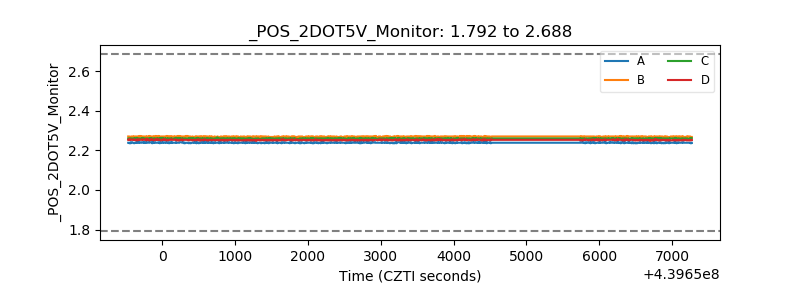 |
| +5 Volts monitor | 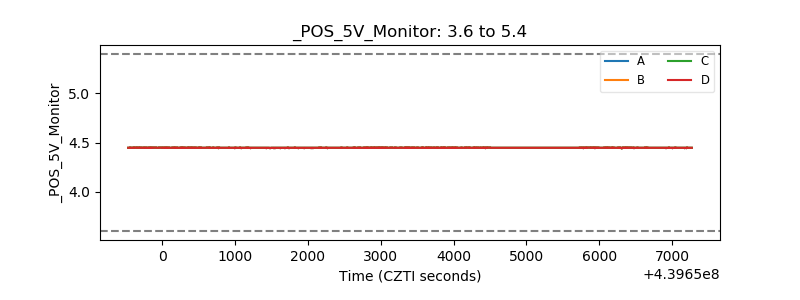 |
| _ROLL_ROT | 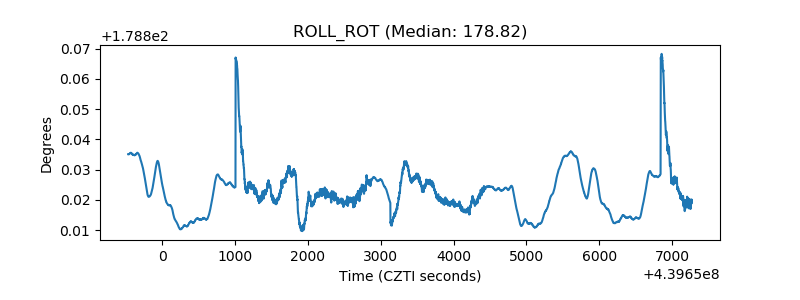 |
| _Roll_DEC | 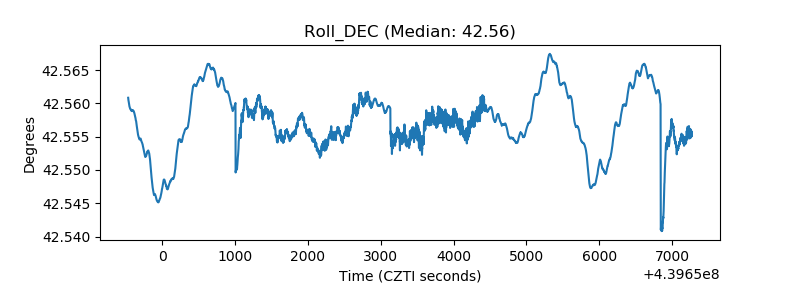 |
| _Roll_RA | 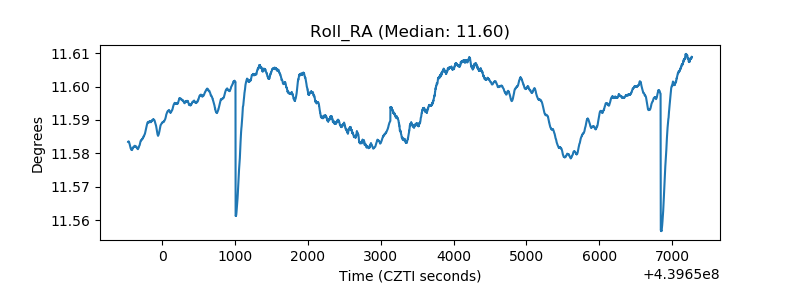 |
| Veto Counter | 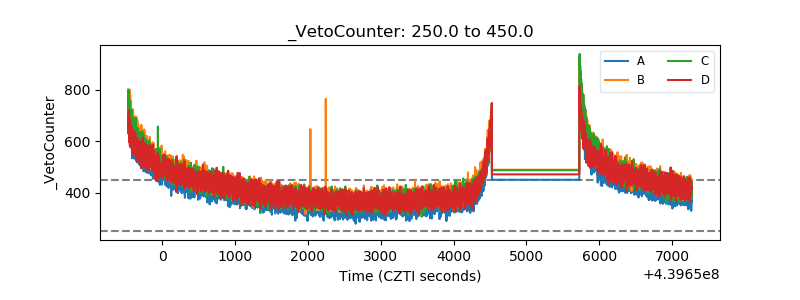 |