| Param | Original file | Final file |
|---|---|---|
| Filename | modeM0/AS1A13_004T13_9000005988_44301cztM0_level2.fits | modeM0/AS1A13_004T13_9000005988_44301cztM0_level2_quad_clean.evt |
| Size (bytes) | 491,644,800 | 115,269,120 |
| Size | 468.9 MB | 109.9 MB |
| Events in quadrant A | 4,966,201 | 785,487 |
| Events in quadrant B | 3,969,150 | 786,820 |
| Events in quadrant C | 3,243,257 | 773,531 |
| Events in quadrant D | 5,503,108 | 679,791 |
| Mode M0 | |||
|---|---|---|---|
| Quadrant | BADHDUFLAG | Total packets | Discarded packets |
| A | 0 | 20209 | 2 |
| B | 0 | 16219 | 2 |
| C | 0 | 14195 | 2 |
| D | 0 | 20911 | 2 |
| Mode SS | |||
|---|---|---|---|
| Quadrant | BADHDUFLAG | Total packets | Discarded packets |
| A | 0 | 136 | 0 |
| B | 0 | 136 | 0 |
| C | 0 | 136 | 0 |
| D | 0 | 136 | 0 |
| Mode M9 | |||
|---|---|---|---|
| Quadrant | BADHDUFLAG | Total packets | Discarded packets |
| A | 0 | 11 | 0 |
| B | 0 | 11 | 0 |
| C | 0 | 11 | 0 |
| D | 0 | 11 | 0 |
| Quadrant | Total seconds | Saturated seconds | Saturation percentage |
|---|---|---|---|
| A | 6663 | 231 | 3.466907% |
| B | 6664 | 329 | 4.936975% |
| C | 6663 | 80 | 1.200660% |
| D | 6663 | 583 | 8.749812% |
Noise dominated data is calculated using 1-second bins in cleaned event files. If a bin has >2000 counts, and if more than 50% of those come from <1% of pixels, then it is considered to be noise-dominated and hence unusable.
| Quadrant | # 1 sec bins | Bins with >0 counts | Bins with >2000 counts | High rate bins dominated by noise | Noise dominated (total time) | Noise dominated (detector-on time) | Marked lightcurve |
|---|---|---|---|---|---|---|---|
| A | 7788 | 6663 | 13 | 13 | 0.17% | 0.20% | 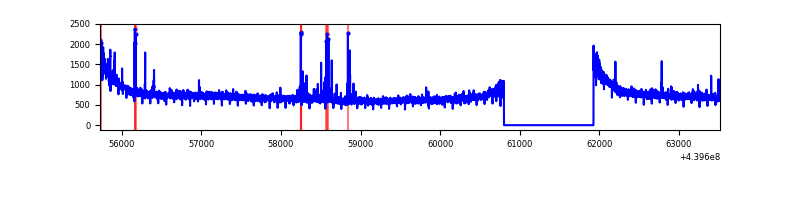 |
| B | 7789 | 6665 | 167 | 167 | 2.14% | 2.51% | 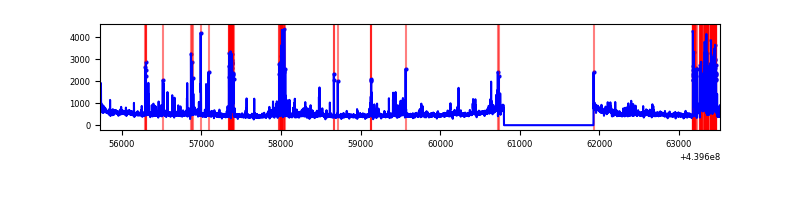 |
| C | 7788 | 6664 | 12 | 12 | 0.15% | 0.18% |  |
| D | 7788 | 6664 | 408 | 408 | 5.24% | 6.12% | 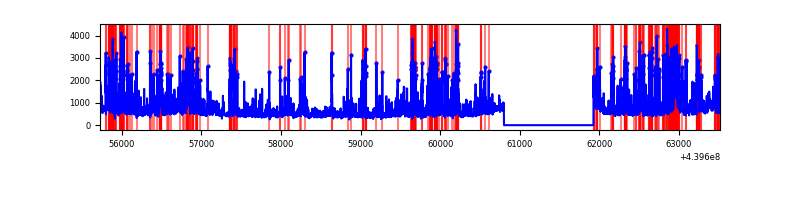 |
Top three noisy pixels from each quadrant. If the there are fewer than three noisy pixels in the level2.evt file, extra rows are filled as -1
| Pixel properties | Quadrant properties | ||||||
|---|---|---|---|---|---|---|---|
| Quadrant | DetID | PixID | Counts | Sigma | Mean | Median | Sigma |
| A | 10 | 83 | 1782272 | 10821.31 | 795 | 779 | 164.6 |
| A | 7 | 3 | 48511 | 289.94 | 795 | 779 | 164.6 |
| A | 10 | 248 | 24546 | 144.37 | 795 | 779 | 164.6 |
| B | 10 | 245 | 447043 | 2982.44 | 771 | 748 | 149.6 |
| B | 0 | 219 | 136773 | 909.01 | 771 | 748 | 149.6 |
| B | 4 | 158 | 97093 | 643.84 | 771 | 748 | 149.6 |
| C | 14 | 254 | 140557 | 762.35 | 779 | 785 | 183.3 |
| C | 1 | 3 | 30207 | 160.47 | 779 | 785 | 183.3 |
| C | 3 | 233 | 25565 | 135.16 | 779 | 785 | 183.3 |
| D | 13 | 249 | 959011 | 5059.13 | 765 | 742 | 189.4 |
| D | 2 | 153 | 266855 | 1404.93 | 765 | 742 | 189.4 |
| D | 13 | 171 | 266224 | 1401.6 | 765 | 742 | 189.4 |
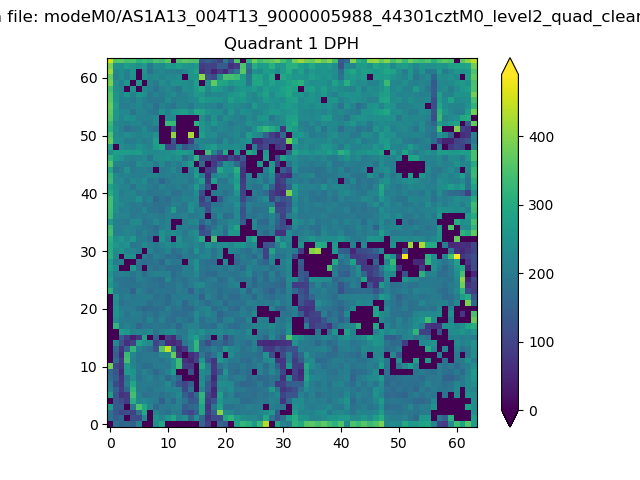
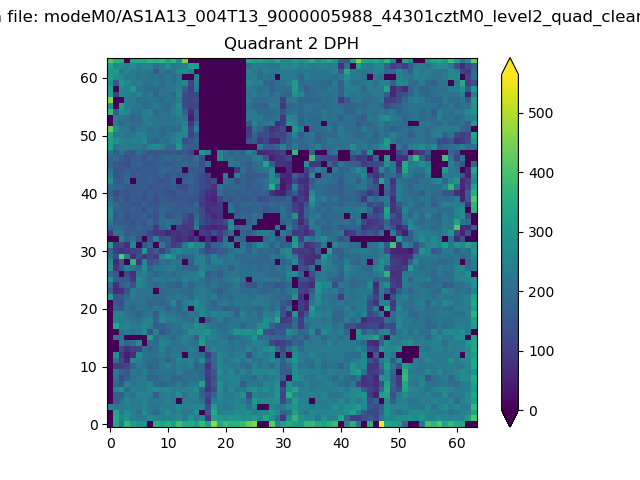
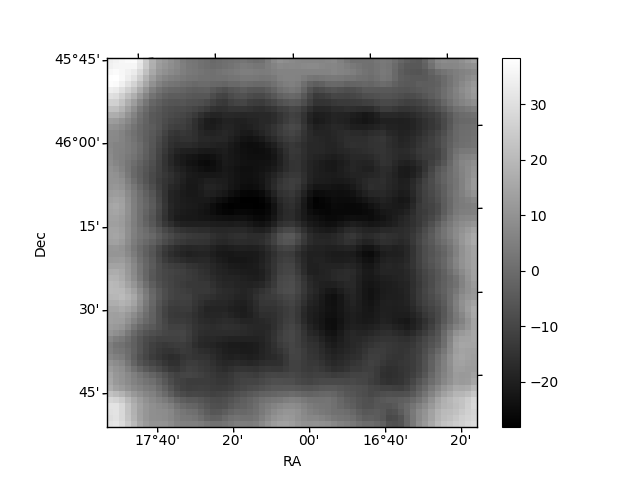
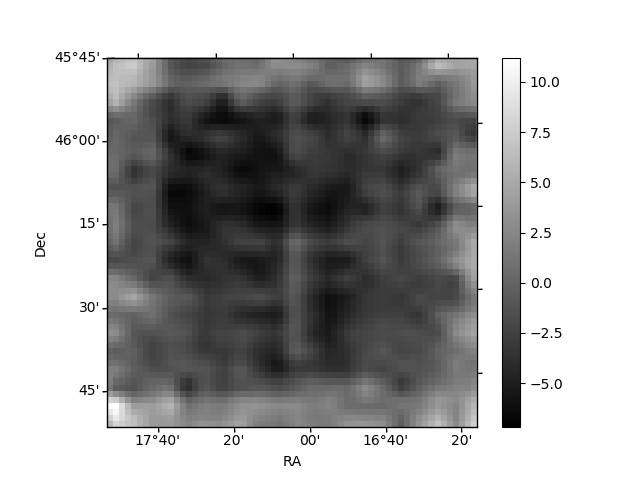
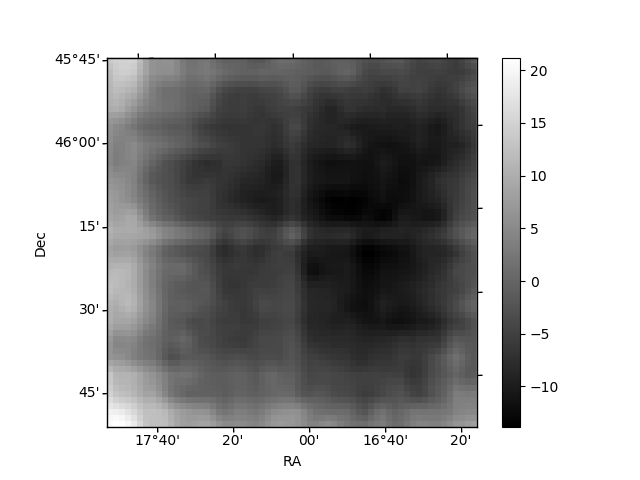
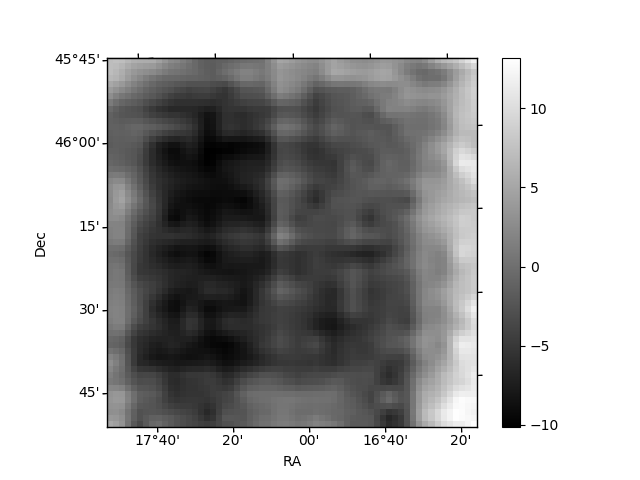
Histogram calculated using DETX and DETY for each event in the final _common_clean file
| Quadrant A | 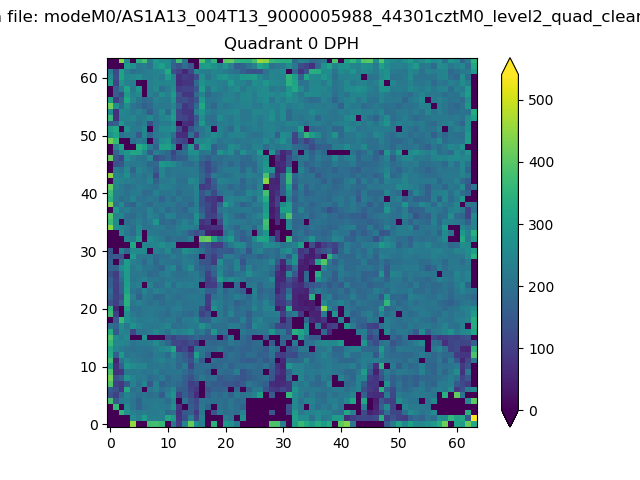 |
 |
Quadrant B |
|---|---|---|---|
| Quadrant D | 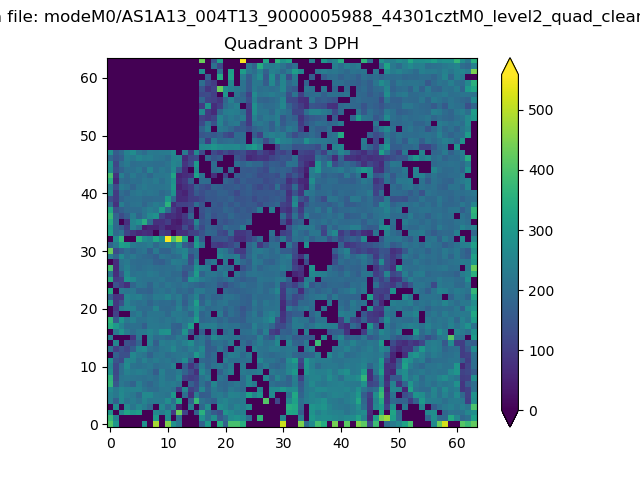 |
 |
Quadrant C |
| Plot type | Count rate plots | Images |
|---|---|---|
| Comparison with Poisson distribution Blue bars denote a histogram of data divided into 1 sec bins. Red curve is a Poisson curve with rate = median count rate of data. |
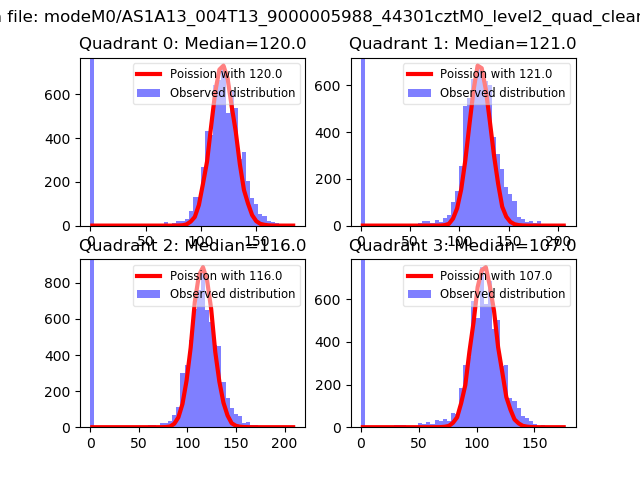 |
 |
| Quadrant-wise count rates Data is divided into 100 sec bins |
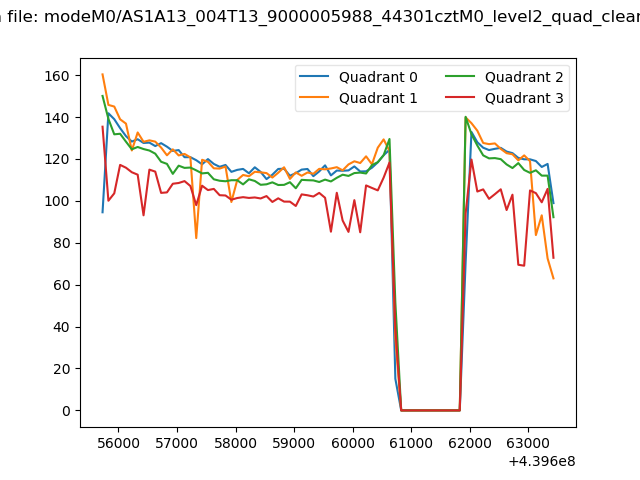 |
|
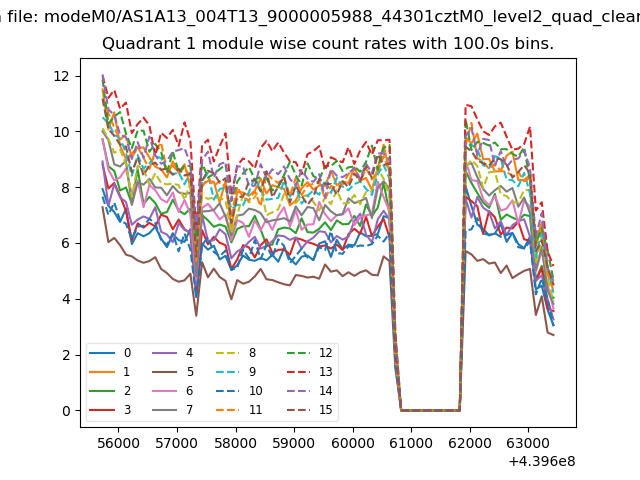
| Module-wise count rates for Quadrant A Data is divided into 100 sec bins |
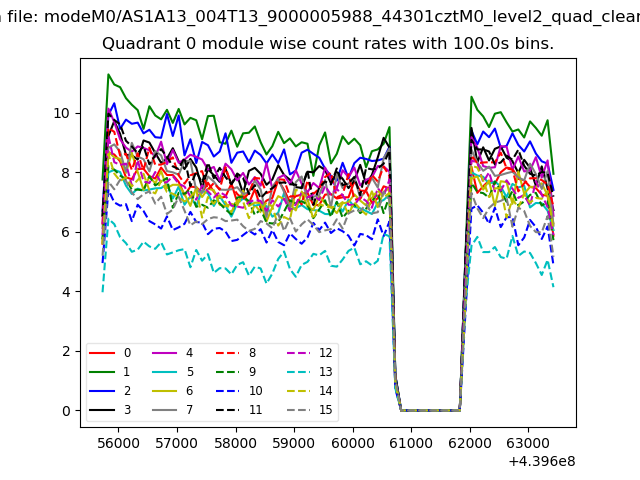 |
 |
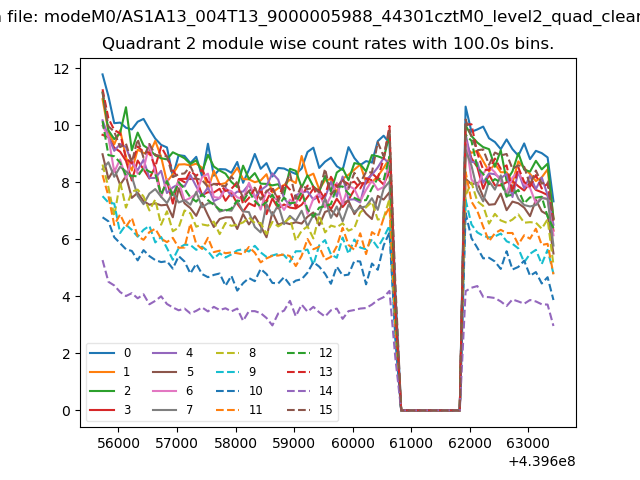
| Module-wise count rates for Quadrant B Data is divided into 100 sec bins |
 |
 |
| Module-wise count rates for Quadrant C Data is divided into 100 sec bins |
 |
 |
| Module-wise count rates for Quadrant D Data is divided into 100 sec bins |
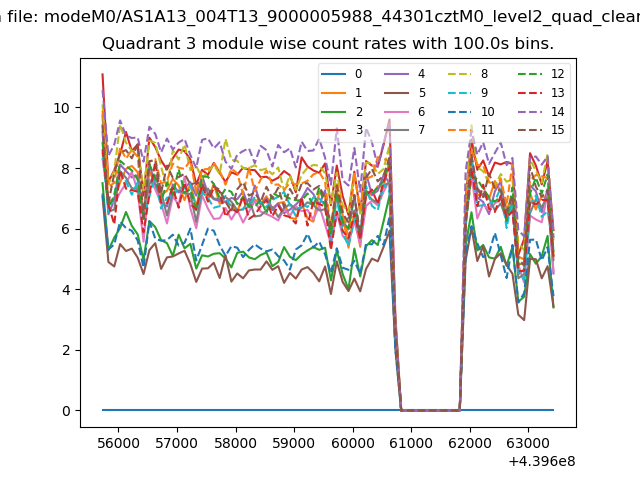 |
 |
| Parameter | Plot |
|---|---|
| CZT HV Monitor | 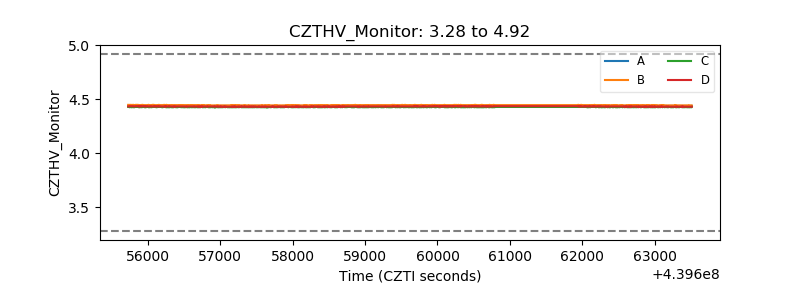 |
| D_VDD | 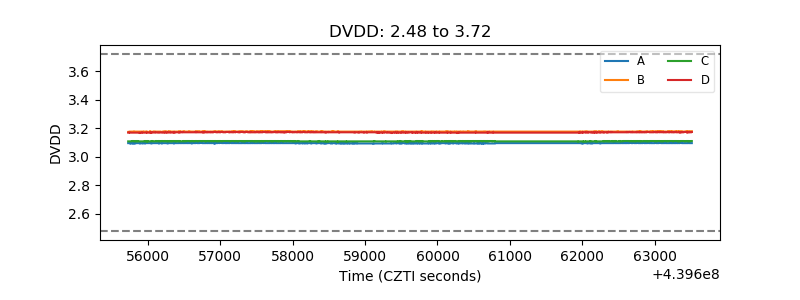 |
| Temperature 1 | 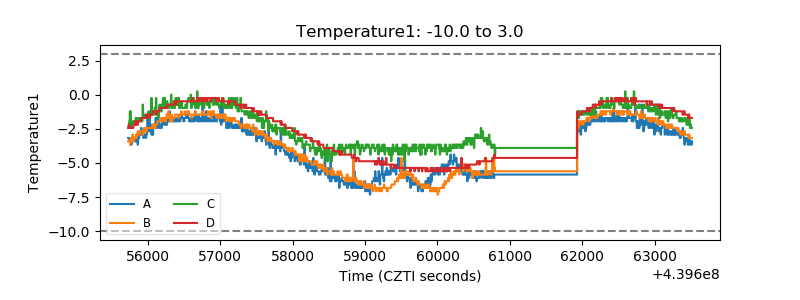 |
| Veto HV Monitor | 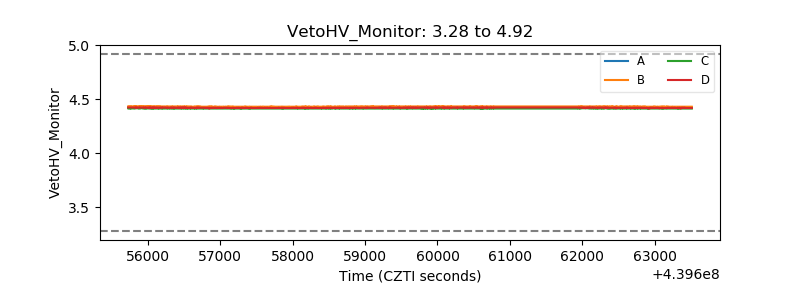 |
| Veto LLD | 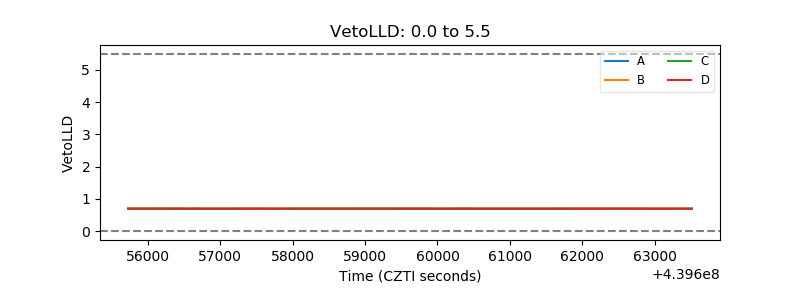 |
| Alpha Counter | 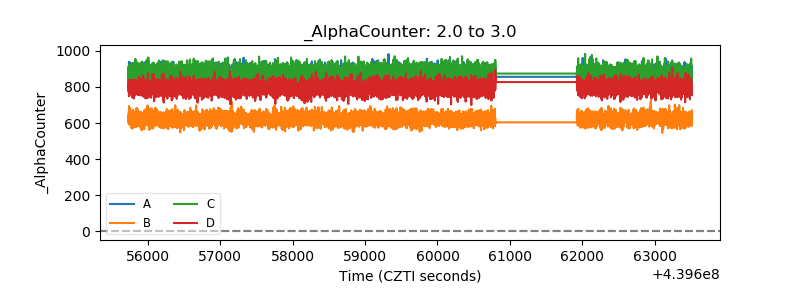 |
| _CPM_Rate | 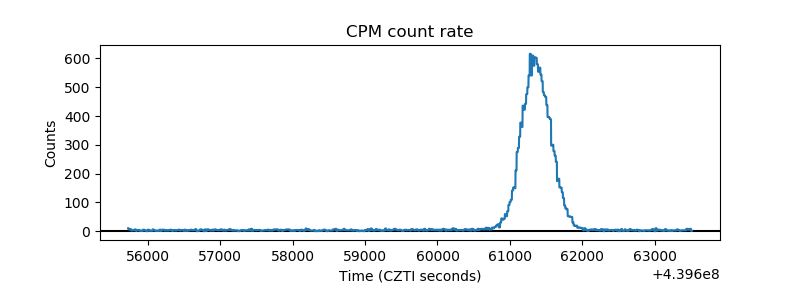 |
| CZT Counter | 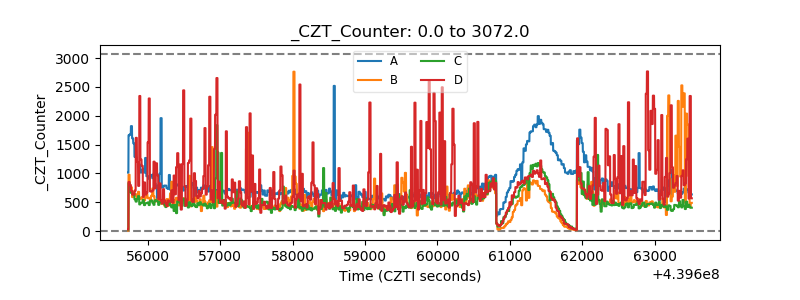 |
| +2.5 Volts monitor | 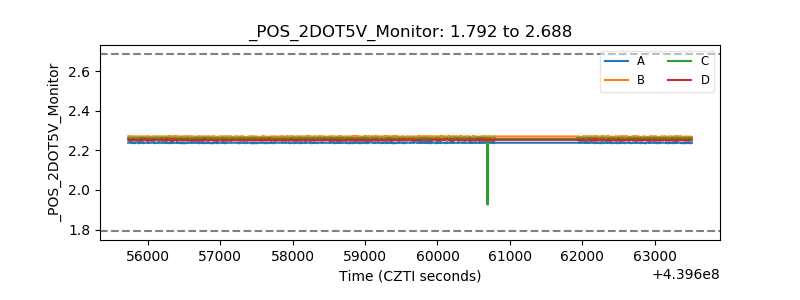 |
| +5 Volts monitor | 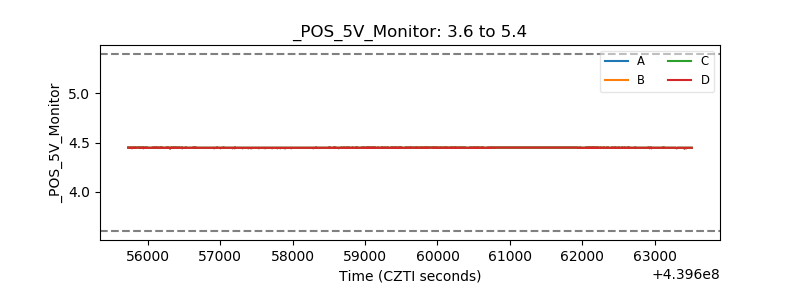 |
| _ROLL_ROT | 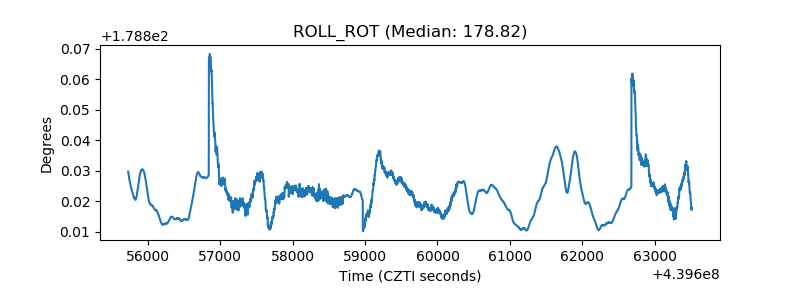 |
| _Roll_DEC | 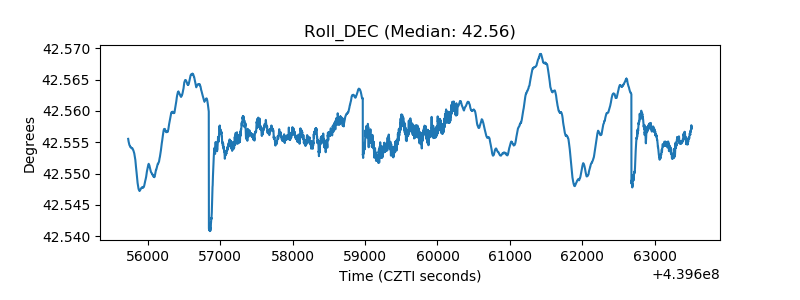 |
| _Roll_RA | 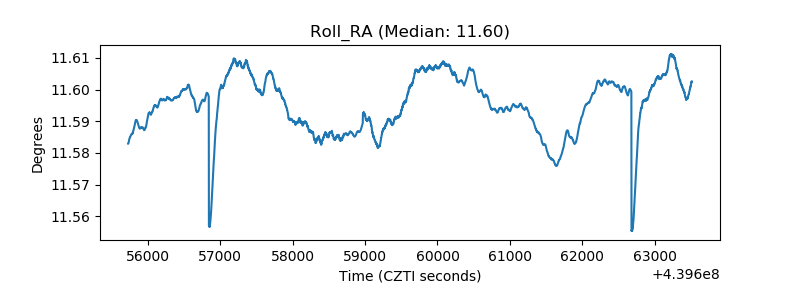 |
| Veto Counter | 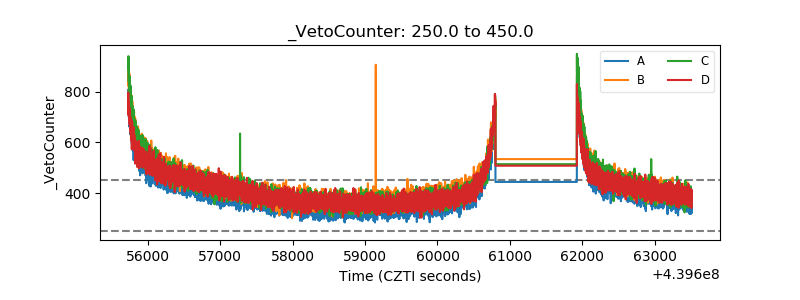 |