| Param | Original file | Final file |
|---|---|---|
| Filename | modeM0/AS1A13_004T13_9000005988_44302cztM0_level2.fits | modeM0/AS1A13_004T13_9000005988_44302cztM0_level2_quad_clean.evt |
| Size (bytes) | 507,974,400 | 110,759,040 |
| Size | 484.4 MB | 105.6 MB |
| Events in quadrant A | 4,948,162 | 757,798 |
| Events in quadrant B | 4,357,992 | 746,923 |
| Events in quadrant C | 3,143,256 | 749,598 |
| Events in quadrant D | 5,830,393 | 629,489 |
| Mode M0 | |||
|---|---|---|---|
| Quadrant | BADHDUFLAG | Total packets | Discarded packets |
| A | 0 | 20082 | 1 |
| B | 0 | 17488 | 1 |
| C | 0 | 14183 | 1 |
| D | 0 | 21942 | 1 |
| Mode SS | |||
|---|---|---|---|
| Quadrant | BADHDUFLAG | Total packets | Discarded packets |
| A | 0 | 136 | 0 |
| B | 0 | 136 | 0 |
| C | 0 | 136 | 0 |
| D | 0 | 136 | 0 |
| Mode M9 | |||
|---|---|---|---|
| Quadrant | BADHDUFLAG | Total packets | Discarded packets |
| A | 0 | 10 | 0 |
| B | 0 | 10 | 0 |
| C | 0 | 10 | 0 |
| D | 0 | 10 | 0 |
| Quadrant | Total seconds | Saturated seconds | Saturation percentage |
|---|---|---|---|
| A | 6743 | 193 | 2.862227% |
| B | 6743 | 441 | 6.540116% |
| C | 6743 | 84 | 1.245736% |
| D | 6743 | 799 | 11.849325% |
Noise dominated data is calculated using 1-second bins in cleaned event files. If a bin has >2000 counts, and if more than 50% of those come from <1% of pixels, then it is considered to be noise-dominated and hence unusable.
| Quadrant | # 1 sec bins | Bins with >0 counts | Bins with >2000 counts | High rate bins dominated by noise | Noise dominated (total time) | Noise dominated (detector-on time) | Marked lightcurve |
|---|---|---|---|---|---|---|---|
| A | 7758 | 6744 | 14 | 14 | 0.18% | 0.21% | 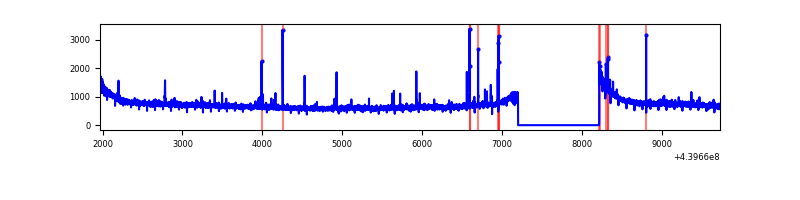 |
| B | 7758 | 6744 | 246 | 246 | 3.17% | 3.65% | 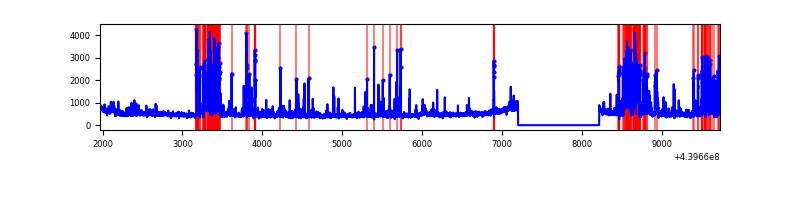 |
| C | 7758 | 6743 | 9 | 9 | 0.12% | 0.13% | 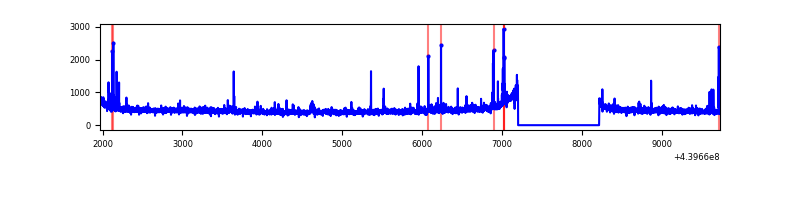 |
| D | 7758 | 6743 | 588 | 588 | 7.58% | 8.72% | 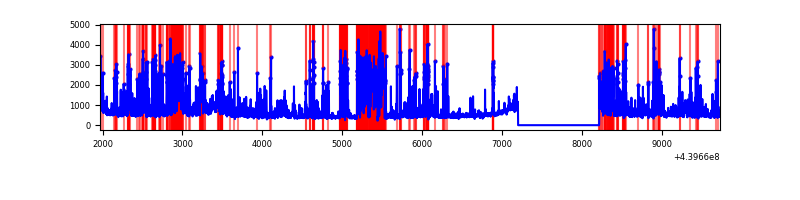 |
Top three noisy pixels from each quadrant. If the there are fewer than three noisy pixels in the level2.evt file, extra rows are filled as -1
| Pixel properties | Quadrant properties | ||||||
|---|---|---|---|---|---|---|---|
| Quadrant | DetID | PixID | Counts | Sigma | Mean | Median | Sigma |
| A | 10 | 83 | 1787698 | 10981.84 | 781 | 764 | 162.7 |
| A | 10 | 248 | 43364 | 261.8 | 781 | 764 | 162.7 |
| A | 0 | 243 | 37332 | 224.73 | 781 | 764 | 162.7 |
| B | 5 | 172 | 400983 | 2675.57 | 756 | 732 | 149.6 |
| B | 10 | 245 | 339354 | 2263.59 | 756 | 732 | 149.6 |
| B | 0 | 219 | 166776 | 1109.96 | 756 | 732 | 149.6 |
| C | 14 | 254 | 104548 | 572.3 | 769 | 770 | 181.3 |
| C | 1 | 3 | 18596 | 98.3 | 769 | 770 | 181.3 |
| C | 3 | 233 | 13863 | 72.2 | 769 | 770 | 181.3 |
| D | 13 | 249 | 1319715 | 7204.69 | 738 | 716 | 183.1 |
| D | 2 | 153 | 248987 | 1356.11 | 738 | 716 | 183.1 |
| D | 13 | 171 | 240514 | 1309.83 | 738 | 716 | 183.1 |
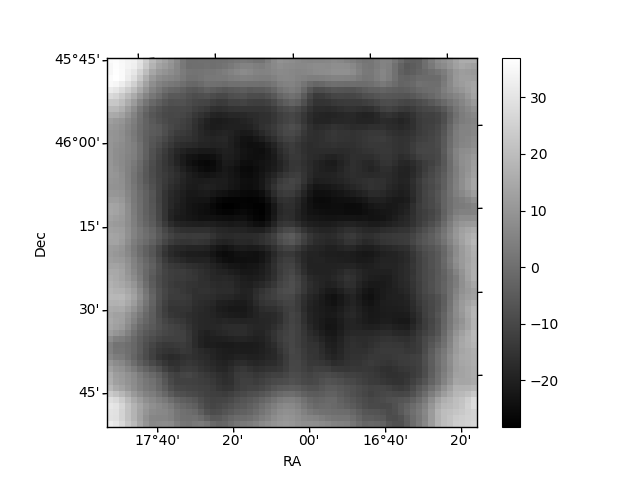
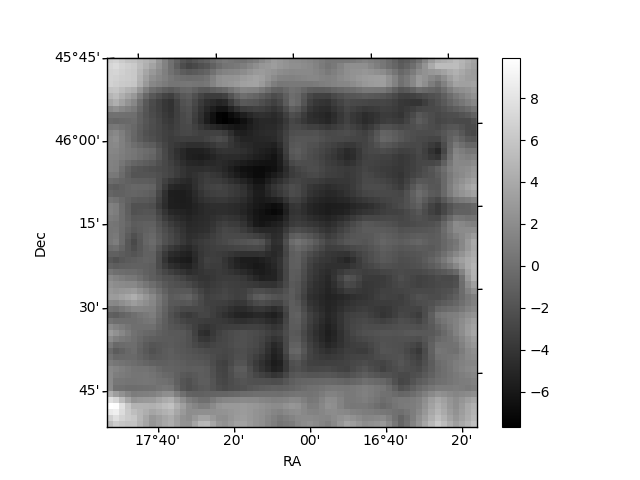
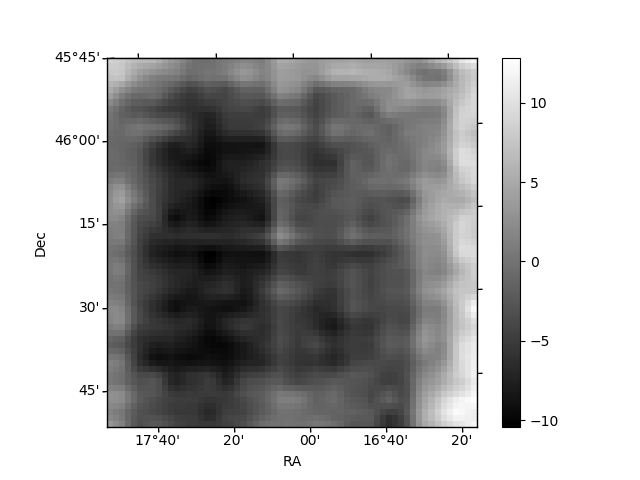
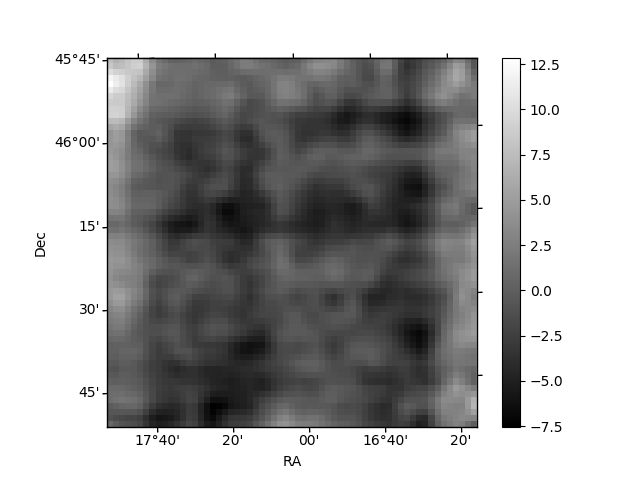
Histogram calculated using DETX and DETY for each event in the final _common_clean file
| Quadrant A | 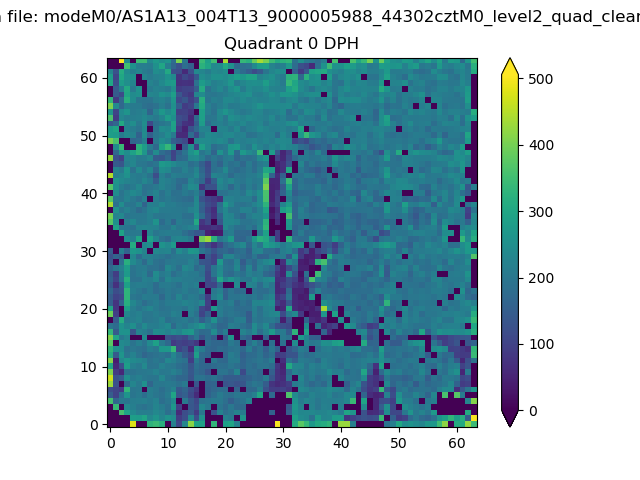 |
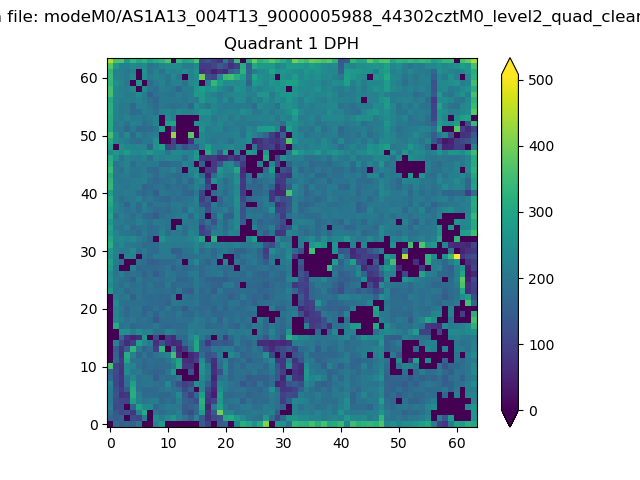 |
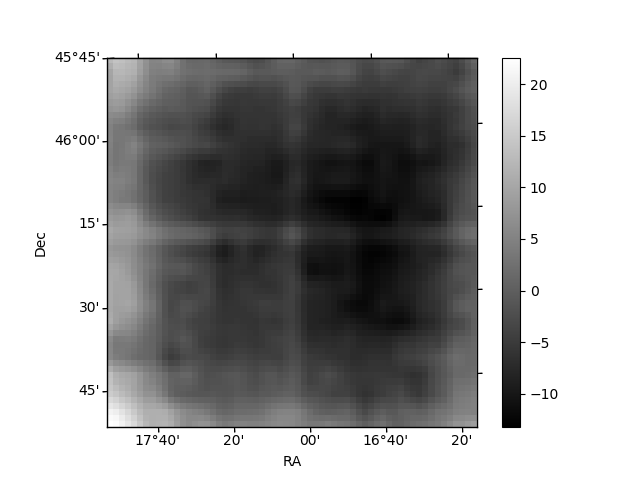
Quadrant B |
|---|---|---|---|
| Quadrant D | 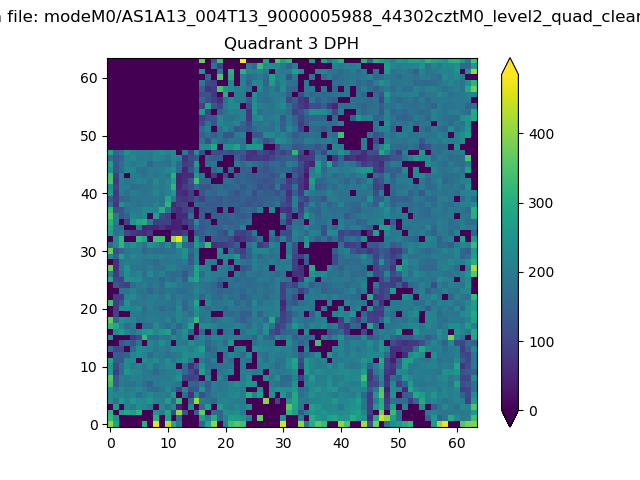 |
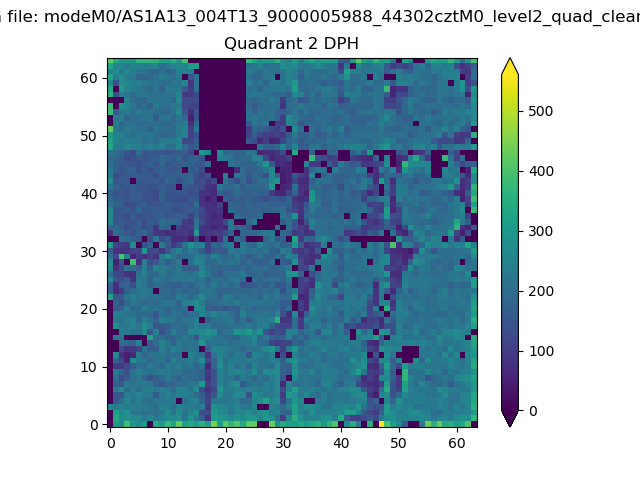 |
Quadrant C |
| Plot type | Count rate plots | Images |
|---|---|---|
| Comparison with Poisson distribution Blue bars denote a histogram of data divided into 1 sec bins. Red curve is a Poisson curve with rate = median count rate of data. |
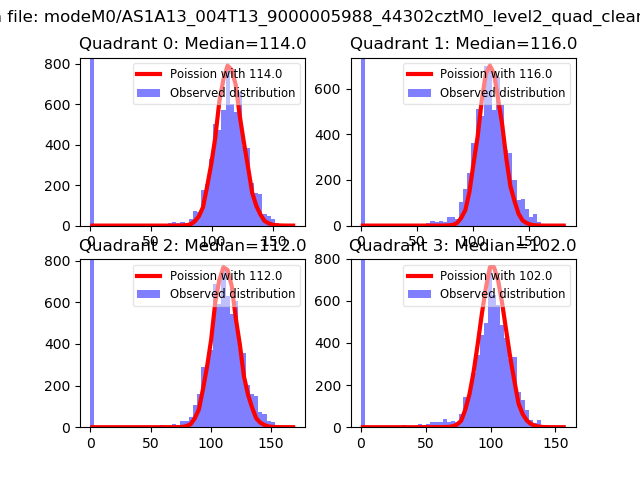 |
 |
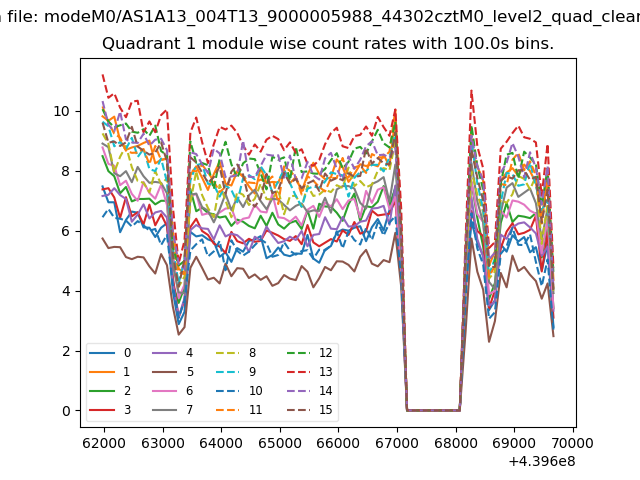
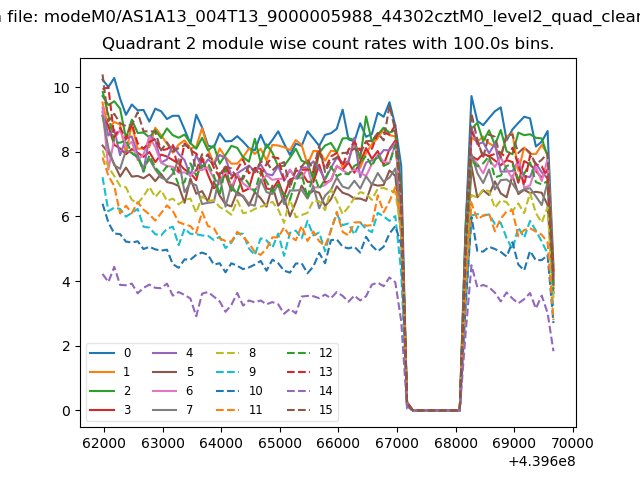
| Quadrant-wise count rates Data is divided into 100 sec bins |
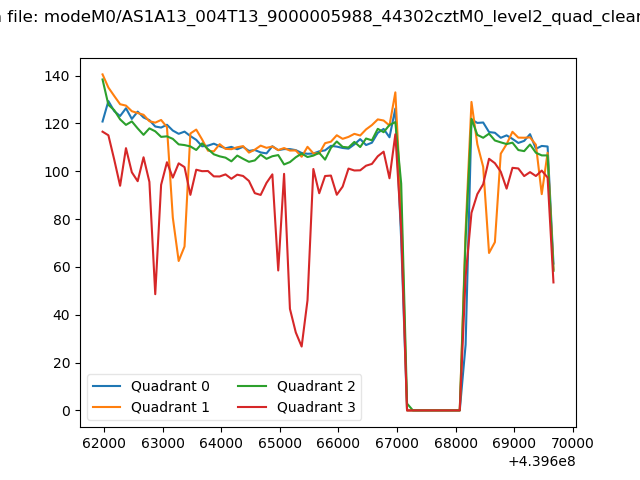 |
|
| Module-wise count rates for Quadrant A Data is divided into 100 sec bins |
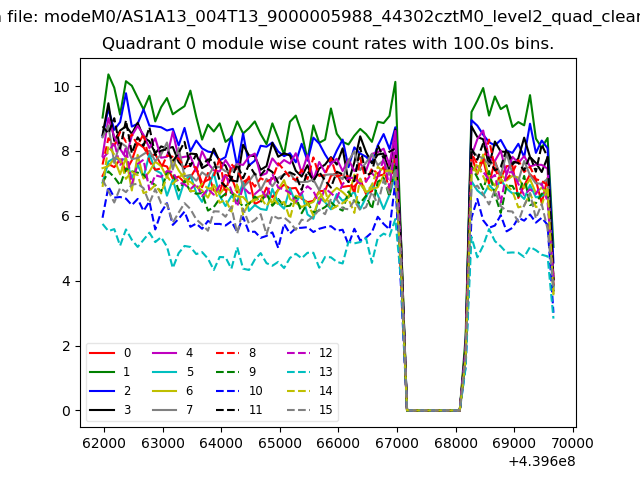 |
 |
| Module-wise count rates for Quadrant B Data is divided into 100 sec bins |
 |
 |
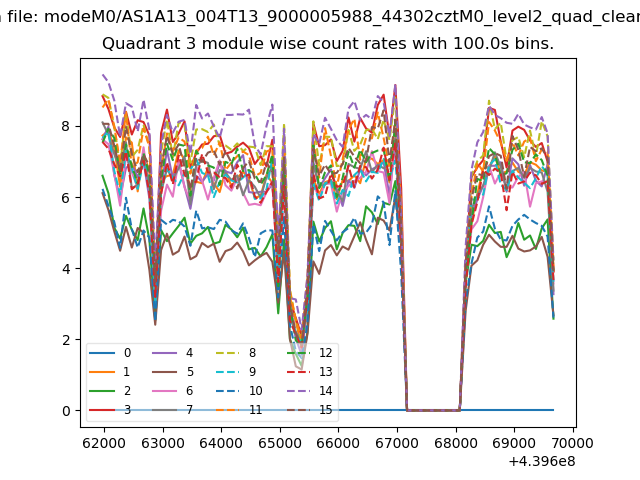
| Module-wise count rates for Quadrant C Data is divided into 100 sec bins |
 |
 |
| Module-wise count rates for Quadrant D Data is divided into 100 sec bins |
 |
 |
| Parameter | Plot |
|---|---|
| CZT HV Monitor | 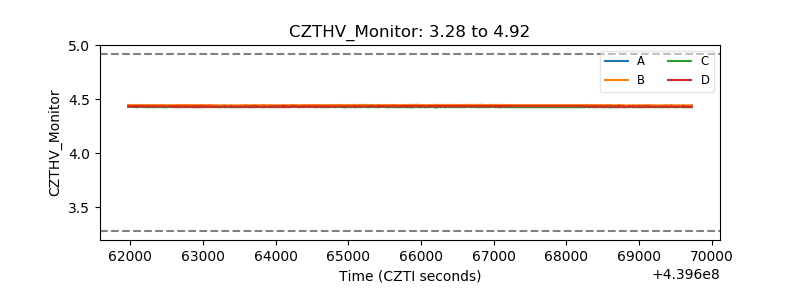 |
| D_VDD | 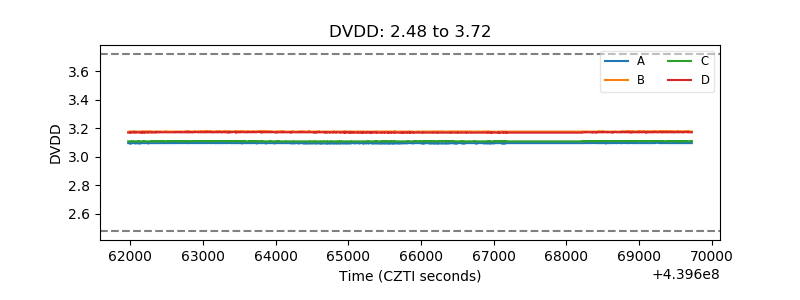 |
| Temperature 1 | 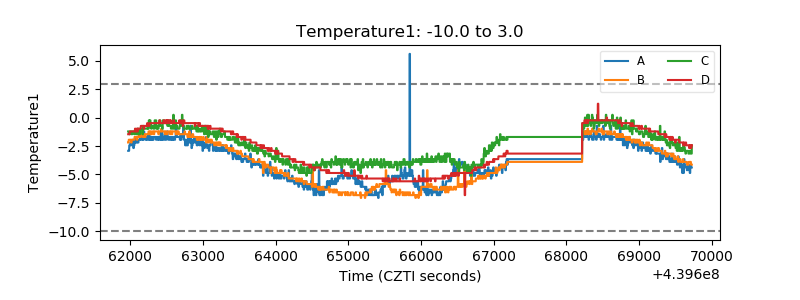 |
| Veto HV Monitor | 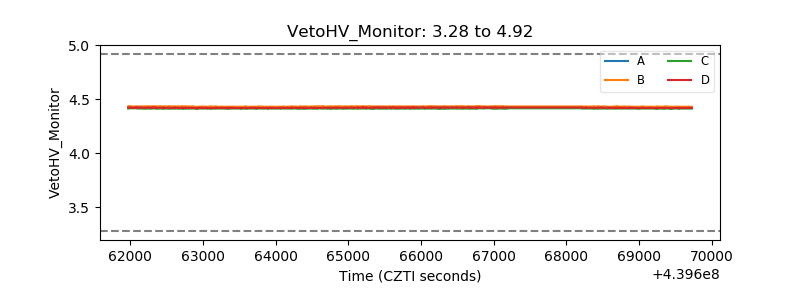 |
| Veto LLD | 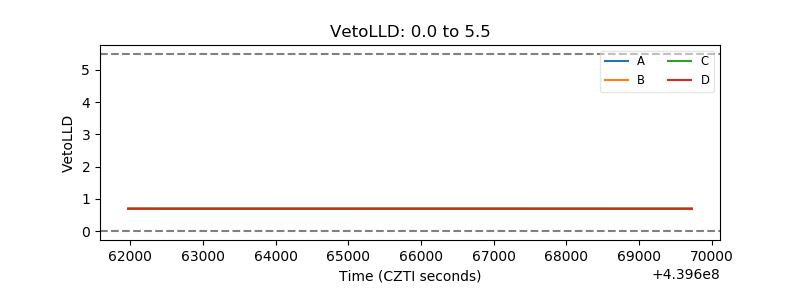 |
| Alpha Counter | 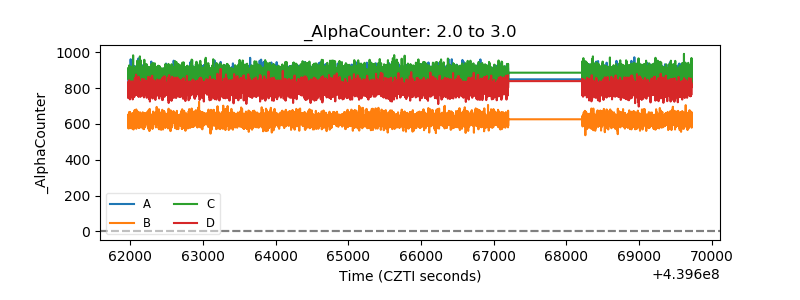 |
| _CPM_Rate | 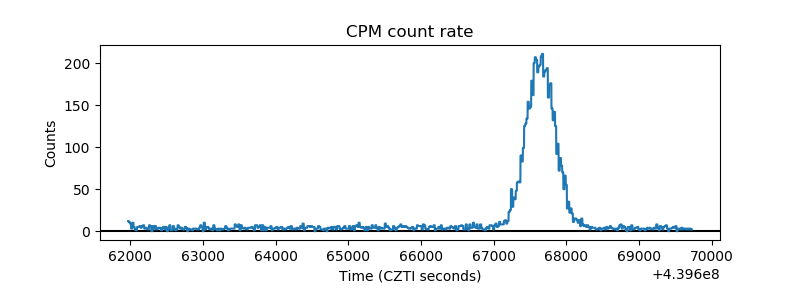 |
| CZT Counter | 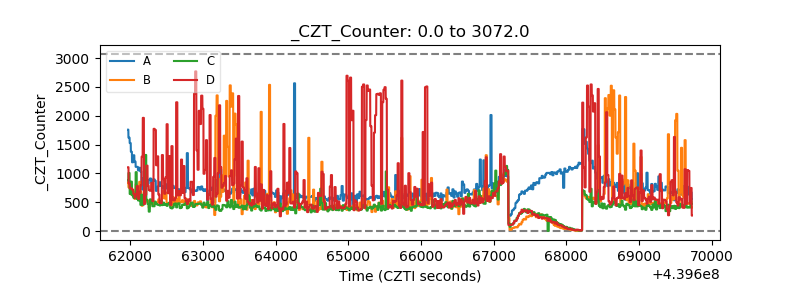 |
| +2.5 Volts monitor | 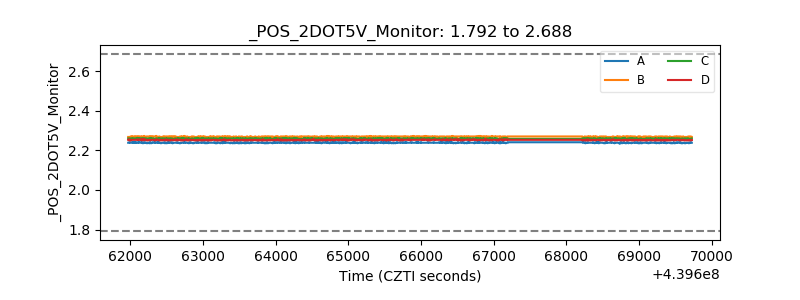 |
| +5 Volts monitor | 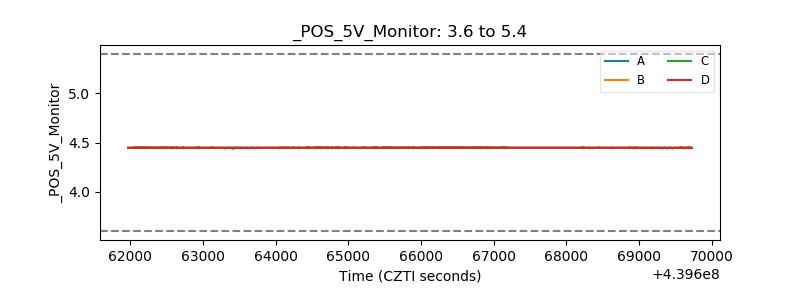 |
| _ROLL_ROT | 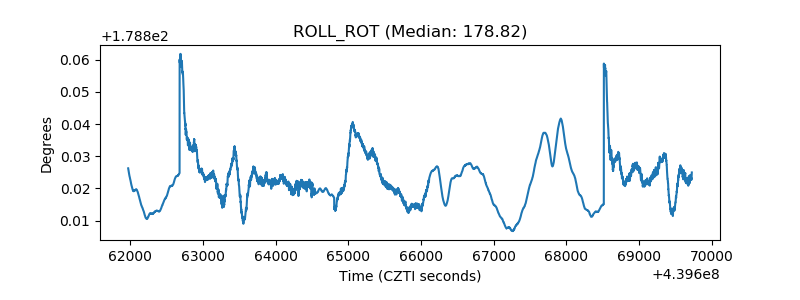 |
| _Roll_DEC | 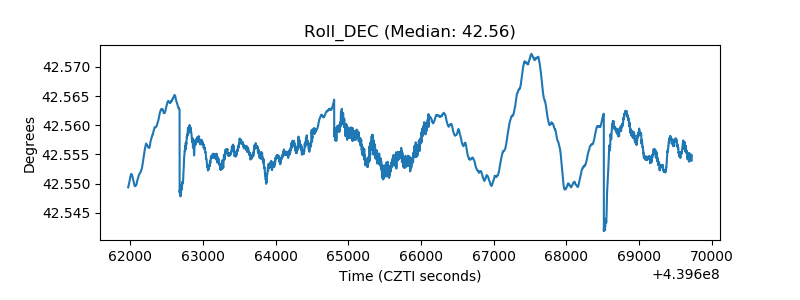 |
| _Roll_RA | 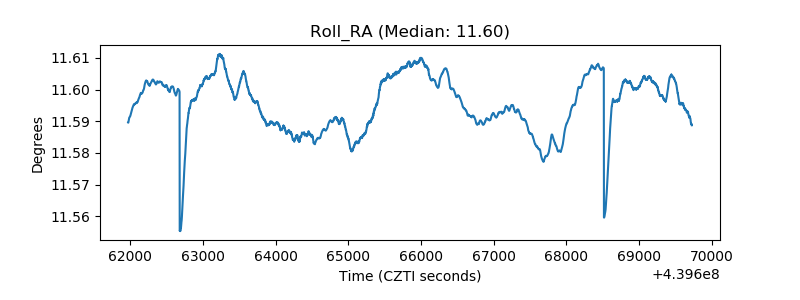 |
| Veto Counter | 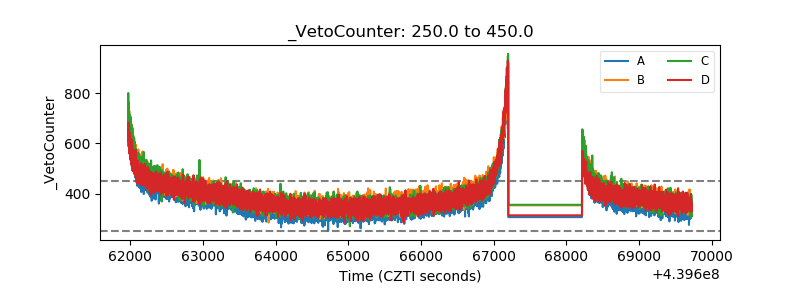 |