| Param | Original file | Final file |
|---|---|---|
| Filename | modeM0/AS1A13_004T13_9000005988_44303cztM0_level2.fits | modeM0/AS1A13_004T13_9000005988_44303cztM0_level2_quad_clean.evt |
| Size (bytes) | 502,081,920 | 112,135,680 |
| Size | 478.8 MB | 106.9 MB |
| Events in quadrant A | 5,053,612 | 757,293 |
| Events in quadrant B | 4,760,649 | 728,365 |
| Events in quadrant C | 3,209,810 | 754,538 |
| Events in quadrant D | 5,021,534 | 670,979 |
| Mode M0 | |||
|---|---|---|---|
| Quadrant | BADHDUFLAG | Total packets | Discarded packets |
| A | 0 | 20517 | 2 |
| B | 0 | 18909 | 2 |
| C | 0 | 14619 | 2 |
| D | 0 | 19765 | 2 |
| Mode SS | |||
|---|---|---|---|
| Quadrant | BADHDUFLAG | Total packets | Discarded packets |
| A | 0 | 142 | 0 |
| B | 0 | 142 | 0 |
| C | 0 | 142 | 0 |
| D | 0 | 142 | 0 |
| Mode M9 | |||
|---|---|---|---|
| Quadrant | BADHDUFLAG | Total packets | Discarded packets |
| A | 0 | 7 | 0 |
| B | 0 | 7 | 0 |
| C | 0 | 7 | 0 |
| D | 0 | 7 | 0 |
| Quadrant | Total seconds | Saturated seconds | Saturation percentage |
|---|---|---|---|
| A | 6953 | 179 | 2.574428% |
| B | 6954 | 570 | 8.196721% |
| C | 6953 | 49 | 0.704732% |
| D | 6953 | 409 | 5.882353% |
Noise dominated data is calculated using 1-second bins in cleaned event files. If a bin has >2000 counts, and if more than 50% of those come from <1% of pixels, then it is considered to be noise-dominated and hence unusable.
| Quadrant | # 1 sec bins | Bins with >0 counts | Bins with >2000 counts | High rate bins dominated by noise | Noise dominated (total time) | Noise dominated (detector-on time) | Marked lightcurve |
|---|---|---|---|---|---|---|---|
| A | 7613 | 6955 | 16 | 16 | 0.21% | 0.23% | 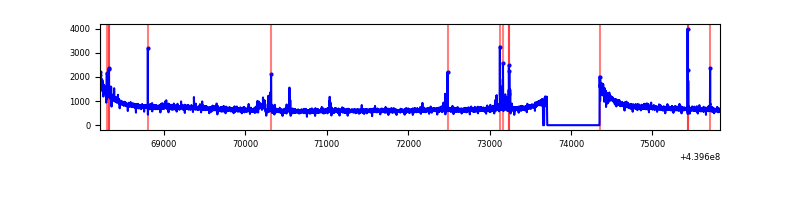 |
| B | 7614 | 6956 | 350 | 350 | 4.60% | 5.03% | 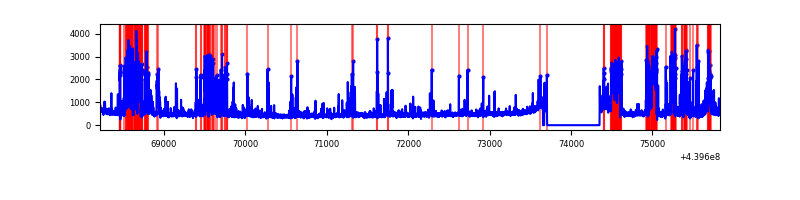 |
| C | 7613 | 6955 | 12 | 12 | 0.16% | 0.17% | 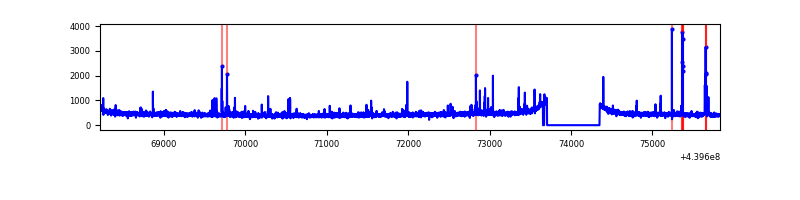 |
| D | 7613 | 6955 | 298 | 298 | 3.91% | 4.28% | 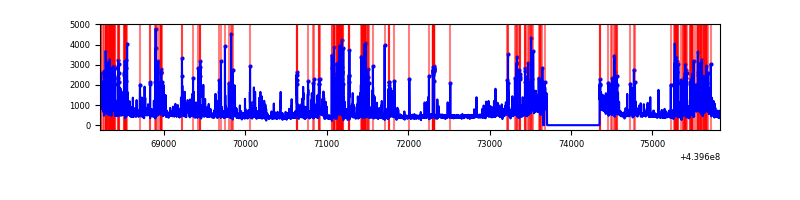 |
Top three noisy pixels from each quadrant. If the there are fewer than three noisy pixels in the level2.evt file, extra rows are filled as -1
| Pixel properties | Quadrant properties | ||||||
|---|---|---|---|---|---|---|---|
| Quadrant | DetID | PixID | Counts | Sigma | Mean | Median | Sigma |
| A | 10 | 83 | 1815615 | 11094.94 | 787 | 769 | 163.6 |
| A | 7 | 3 | 81769 | 495.18 | 787 | 769 | 163.6 |
| A | 15 | 223 | 45044 | 270.67 | 787 | 769 | 163.6 |
| B | 5 | 172 | 999794 | 6692.98 | 761 | 738 | 149.3 |
| B | 0 | 219 | 233267 | 1557.78 | 761 | 738 | 149.3 |
| B | 4 | 158 | 166781 | 1112.37 | 761 | 738 | 149.3 |
| C | 14 | 254 | 118539 | 641.88 | 778 | 782 | 183.5 |
| C | 1 | 3 | 25470 | 134.57 | 778 | 782 | 183.5 |
| C | 3 | 233 | 9086 | 45.26 | 778 | 782 | 183.5 |
| D | 13 | 249 | 635238 | 3280.18 | 766 | 744 | 193.4 |
| D | 5 | 222 | 458812 | 2368.1 | 766 | 744 | 193.4 |
| D | 5 | 171 | 205935 | 1060.79 | 766 | 744 | 193.4 |
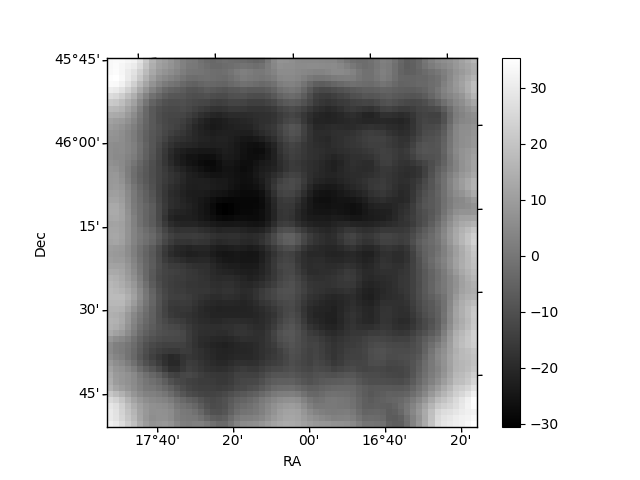
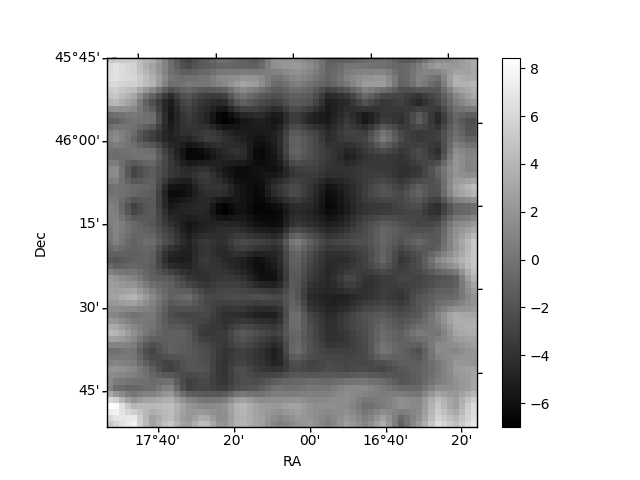
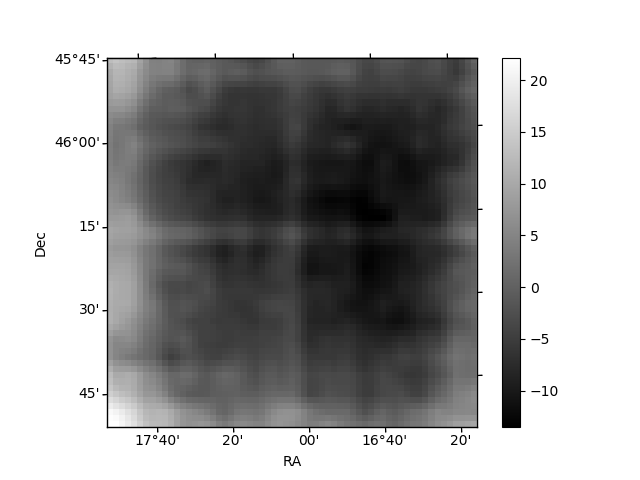
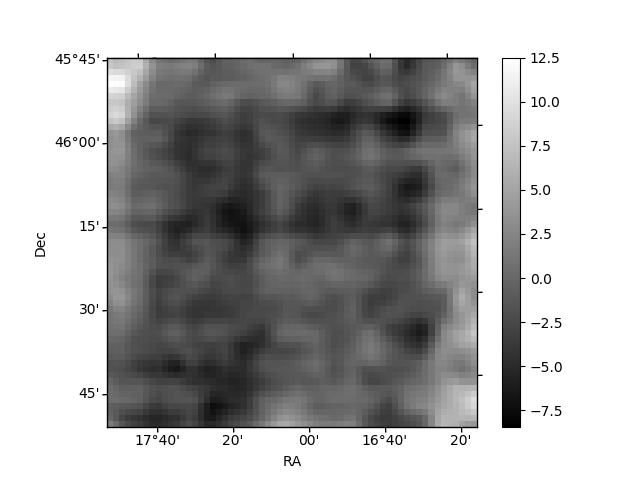
Histogram calculated using DETX and DETY for each event in the final _common_clean file
| Quadrant A | 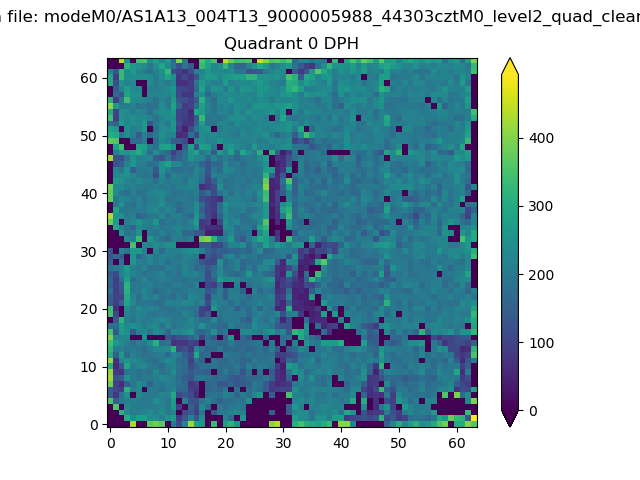 |
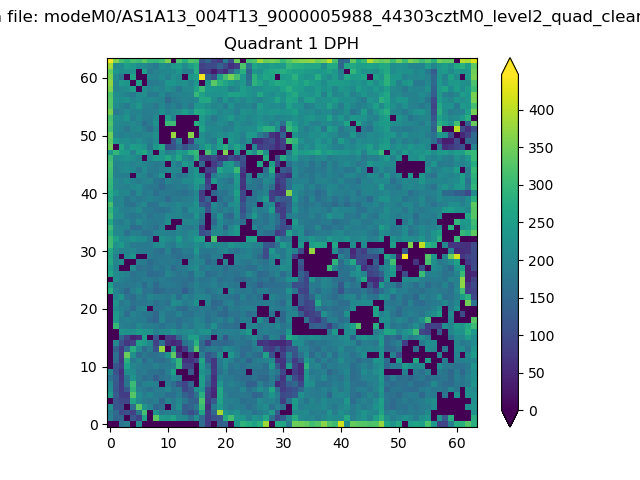 |
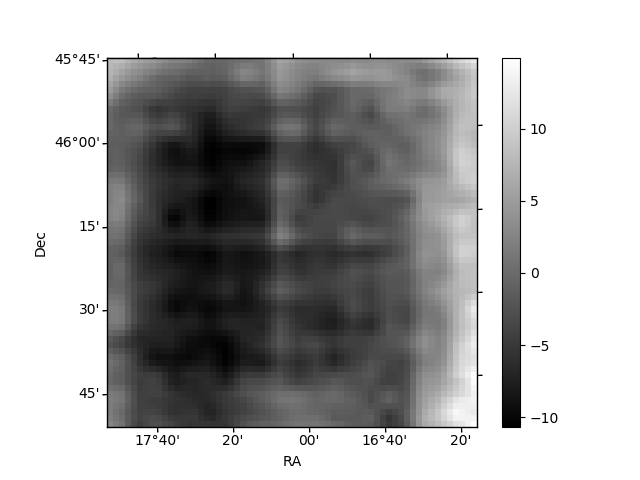
Quadrant B |
|---|---|---|---|
| Quadrant D | 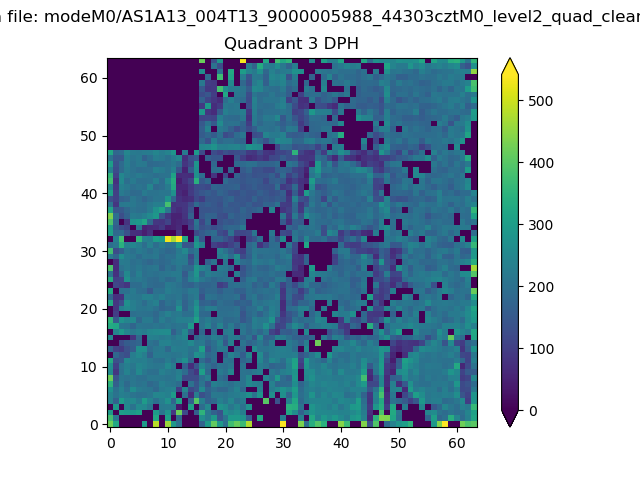 |
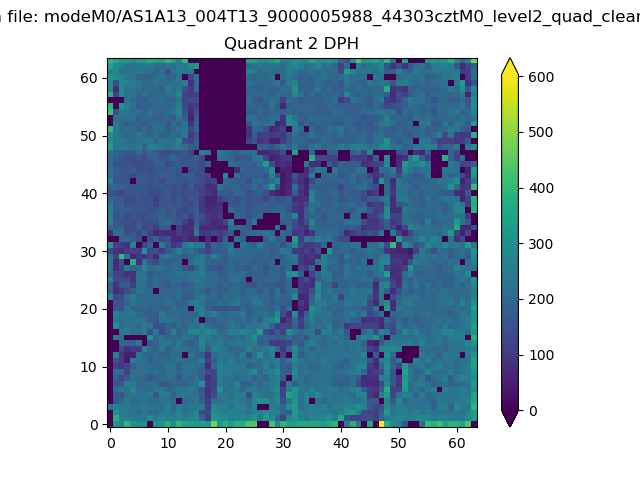 |
Quadrant C |
| Plot type | Count rate plots | Images |
|---|---|---|
| Comparison with Poisson distribution Blue bars denote a histogram of data divided into 1 sec bins. Red curve is a Poisson curve with rate = median count rate of data. |
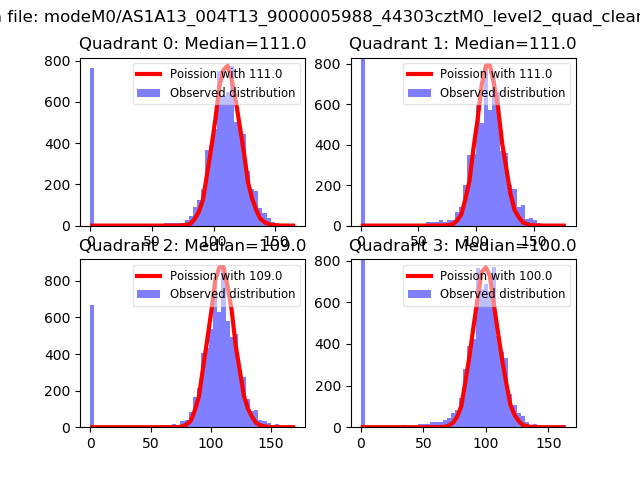 |
 |
| Quadrant-wise count rates Data is divided into 100 sec bins |
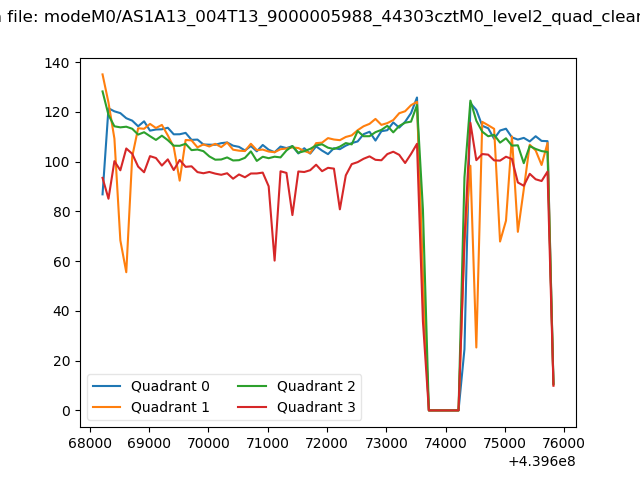 |
|
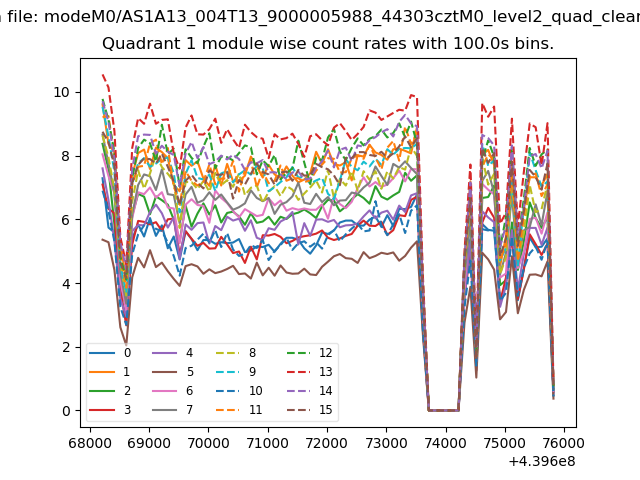
| Module-wise count rates for Quadrant A Data is divided into 100 sec bins |
 |
 |
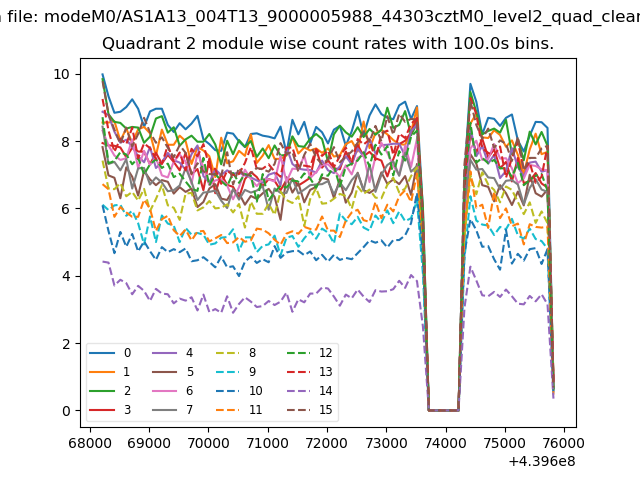
| Module-wise count rates for Quadrant B Data is divided into 100 sec bins |
 |
 |
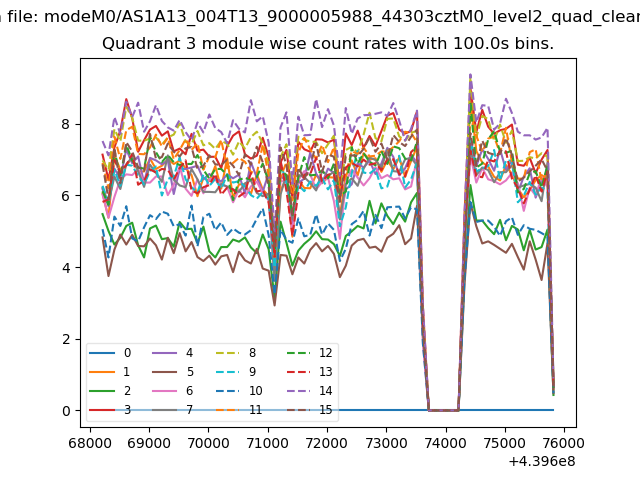
| Module-wise count rates for Quadrant C Data is divided into 100 sec bins |
 |
 |
| Module-wise count rates for Quadrant D Data is divided into 100 sec bins |
 |
 |
| Parameter | Plot |
|---|---|
| CZT HV Monitor | 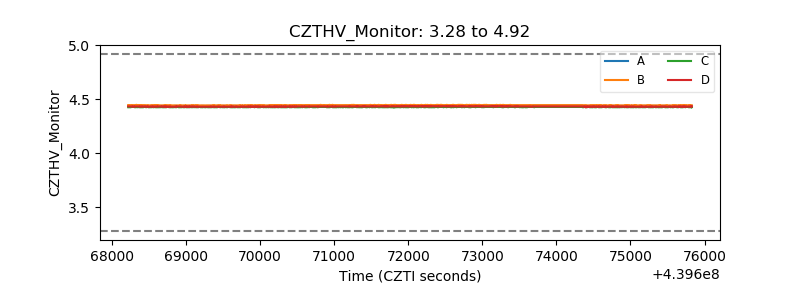 |
| D_VDD | 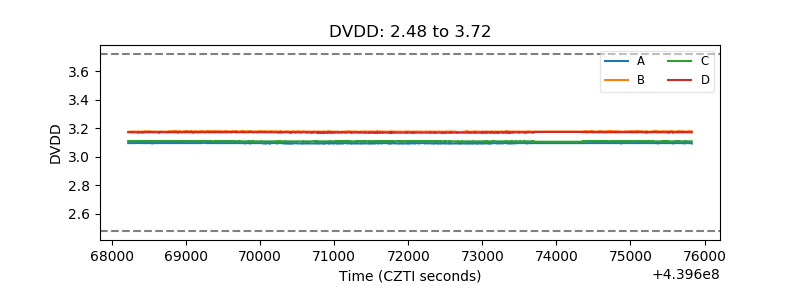 |
| Temperature 1 | 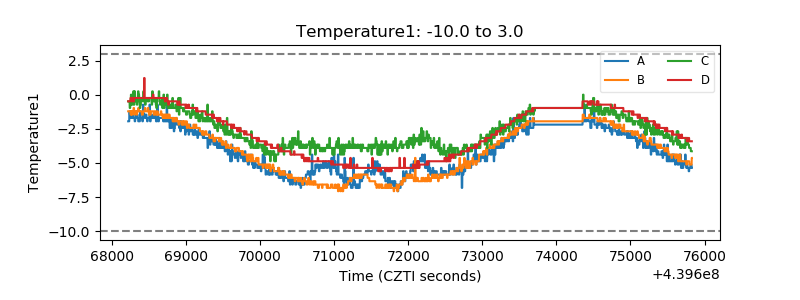 |
| Veto HV Monitor | 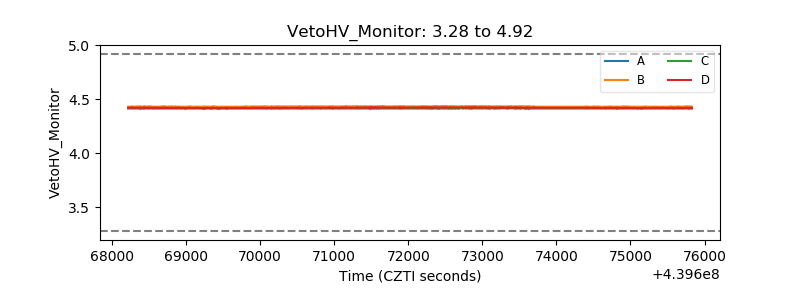 |
| Veto LLD | 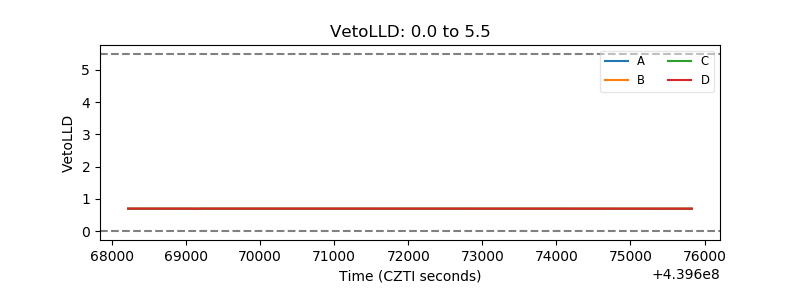 |
| Alpha Counter | 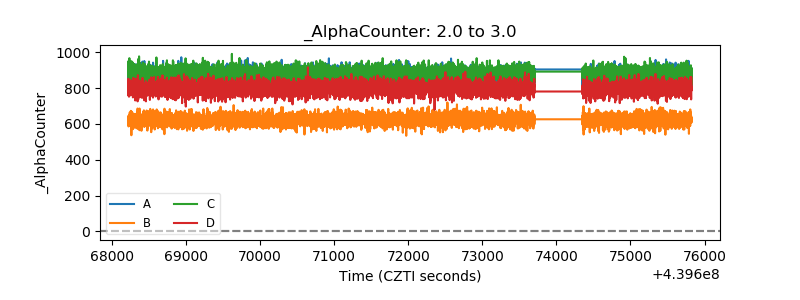 |
| _CPM_Rate | 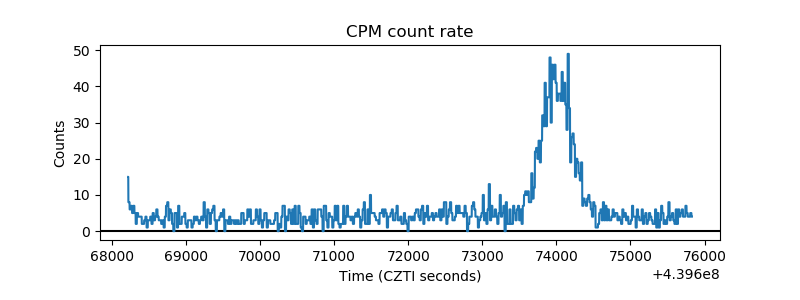 |
| CZT Counter | 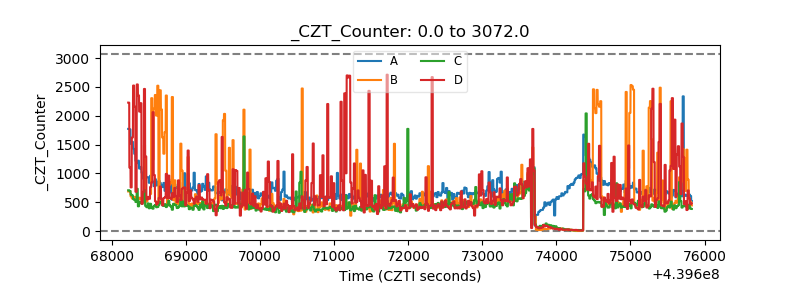 |
| +2.5 Volts monitor | 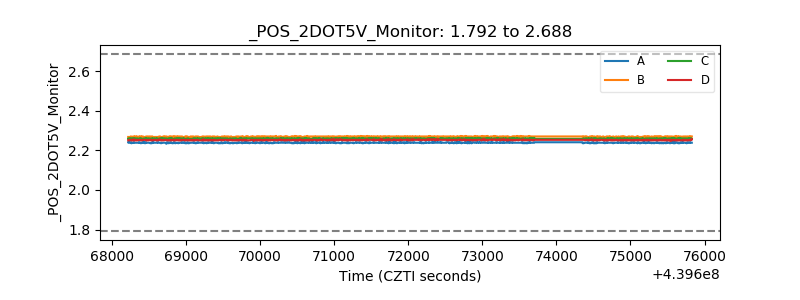 |
| +5 Volts monitor | 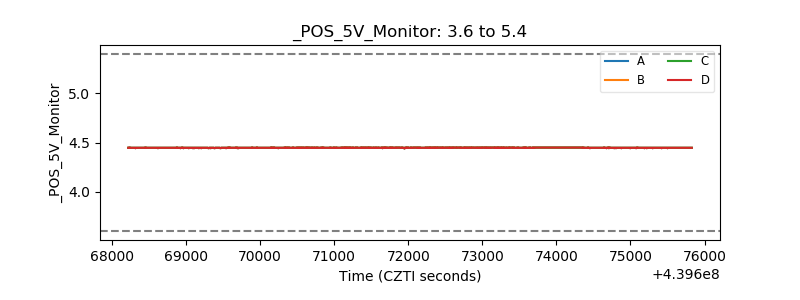 |
| _ROLL_ROT | 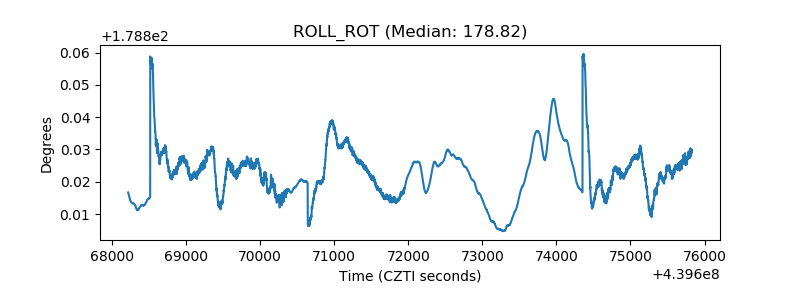 |
| _Roll_DEC | 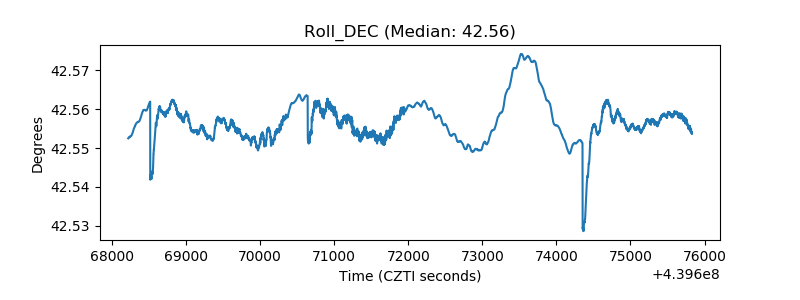 |
| _Roll_RA | 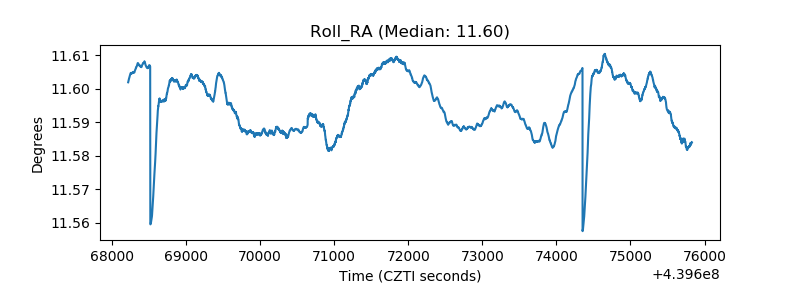 |
| Veto Counter | 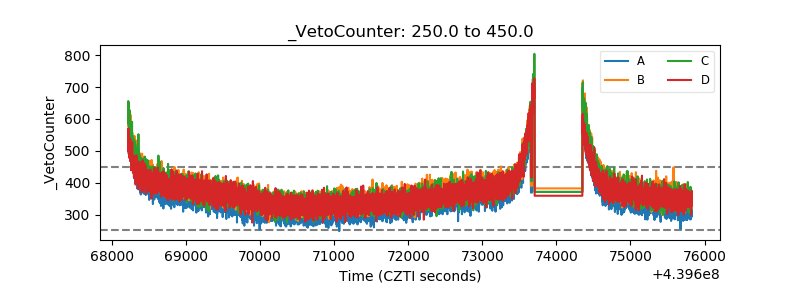 |