| Param | Original file | Final file |
|---|---|---|
| Filename | modeM0/AS1A13_004T13_9000005988_44304cztM0_level2.fits | modeM0/AS1A13_004T13_9000005988_44304cztM0_level2_quad_clean.evt |
| Size (bytes) | 613,437,120 | 119,257,920 |
| Size | 585.0 MB | 113.7 MB |
| Events in quadrant A | 5,195,005 | 833,302 |
| Events in quadrant B | 5,631,994 | 755,259 |
| Events in quadrant C | 3,624,304 | 819,932 |
| Events in quadrant D | 7,662,391 | 669,398 |
| Mode M0 | |||
|---|---|---|---|
| Quadrant | BADHDUFLAG | Total packets | Discarded packets |
| A | 0 | 21511 | 2 |
| B | 0 | 22001 | 2 |
| C | 0 | 16381 | 2 |
| D | 0 | 28091 | 2 |
| Mode SS | |||
|---|---|---|---|
| Quadrant | BADHDUFLAG | Total packets | Discarded packets |
| A | 0 | 156 | 0 |
| B | 0 | 156 | 0 |
| C | 0 | 156 | 0 |
| D | 0 | 156 | 0 |
| Mode M9 | |||
|---|---|---|---|
| Quadrant | BADHDUFLAG | Total packets | Discarded packets |
| A | 0 | 1 | 0 |
| B | 0 | 1 | 0 |
| C | 0 | 1 | 0 |
| D | 0 | 1 | 0 |
| Quadrant | Total seconds | Saturated seconds | Saturation percentage |
|---|---|---|---|
| A | 7655 | 92 | 1.201829% |
| B | 7655 | 899 | 11.743958% |
| C | 7656 | 31 | 0.404911% |
| D | 7656 | 1110 | 14.498433% |
Noise dominated data is calculated using 1-second bins in cleaned event files. If a bin has >2000 counts, and if more than 50% of those come from <1% of pixels, then it is considered to be noise-dominated and hence unusable.
| Quadrant | # 1 sec bins | Bins with >0 counts | Bins with >2000 counts | High rate bins dominated by noise | Noise dominated (total time) | Noise dominated (detector-on time) | Marked lightcurve |
|---|---|---|---|---|---|---|---|
| A | 7765 | 7657 | 7 | 7 | 0.09% | 0.09% | 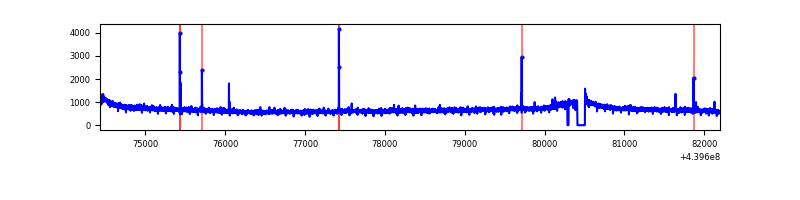 |
| B | 7765 | 7657 | 616 | 616 | 7.93% | 8.04% | 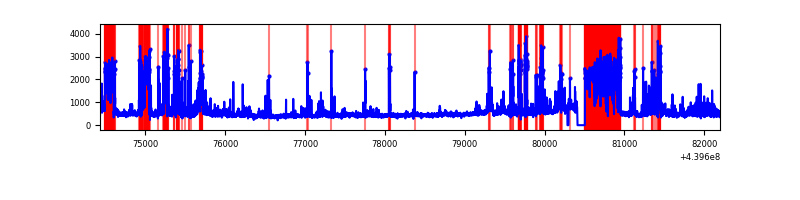 |
| C | 7766 | 7658 | 12 | 12 | 0.15% | 0.16% | 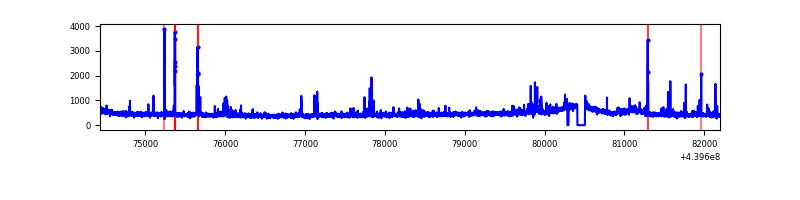 |
| D | 7766 | 7658 | 944 | 944 | 12.16% | 12.33% | 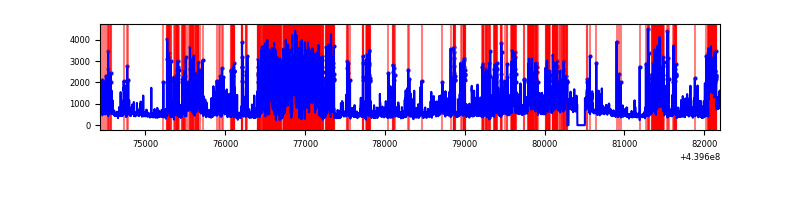 |
Top three noisy pixels from each quadrant. If the there are fewer than three noisy pixels in the level2.evt file, extra rows are filled as -1
| Pixel properties | Quadrant properties | ||||||
|---|---|---|---|---|---|---|---|
| Quadrant | DetID | PixID | Counts | Sigma | Mean | Median | Sigma |
| A | 10 | 83 | 1773468 | 9779.39 | 868 | 847 | 181.3 |
| A | 4 | 0 | 21376 | 113.26 | 868 | 847 | 181.3 |
| A | 7 | 3 | 19845 | 104.81 | 868 | 847 | 181.3 |
| B | 5 | 172 | 1529674 | 9617.75 | 808 | 784 | 159.0 |
| B | 0 | 219 | 310509 | 1948.38 | 808 | 784 | 159.0 |
| B | 3 | 112 | 129047 | 806.86 | 808 | 784 | 159.0 |
| C | 14 | 254 | 113856 | 562.3 | 855 | 861 | 201.0 |
| C | 15 | 208 | 54416 | 266.51 | 855 | 861 | 201.0 |
| C | 9 | 54 | 51613 | 252.56 | 855 | 861 | 201.0 |
| D | 13 | 249 | 1829067 | 8870.45 | 812 | 785 | 206.1 |
| D | 5 | 222 | 1275519 | 6184.75 | 812 | 785 | 206.1 |
| D | 1 | 52 | 594347 | 2879.84 | 812 | 785 | 206.1 |
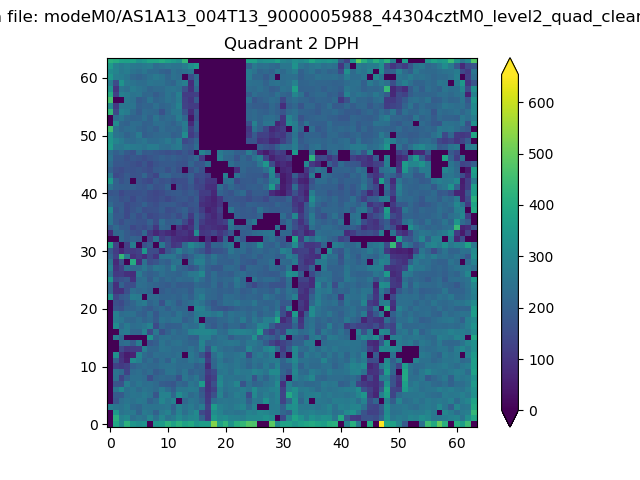
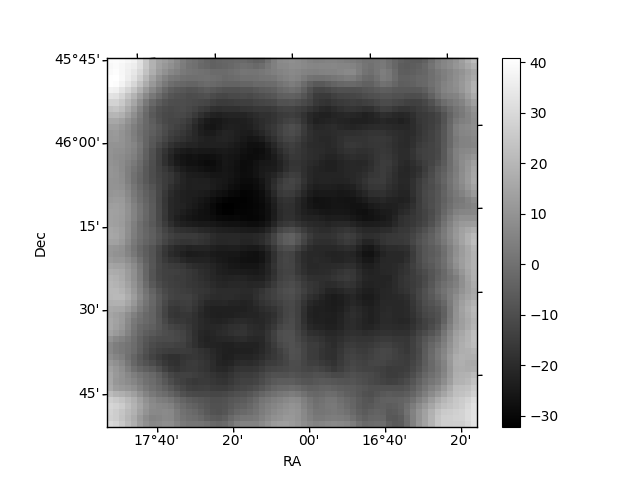
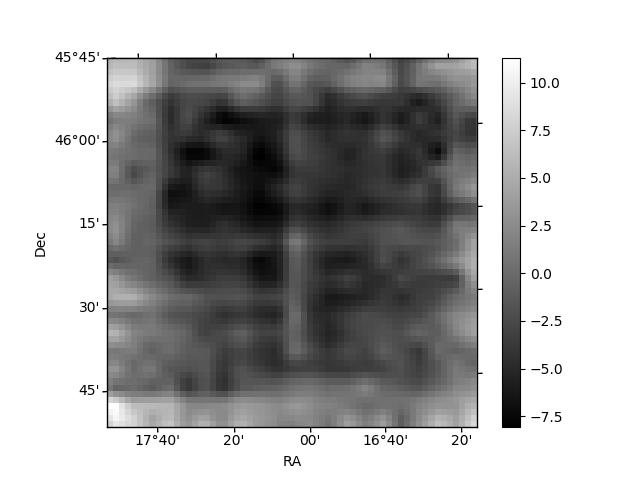
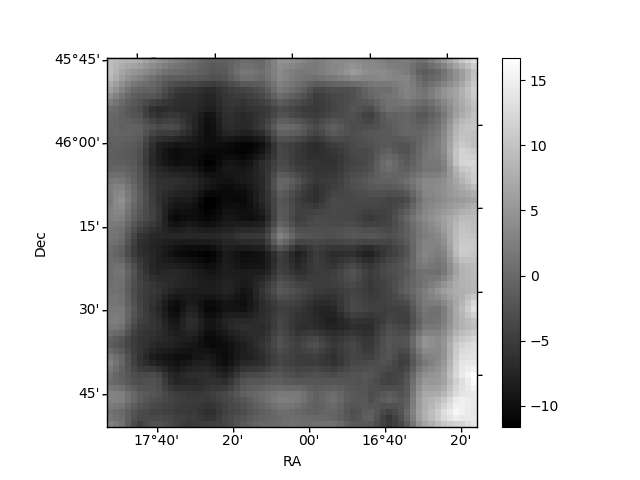
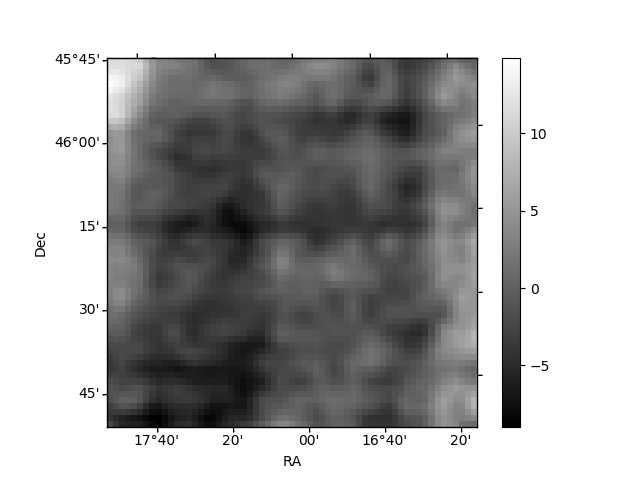
Histogram calculated using DETX and DETY for each event in the final _common_clean file
| Quadrant A | 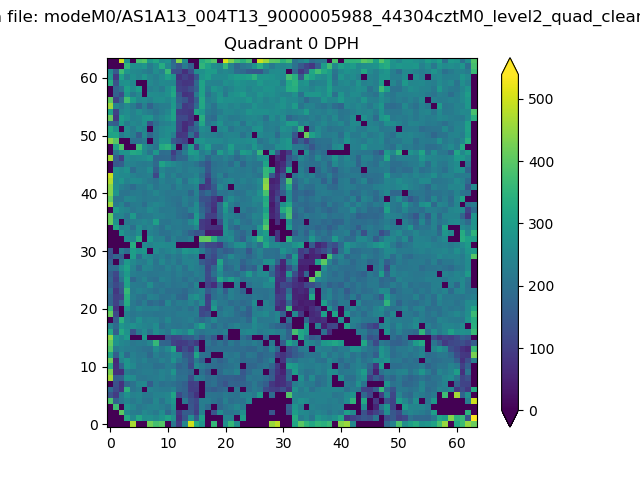 |
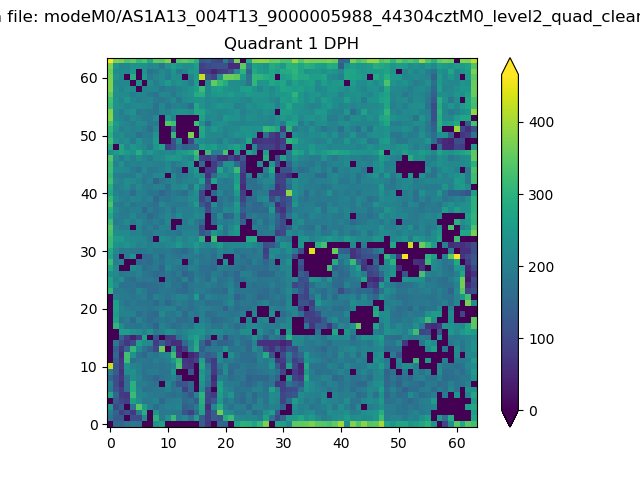 |
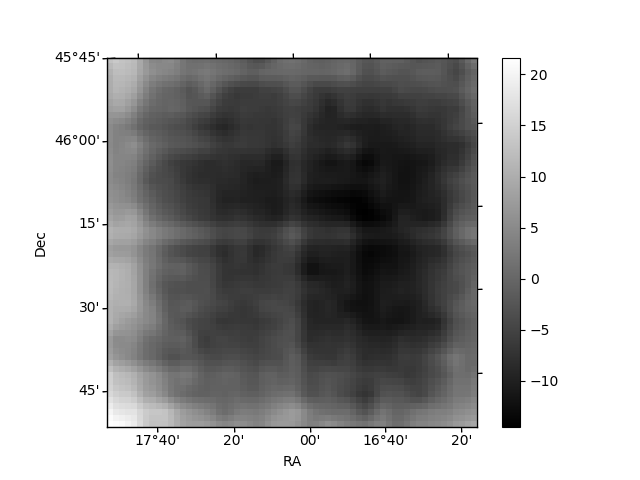
Quadrant B |
|---|---|---|---|
| Quadrant D | 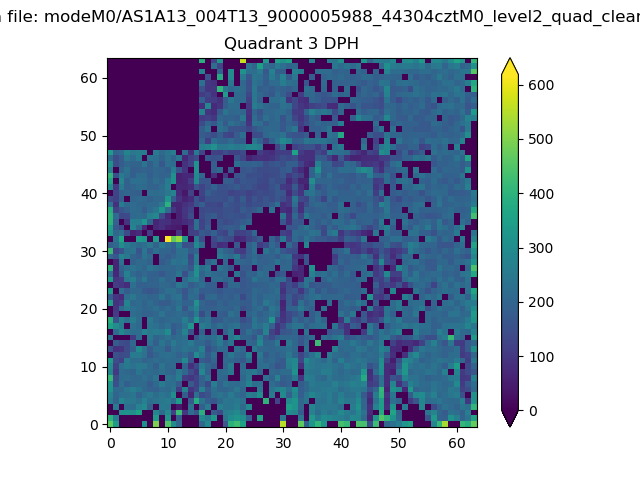 |
 |
Quadrant C |
| Plot type | Count rate plots | Images |
|---|---|---|
| Comparison with Poisson distribution Blue bars denote a histogram of data divided into 1 sec bins. Red curve is a Poisson curve with rate = median count rate of data. |
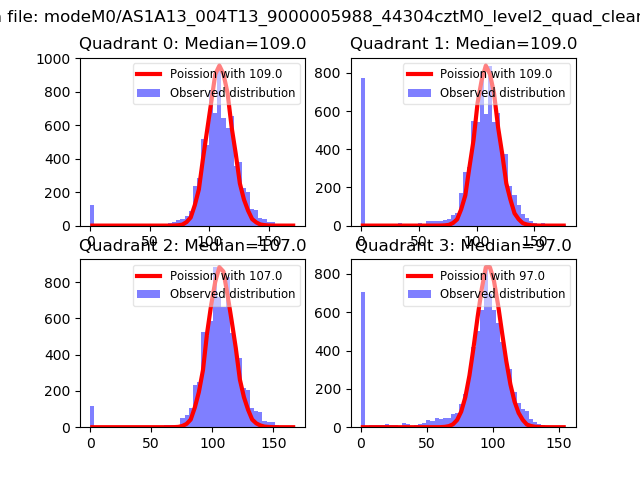 |
 |
| Quadrant-wise count rates Data is divided into 100 sec bins |
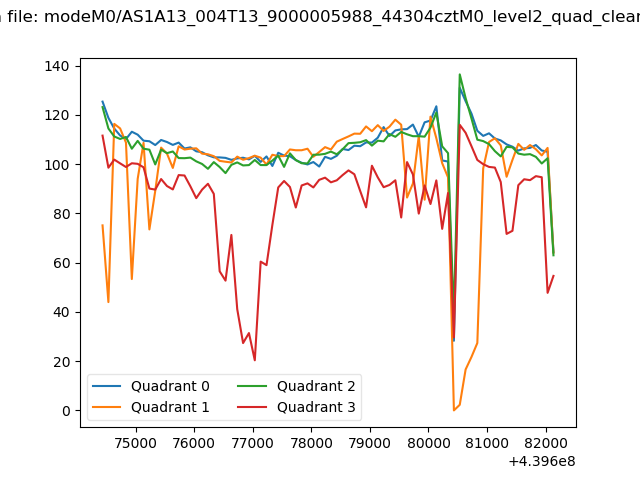 |
|
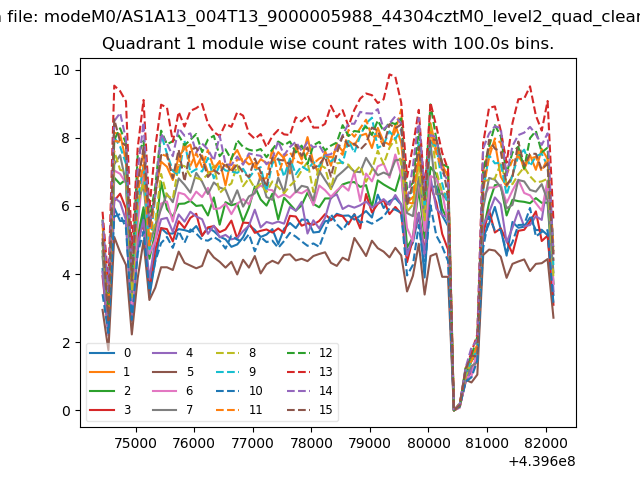
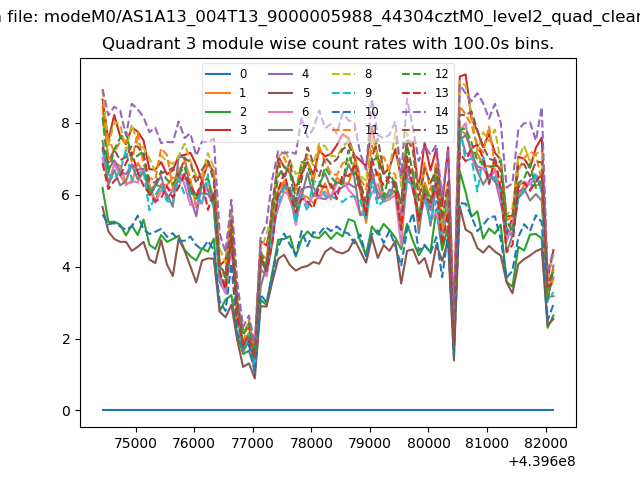
| Module-wise count rates for Quadrant A Data is divided into 100 sec bins |
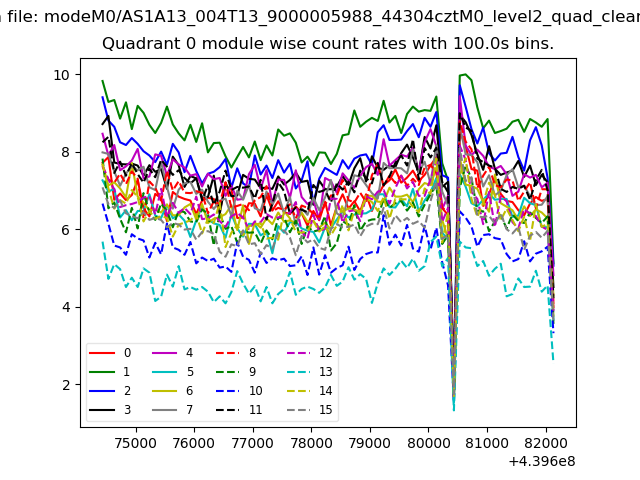 |
 |
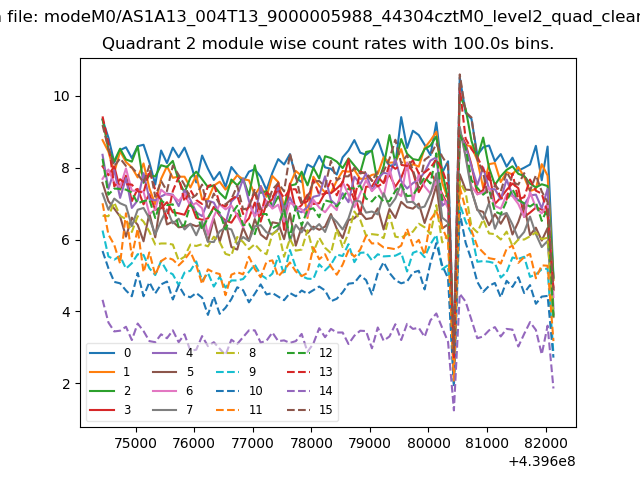
| Module-wise count rates for Quadrant B Data is divided into 100 sec bins |
 |
 |
| Module-wise count rates for Quadrant C Data is divided into 100 sec bins |
 |
 |
| Module-wise count rates for Quadrant D Data is divided into 100 sec bins |
 |
 |
| Parameter | Plot |
|---|---|
| CZT HV Monitor | 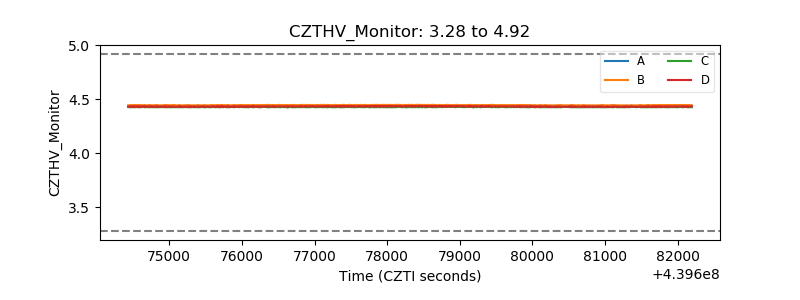 |
| D_VDD | 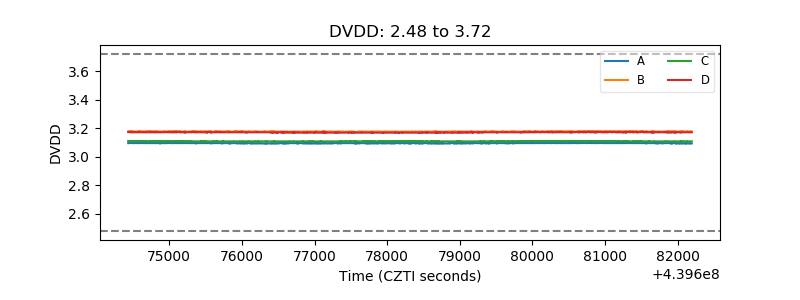 |
| Temperature 1 | 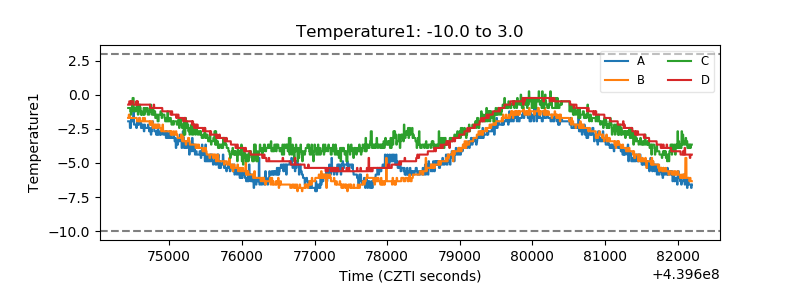 |
| Veto HV Monitor | 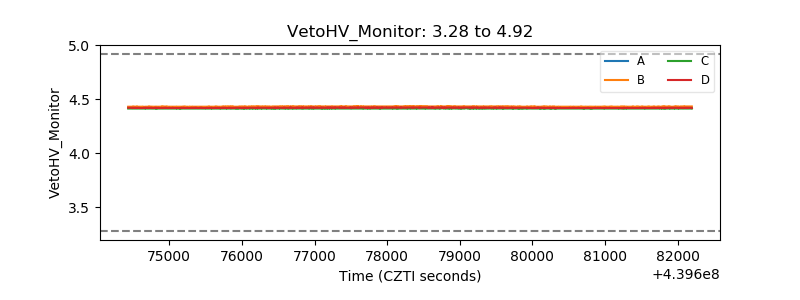 |
| Veto LLD | 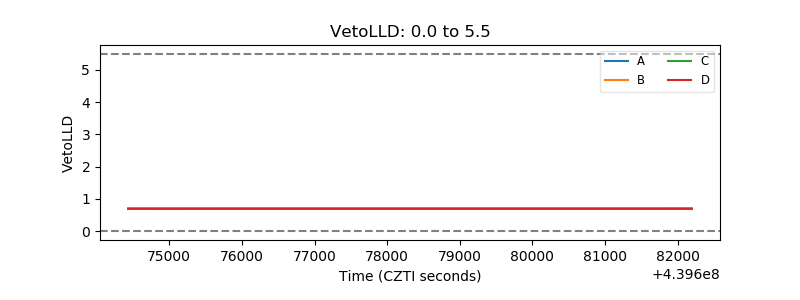 |
| Alpha Counter | 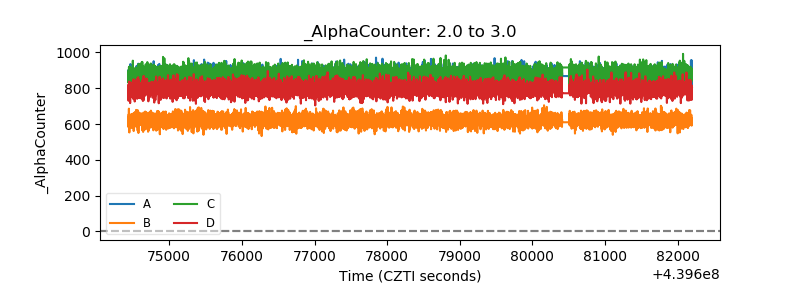 |
| _CPM_Rate | 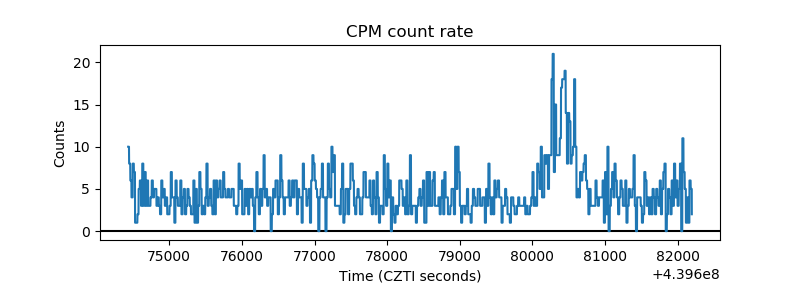 |
| CZT Counter | 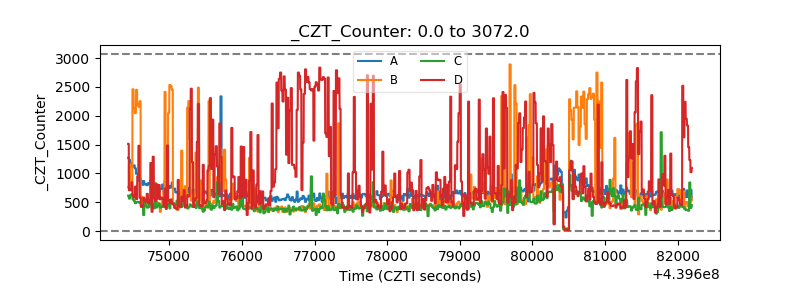 |
| +2.5 Volts monitor | 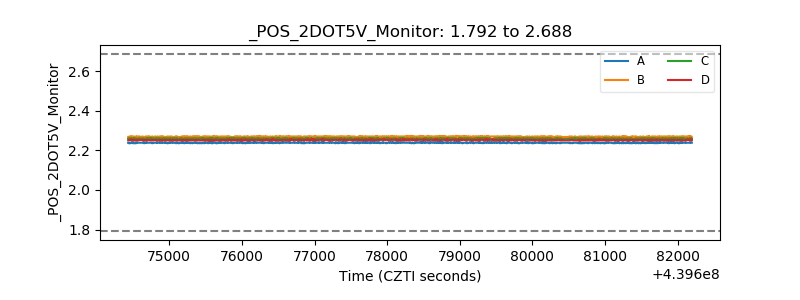 |
| +5 Volts monitor | 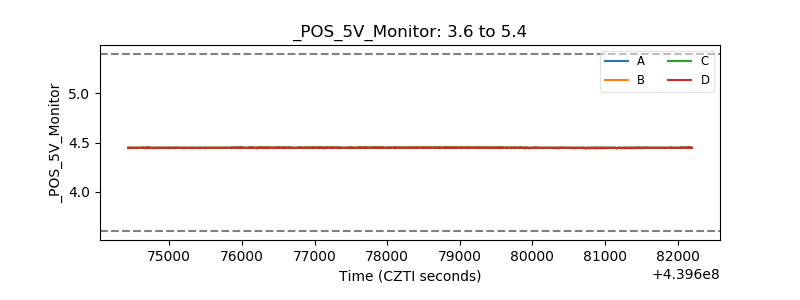 |
| _ROLL_ROT | 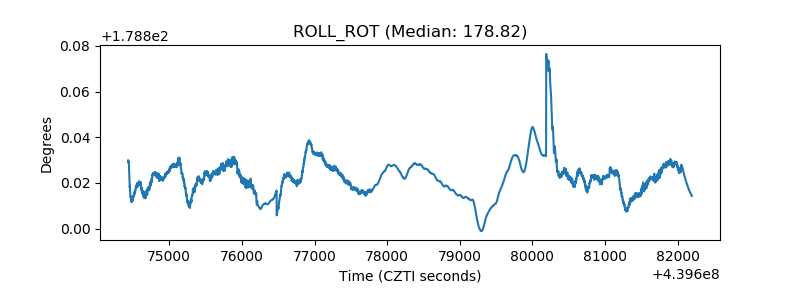 |
| _Roll_DEC | 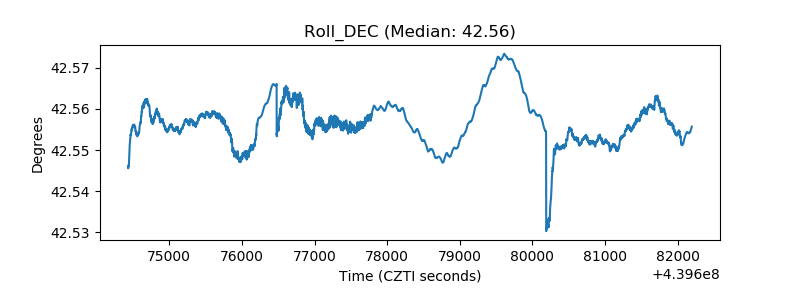 |
| _Roll_RA | 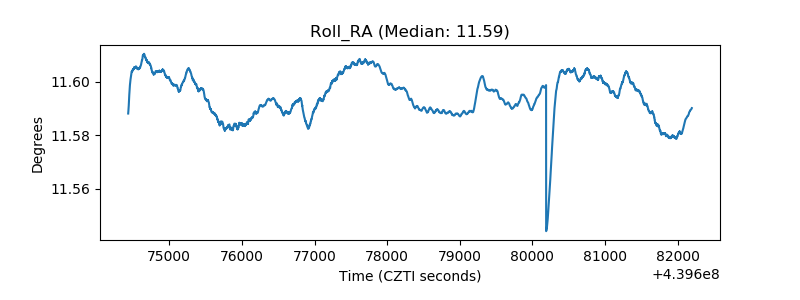 |
| Veto Counter | 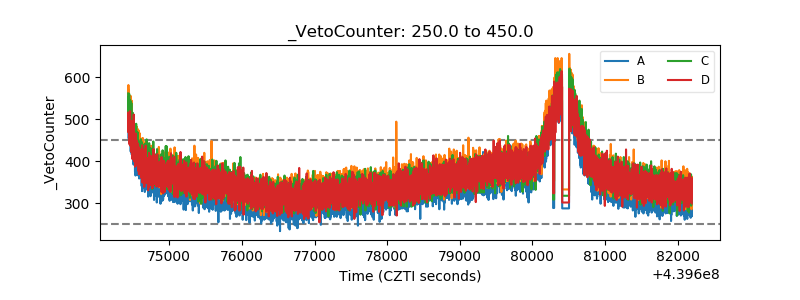 |