| Param | Original file | Final file |
|---|---|---|
| Filename | modeM0/AS1A13_004T13_9000005988_44305cztM0_level2.fits | modeM0/AS1A13_004T13_9000005988_44305cztM0_level2_quad_clean.evt |
| Size (bytes) | 660,444,480 | 127,218,240 |
| Size | 629.8 MB | 121.3 MB |
| Events in quadrant A | 5,507,118 | 892,141 |
| Events in quadrant B | 5,539,454 | 835,990 |
| Events in quadrant C | 4,507,819 | 870,530 |
| Events in quadrant D | 8,257,435 | 683,262 |
| Mode M0 | |||
|---|---|---|---|
| Quadrant | BADHDUFLAG | Total packets | Discarded packets |
| A | 0 | 22737 | 2 |
| B | 0 | 22144 | 2 |
| C | 0 | 19171 | 2 |
| D | 0 | 30354 | 2 |
| Mode SS | |||
|---|---|---|---|
| Quadrant | BADHDUFLAG | Total packets | Discarded packets |
| A | 0 | 166 | 0 |
| B | 0 | 166 | 0 |
| C | 0 | 166 | 0 |
| D | 0 | 166 | 0 |
| Mode M9 | |||
|---|---|---|---|
| Quadrant | BADHDUFLAG | Total packets | Discarded packets |
| A | 0 | 1 | 0 |
| B | 0 | 1 | 0 |
| C | 0 | 1 | 0 |
| D | 0 | 1 | 0 |
| Quadrant | Total seconds | Saturated seconds | Saturation percentage |
|---|---|---|---|
| A | 8197 | 95 | 1.158961% |
| B | 8198 | 690 | 8.416687% |
| C | 8198 | 96 | 1.171017% |
| D | 8198 | 1427 | 17.406685% |
Noise dominated data is calculated using 1-second bins in cleaned event files. If a bin has >2000 counts, and if more than 50% of those come from <1% of pixels, then it is considered to be noise-dominated and hence unusable.
| Quadrant | # 1 sec bins | Bins with >0 counts | Bins with >2000 counts | High rate bins dominated by noise | Noise dominated (total time) | Noise dominated (detector-on time) | Marked lightcurve |
|---|---|---|---|---|---|---|---|
| A | 8307 | 8199 | 5 | 5 | 0.06% | 0.06% | 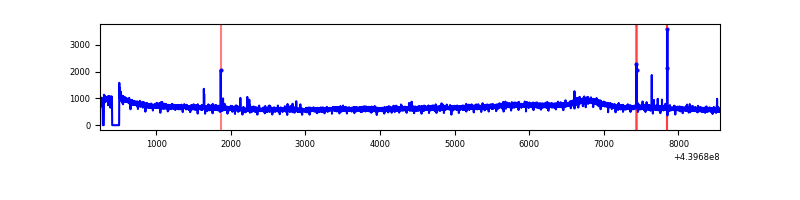 |
| B | 8308 | 8200 | 432 | 432 | 5.20% | 5.27% | 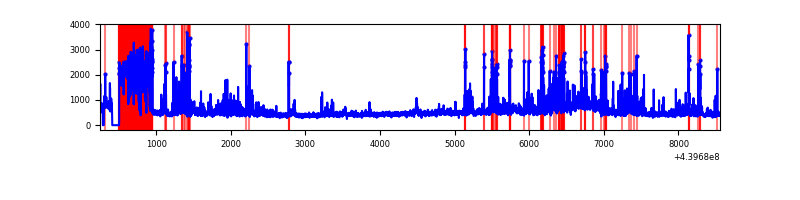 |
| C | 8308 | 8200 | 57 | 57 | 0.69% | 0.70% | 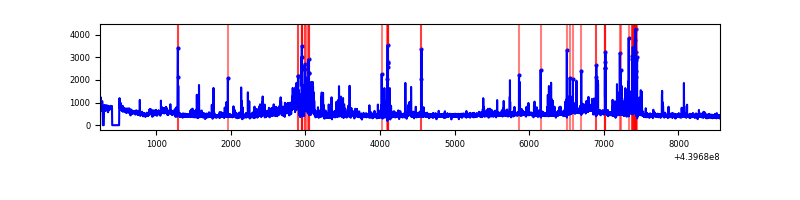 |
| D | 8308 | 8200 | 1181 | 1181 | 14.22% | 14.40% | 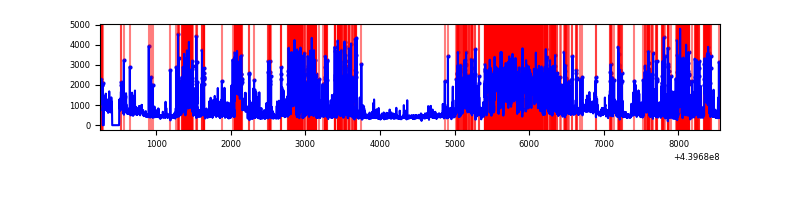 |
Top three noisy pixels from each quadrant. If the there are fewer than three noisy pixels in the level2.evt file, extra rows are filled as -1
| Pixel properties | Quadrant properties | ||||||
|---|---|---|---|---|---|---|---|
| Quadrant | DetID | PixID | Counts | Sigma | Mean | Median | Sigma |
| A | 10 | 83 | 1830107 | 9334.27 | 935 | 910 | 196.0 |
| A | 15 | 223 | 24025 | 117.95 | 935 | 910 | 196.0 |
| A | 7 | 3 | 18714 | 90.85 | 935 | 910 | 196.0 |
| B | 5 | 172 | 1205755 | 6877.77 | 889 | 861 | 175.2 |
| B | 0 | 219 | 176331 | 1001.62 | 889 | 861 | 175.2 |
| B | 5 | 255 | 120147 | 680.91 | 889 | 861 | 175.2 |
| C | 14 | 254 | 354374 | 1624.62 | 921 | 926 | 217.6 |
| C | 15 | 208 | 344223 | 1577.96 | 921 | 926 | 217.6 |
| C | 9 | 54 | 72553 | 329.23 | 921 | 926 | 217.6 |
| D | 1 | 52 | 2052661 | 9435.29 | 854 | 827 | 217.5 |
| D | 13 | 249 | 1664606 | 7650.84 | 854 | 827 | 217.5 |
| D | 13 | 171 | 240687 | 1102.99 | 854 | 827 | 217.5 |
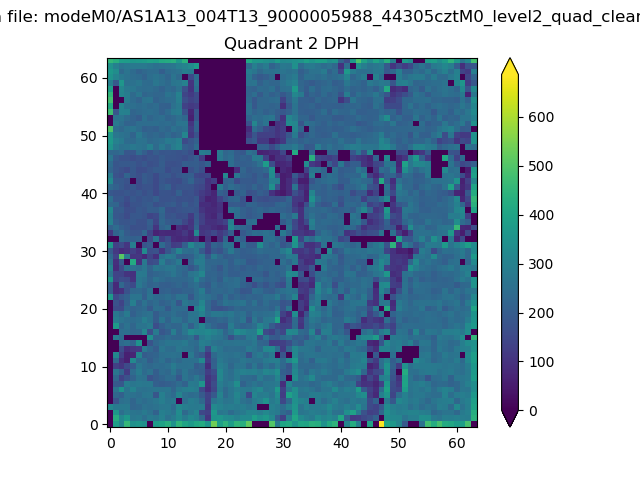
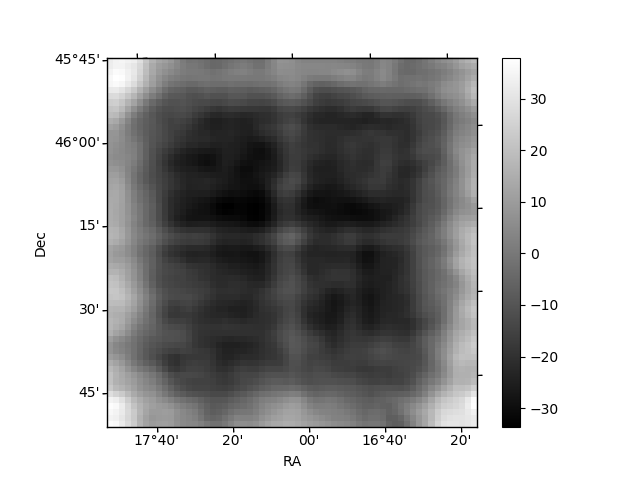
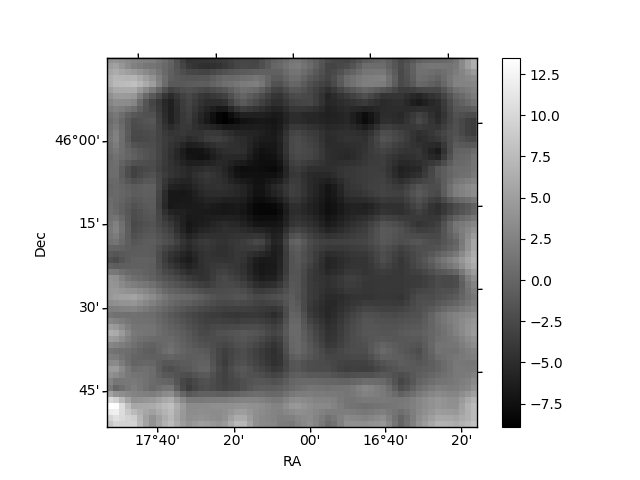
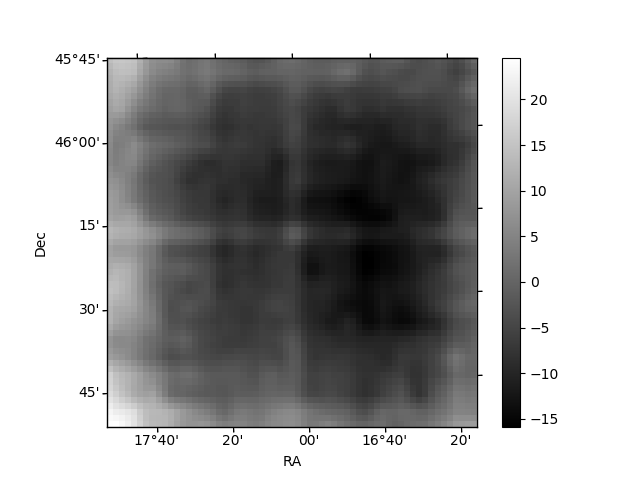
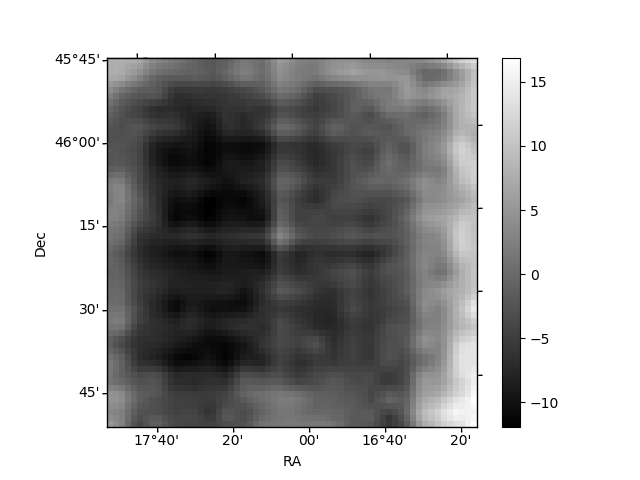
Histogram calculated using DETX and DETY for each event in the final _common_clean file
| Quadrant A | 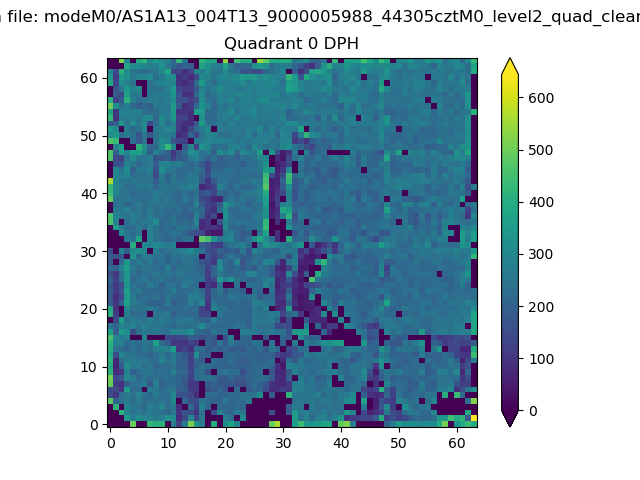 |
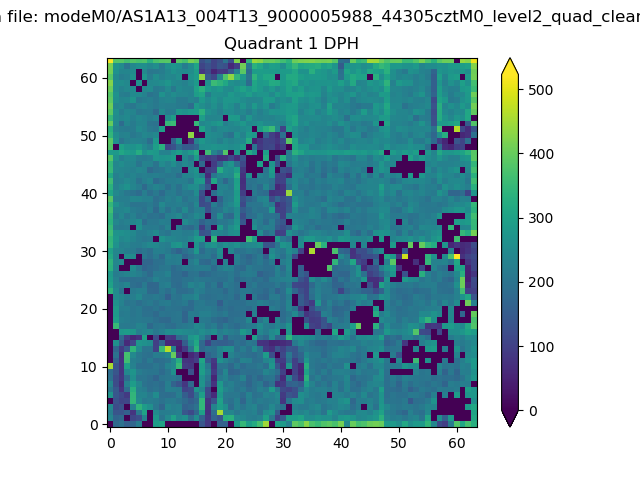 |
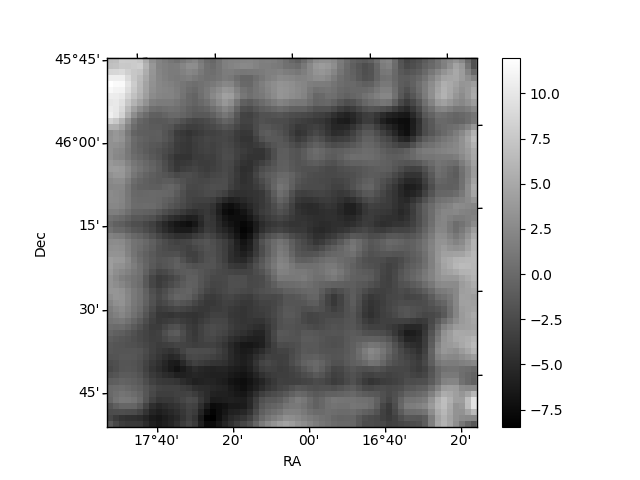
Quadrant B |
|---|---|---|---|
| Quadrant D | 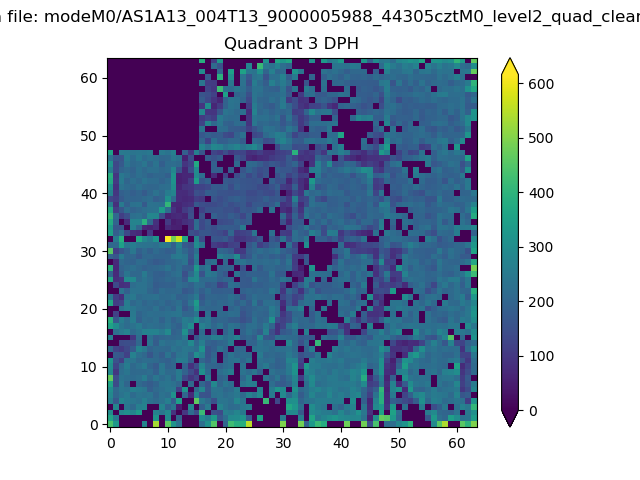 |
 |
Quadrant C |
| Plot type | Count rate plots | Images |
|---|---|---|
| Comparison with Poisson distribution Blue bars denote a histogram of data divided into 1 sec bins. Red curve is a Poisson curve with rate = median count rate of data. |
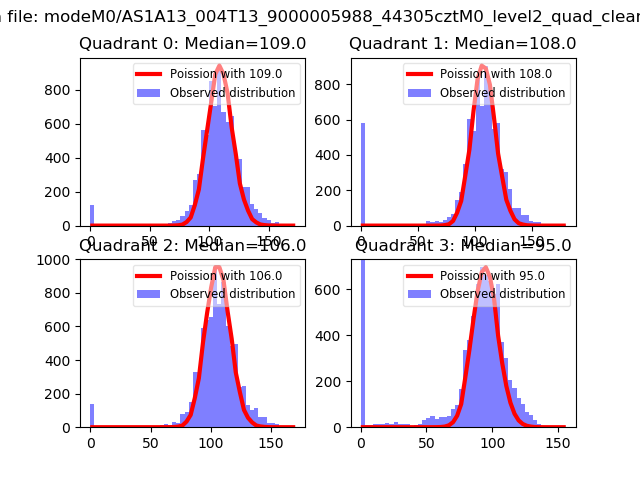 |
 |
| Quadrant-wise count rates Data is divided into 100 sec bins |
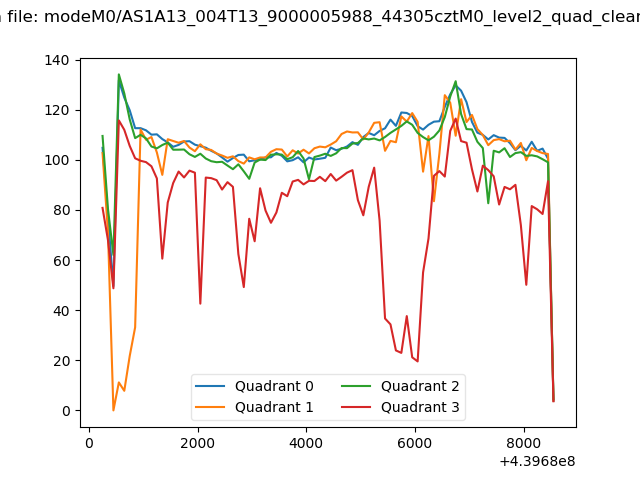 |
|
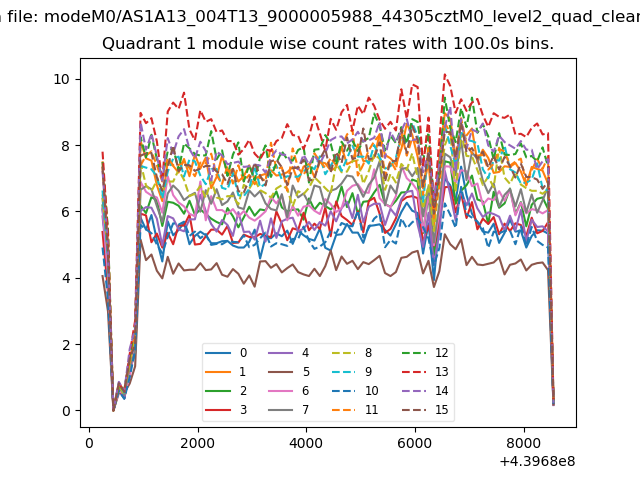
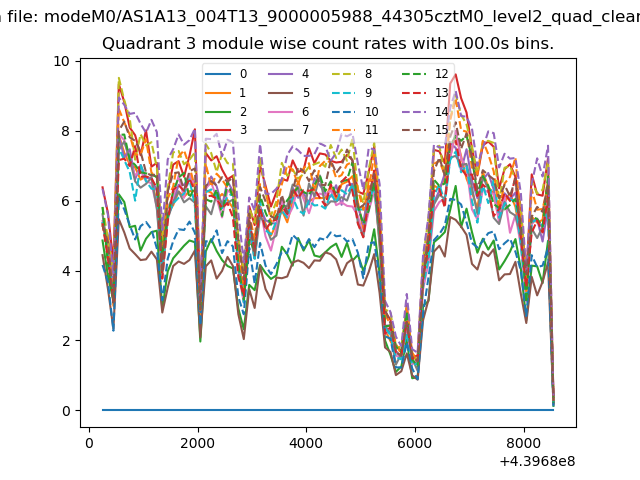
| Module-wise count rates for Quadrant A Data is divided into 100 sec bins |
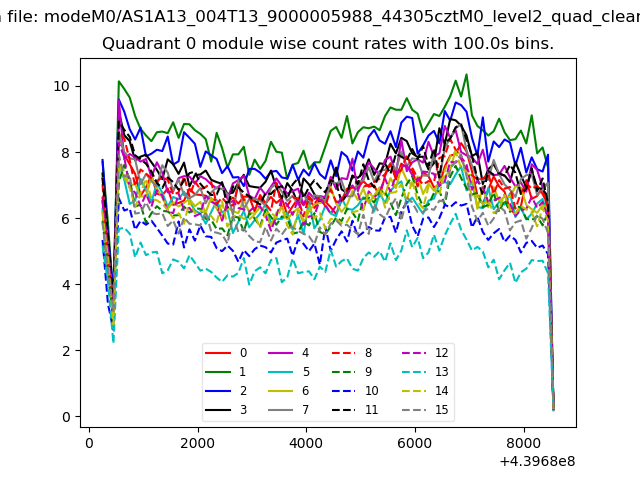 |
 |
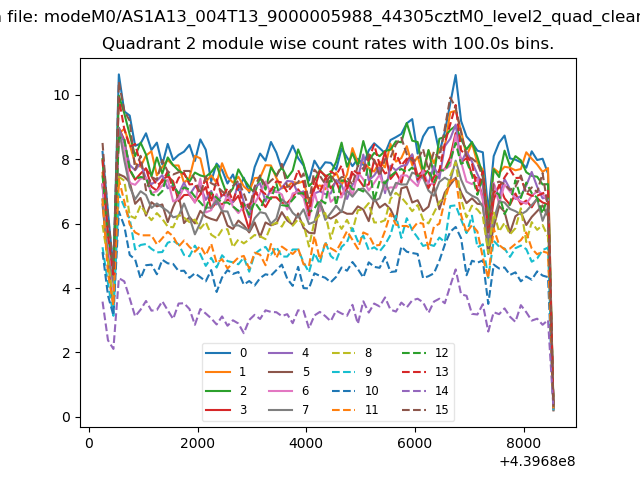
| Module-wise count rates for Quadrant B Data is divided into 100 sec bins |
 |
 |
| Module-wise count rates for Quadrant C Data is divided into 100 sec bins |
 |
 |
| Module-wise count rates for Quadrant D Data is divided into 100 sec bins |
 |
 |
| Parameter | Plot |
|---|---|
| CZT HV Monitor | 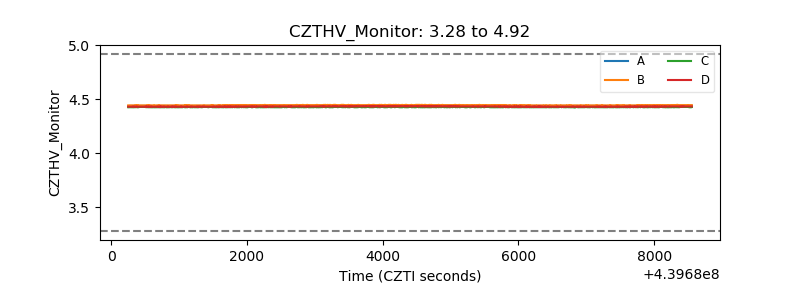 |
| D_VDD | 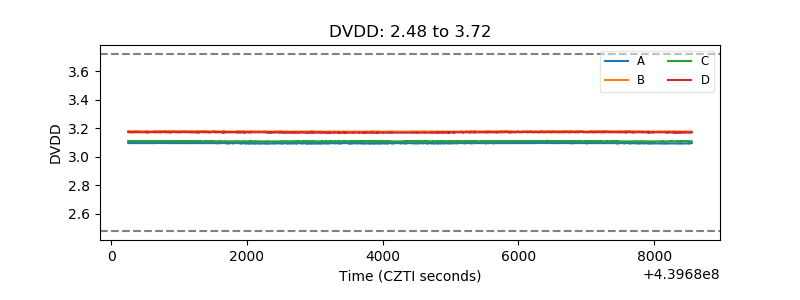 |
| Temperature 1 | 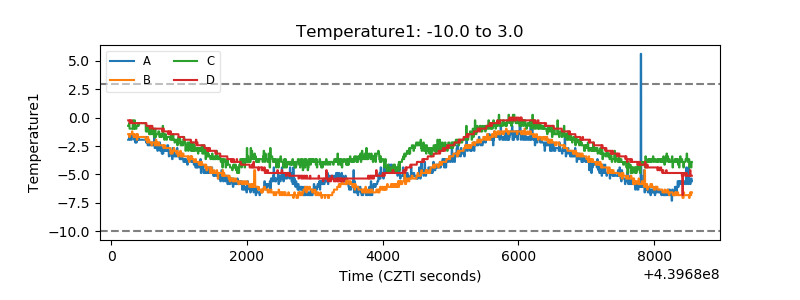 |
| Veto HV Monitor | 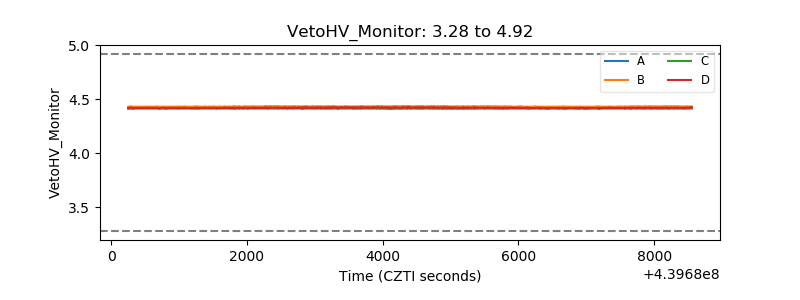 |
| Veto LLD | 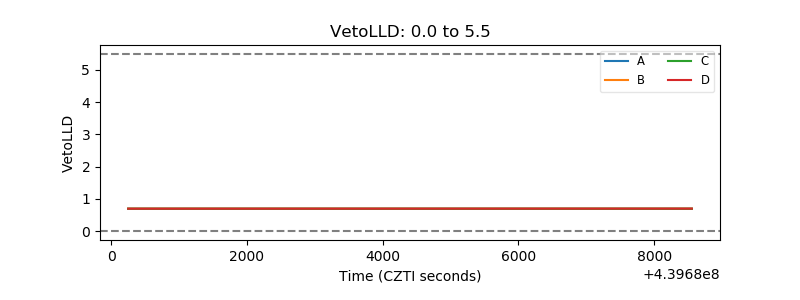 |
| Alpha Counter | 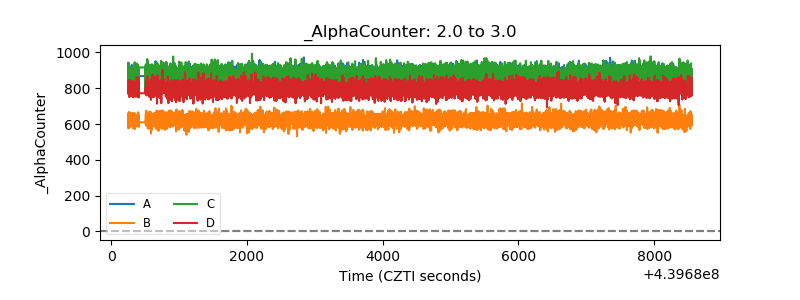 |
| _CPM_Rate | 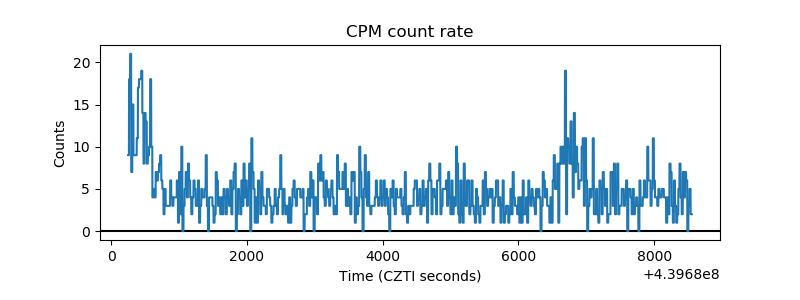 |
| CZT Counter | 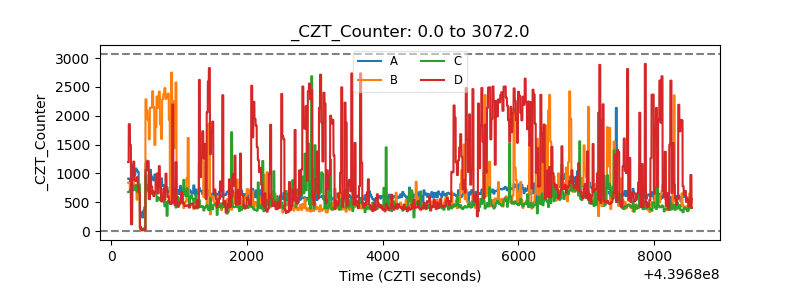 |
| +2.5 Volts monitor | 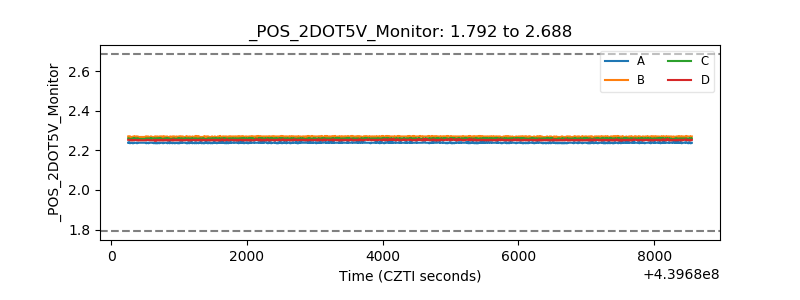 |
| +5 Volts monitor | 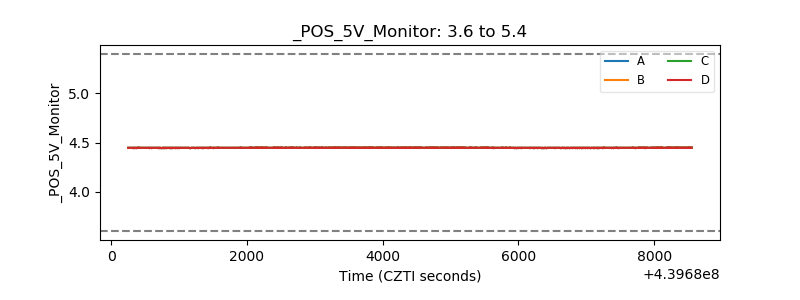 |
| _ROLL_ROT | 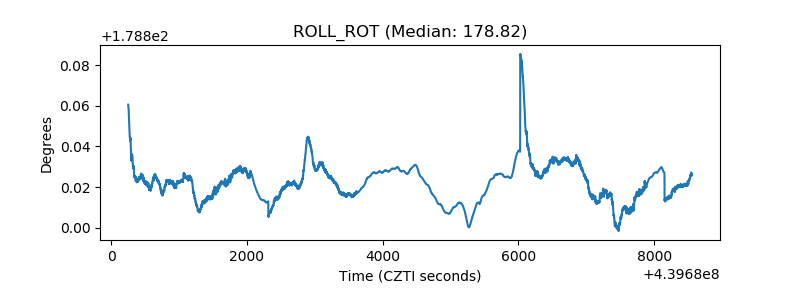 |
| _Roll_DEC | 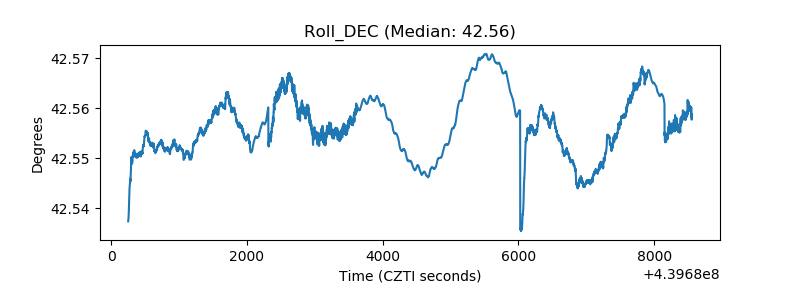 |
| _Roll_RA | 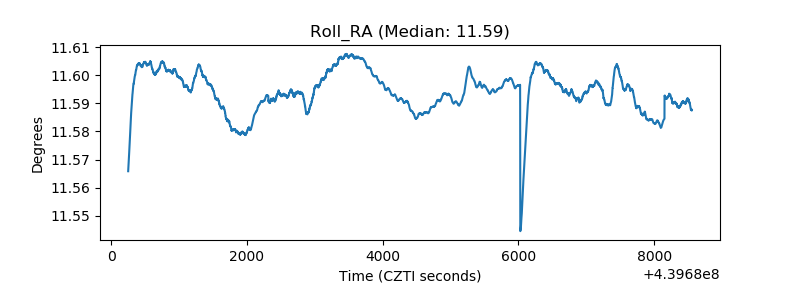 |
| Veto Counter | 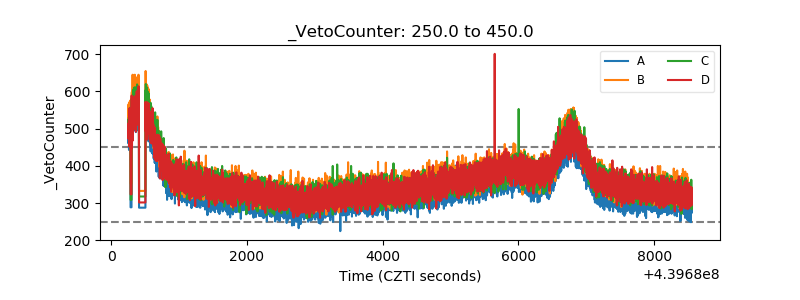 |