| Param | Original file | Final file |
|---|---|---|
| Filename | modeM0/AS1A13_004T13_9000005988_44306cztM0_level2.fits | modeM0/AS1A13_004T13_9000005988_44306cztM0_level2_quad_clean.evt |
| Size (bytes) | 659,275,200 | 140,394,240 |
| Size | 628.7 MB | 133.9 MB |
| Events in quadrant A | 5,955,472 | 954,302 |
| Events in quadrant B | 5,444,730 | 947,112 |
| Events in quadrant C | 4,485,525 | 938,160 |
| Events in quadrant D | 7,833,258 | 797,582 |
| Mode M0 | |||
|---|---|---|---|
| Quadrant | BADHDUFLAG | Total packets | Discarded packets |
| A | 0 | 24546 | 0 |
| B | 0 | 22239 | 0 |
| C | 0 | 19679 | 1 |
| D | 0 | 29540 | 0 |
| Mode SS | |||
|---|---|---|---|
| Quadrant | BADHDUFLAG | Total packets | Discarded packets |
| A | 0 | 176 | 0 |
| B | 0 | 176 | 0 |
| C | 0 | 176 | 0 |
| D | 0 | 176 | 0 |
| Quadrant | Total seconds | Saturated seconds | Saturation percentage |
|---|---|---|---|
| A | 8841 | 163 | 1.843683% |
| B | 8842 | 420 | 4.750057% |
| C | 8841 | 109 | 1.232892% |
| D | 8841 | 968 | 10.948988% |
Noise dominated data is calculated using 1-second bins in cleaned event files. If a bin has >2000 counts, and if more than 50% of those come from <1% of pixels, then it is considered to be noise-dominated and hence unusable.
| Quadrant | # 1 sec bins | Bins with >0 counts | Bins with >2000 counts | High rate bins dominated by noise | Noise dominated (total time) | Noise dominated (detector-on time) | Marked lightcurve |
|---|---|---|---|---|---|---|---|
| A | 8841 | 8841 | 5 | 5 | 0.06% | 0.06% | 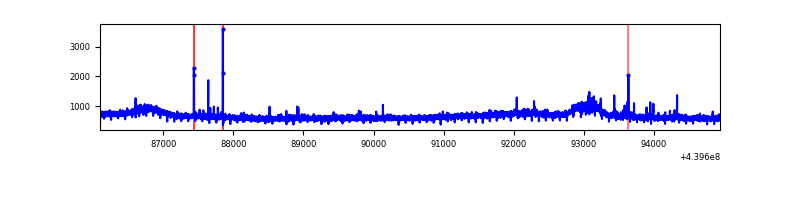 |
| B | 8842 | 8842 | 142 | 142 | 1.61% | 1.61% | 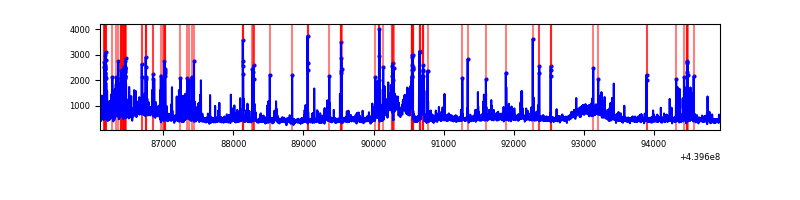 |
| C | 8841 | 8841 | 44 | 44 | 0.50% | 0.50% | 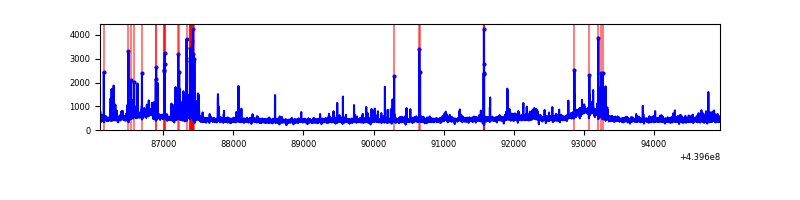 |
| D | 8841 | 8841 | 728 | 728 | 8.23% | 8.23% | 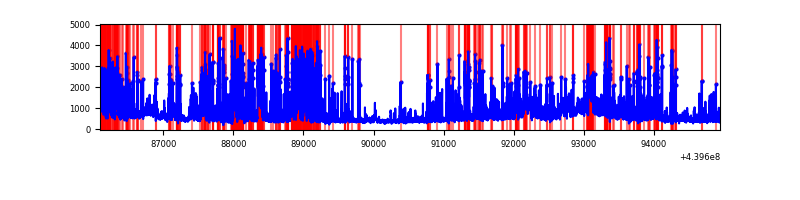 |
Top three noisy pixels from each quadrant. If the there are fewer than three noisy pixels in the level2.evt file, extra rows are filled as -1
| Pixel properties | Quadrant properties | ||||||
|---|---|---|---|---|---|---|---|
| Quadrant | DetID | PixID | Counts | Sigma | Mean | Median | Sigma |
| A | 10 | 83 | 1914689 | 8913.9 | 1020 | 993 | 214.7 |
| A | 15 | 223 | 39038 | 177.21 | 1020 | 993 | 214.7 |
| A | 7 | 3 | 37508 | 170.09 | 1020 | 993 | 214.7 |
| B | 5 | 255 | 544760 | 2727.97 | 1008 | 975 | 199.3 |
| B | 5 | 172 | 359464 | 1798.41 | 1008 | 975 | 199.3 |
| B | 0 | 190 | 113113 | 562.55 | 1008 | 975 | 199.3 |
| C | 14 | 254 | 214540 | 894.18 | 1007 | 1009 | 238.8 |
| C | 9 | 54 | 89739 | 371.56 | 1007 | 1009 | 238.8 |
| C | 3 | 233 | 86170 | 356.62 | 1007 | 1009 | 238.8 |
| D | 13 | 249 | 1340339 | 5562.25 | 963 | 932 | 240.8 |
| D | 1 | 52 | 480027 | 1989.57 | 963 | 932 | 240.8 |
| D | 13 | 171 | 474859 | 1968.11 | 963 | 932 | 240.8 |
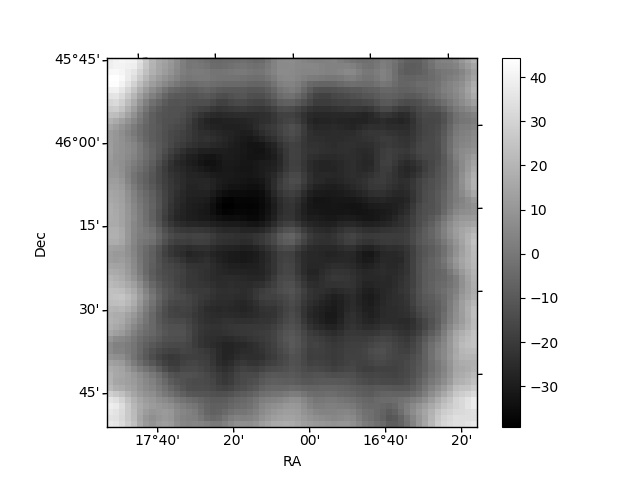
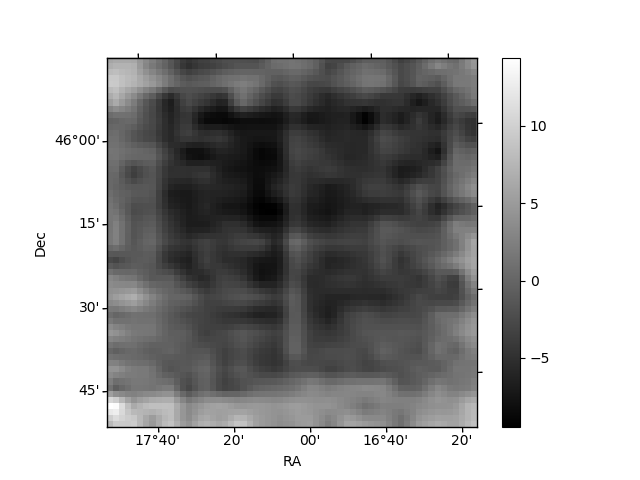
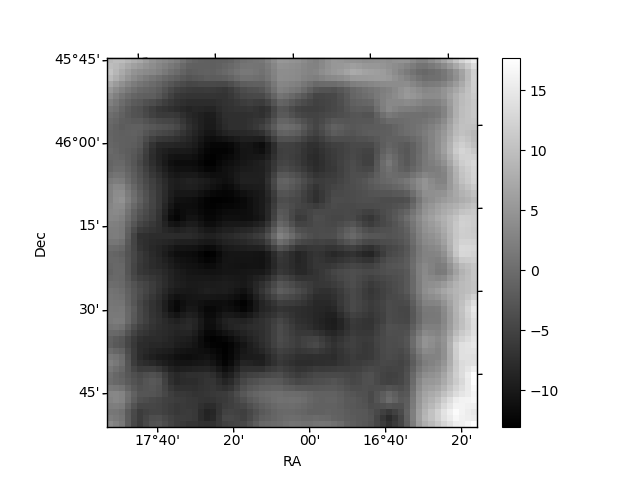
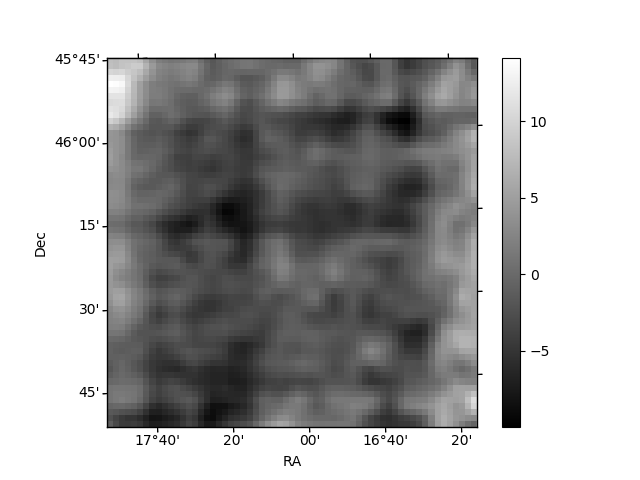
Histogram calculated using DETX and DETY for each event in the final _common_clean file
| Quadrant A | 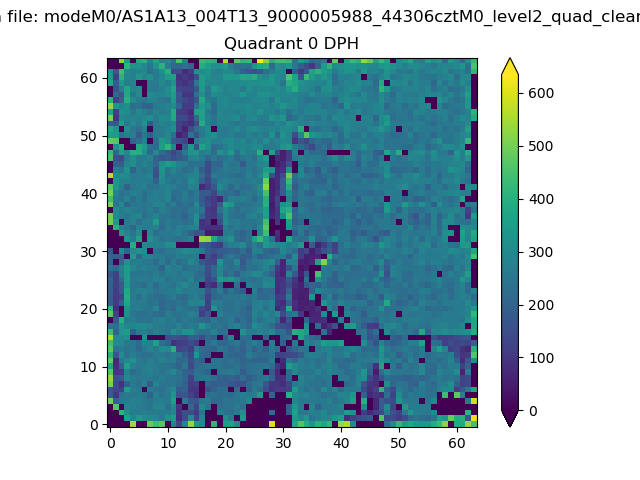 |
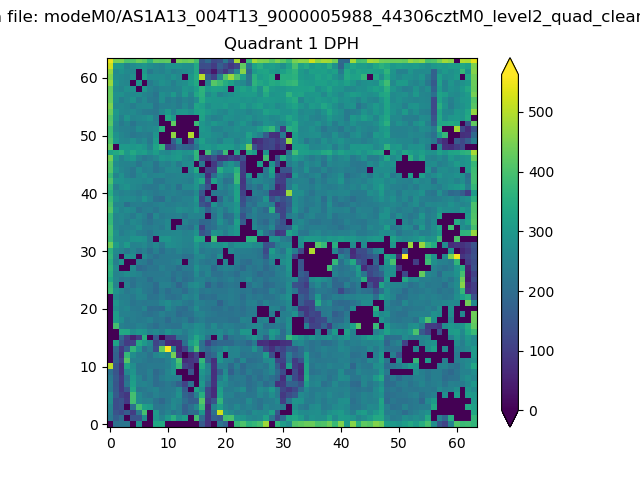 |
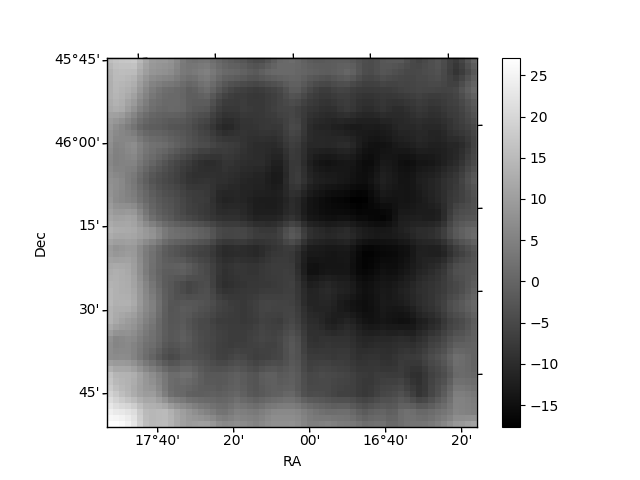
Quadrant B |
|---|---|---|---|
| Quadrant D | 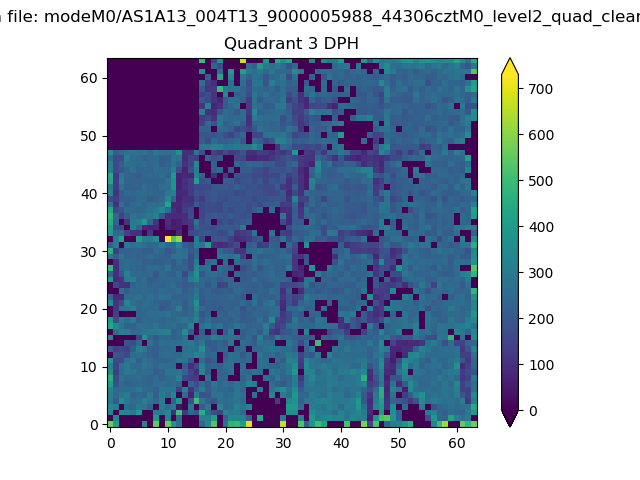 |
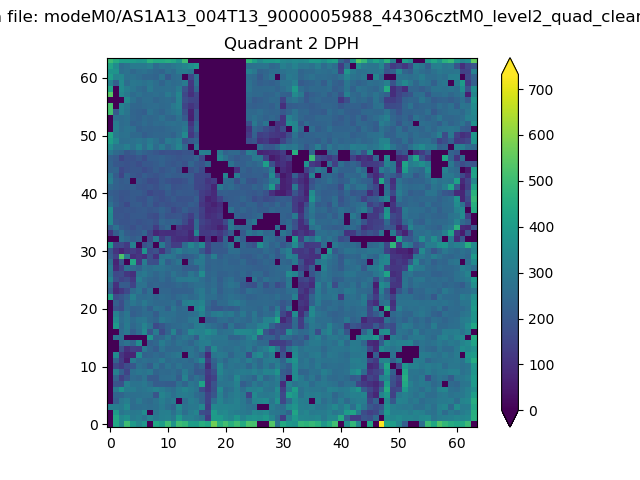 |
Quadrant C |
| Plot type | Count rate plots | Images |
|---|---|---|
| Comparison with Poisson distribution Blue bars denote a histogram of data divided into 1 sec bins. Red curve is a Poisson curve with rate = median count rate of data. |
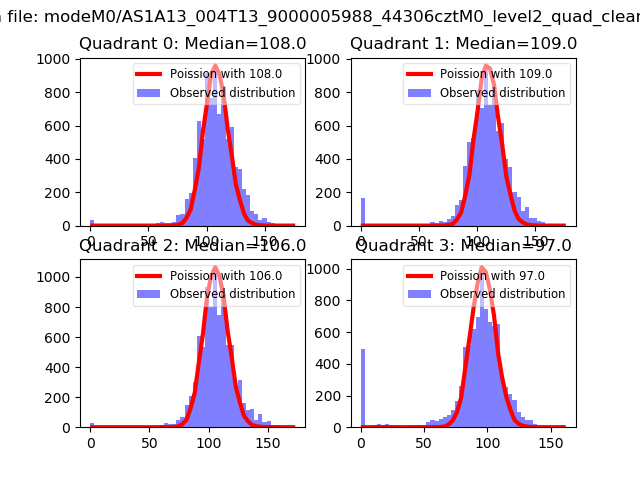 |
 |
| Quadrant-wise count rates Data is divided into 100 sec bins |
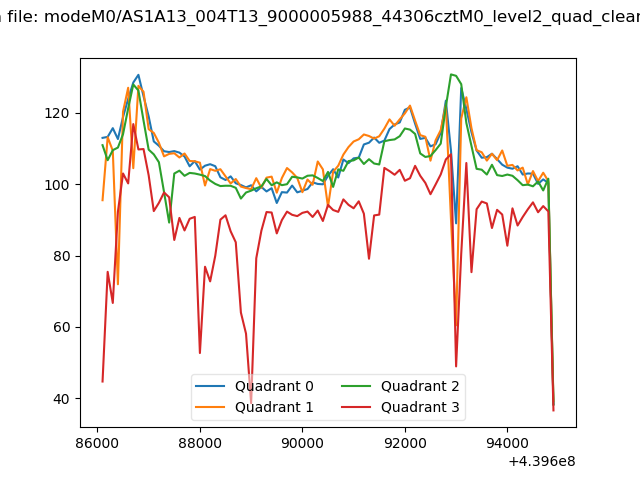 |
|
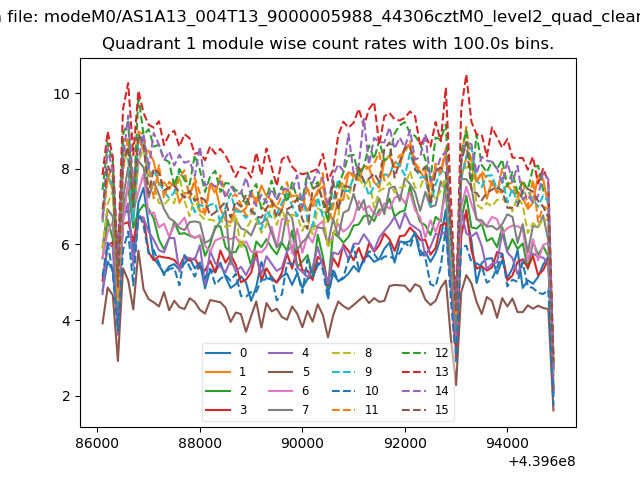
| Module-wise count rates for Quadrant A Data is divided into 100 sec bins |
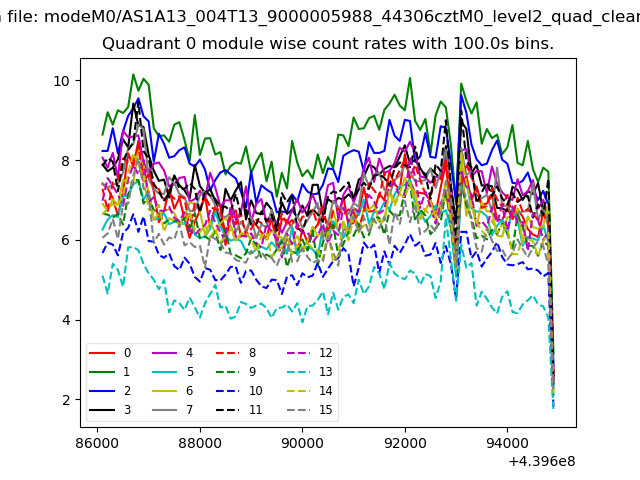 |
 |
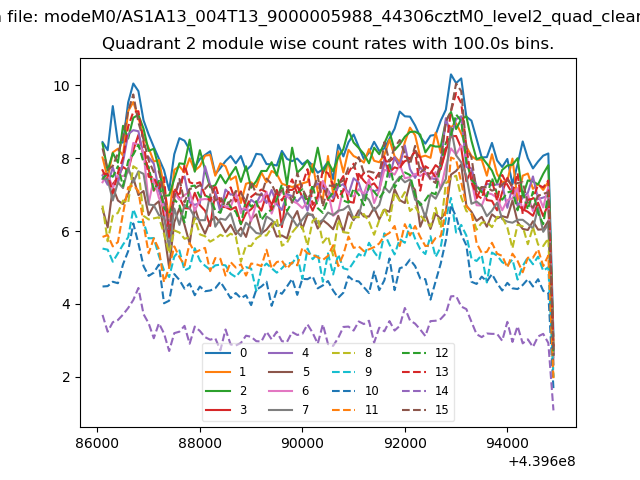
| Module-wise count rates for Quadrant B Data is divided into 100 sec bins |
 |
 |
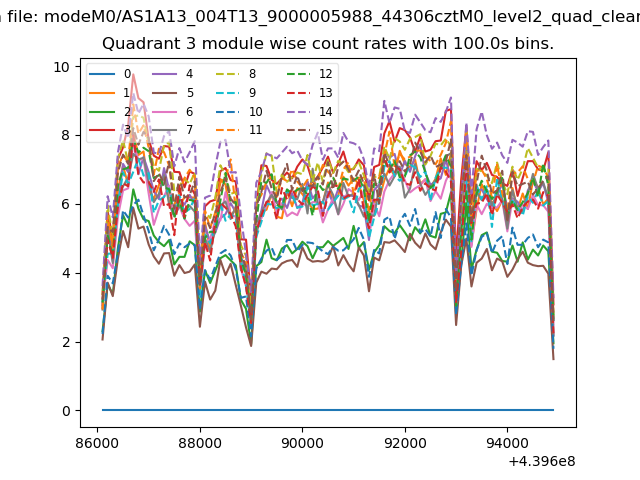
| Module-wise count rates for Quadrant C Data is divided into 100 sec bins |
 |
 |
| Module-wise count rates for Quadrant D Data is divided into 100 sec bins |
 |
 |
| Parameter | Plot |
|---|---|
| CZT HV Monitor |  |
| D_VDD | 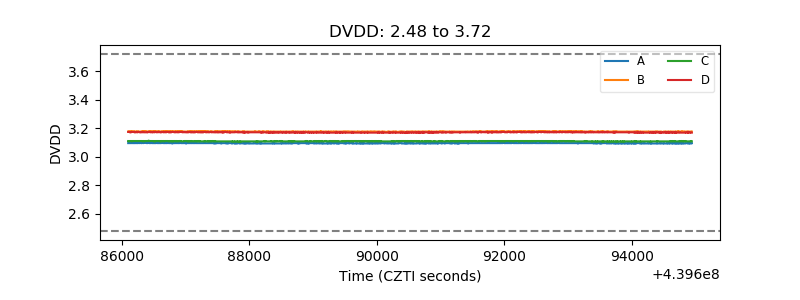 |
| Temperature 1 | 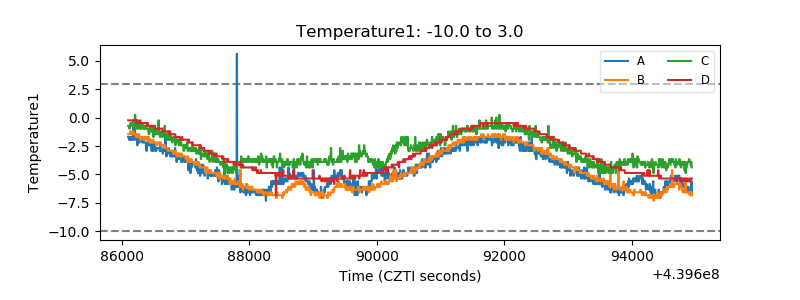 |
| Veto HV Monitor | 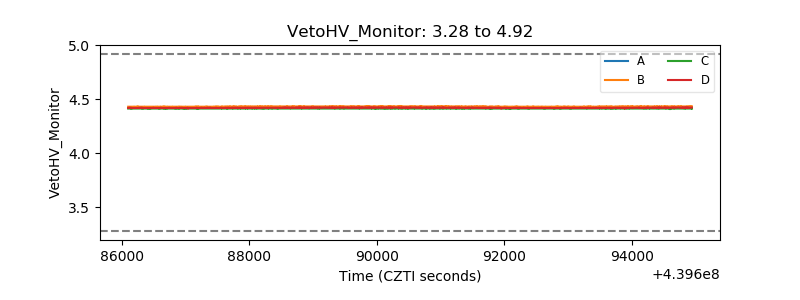 |
| Veto LLD | 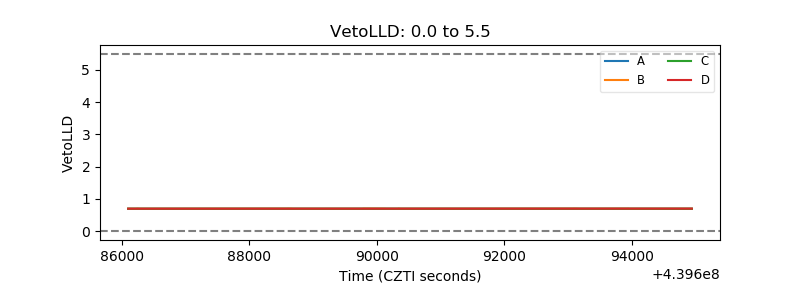 |
| Alpha Counter | 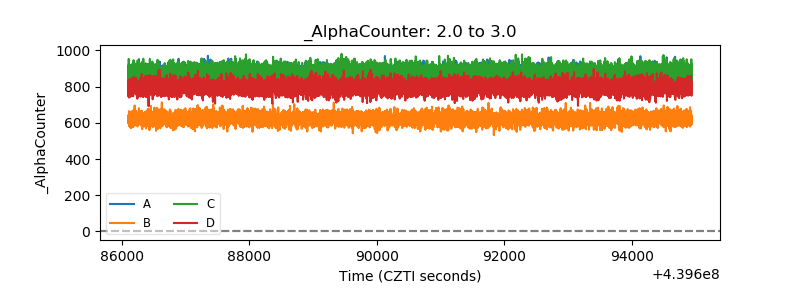 |
| _CPM_Rate | 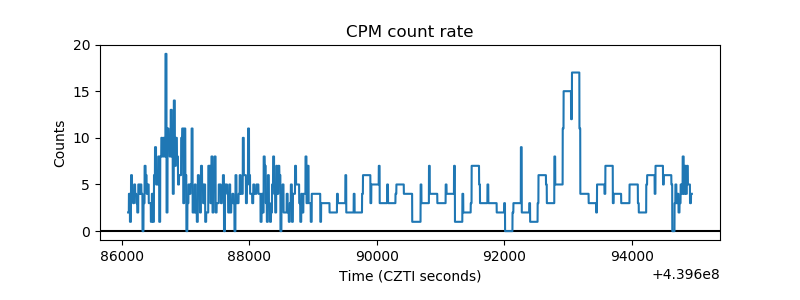 |
| CZT Counter | 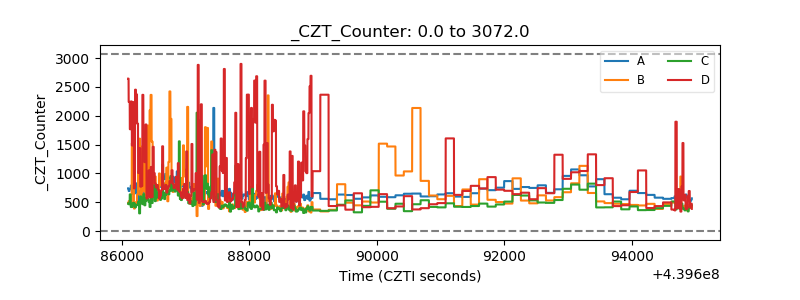 |
| +2.5 Volts monitor | 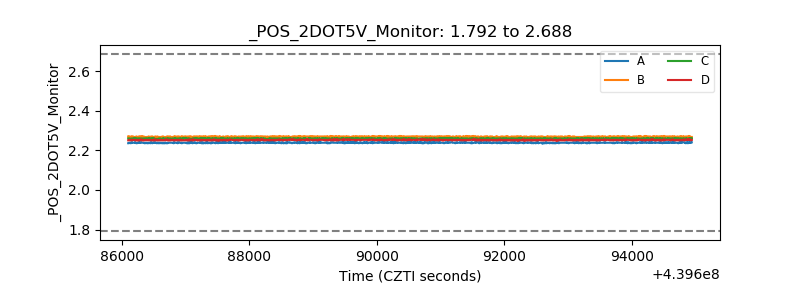 |
| +5 Volts monitor | 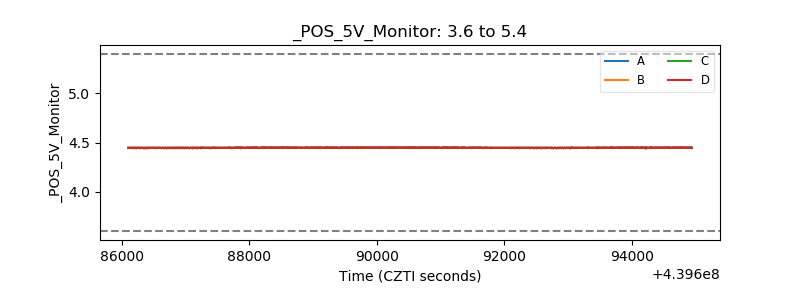 |
| _ROLL_ROT | 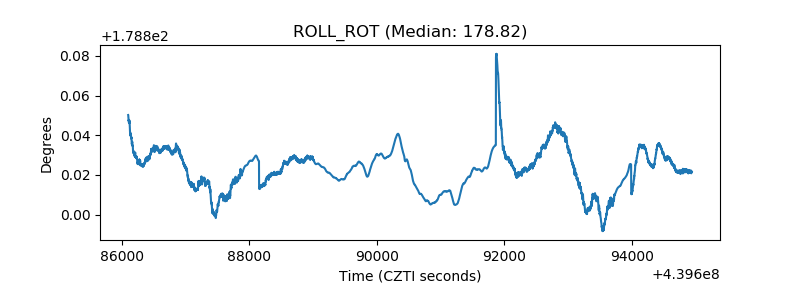 |
| _Roll_DEC | 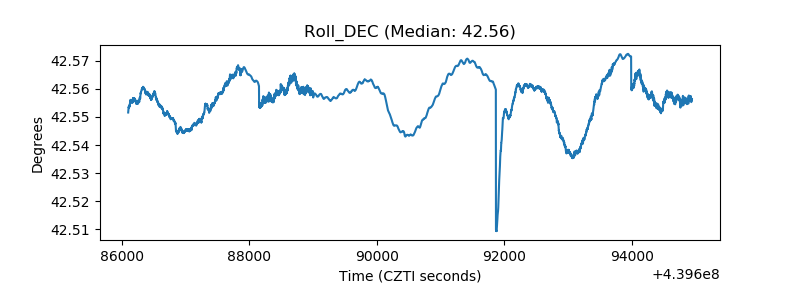 |
| _Roll_RA | 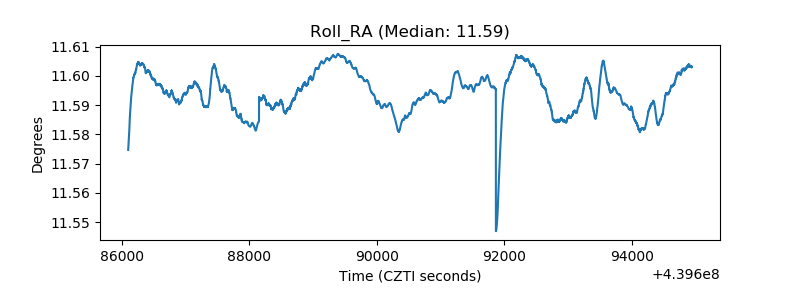 |
| Veto Counter | 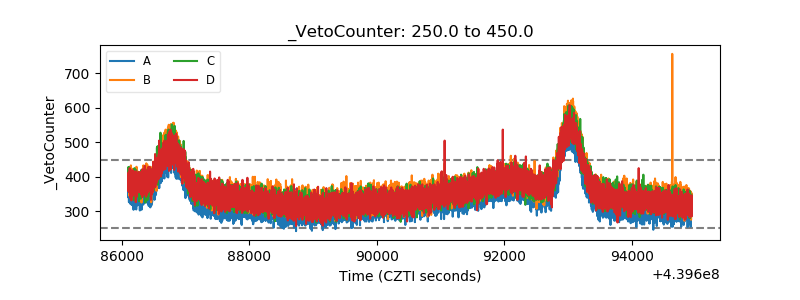 |