| Param | Original file | Final file |
|---|---|---|
| Filename | modeM0/AS1A13_004T13_9000005988_44308cztM0_level2.fits | modeM0/AS1A13_004T13_9000005988_44308cztM0_level2_quad_clean.evt |
| Size (bytes) | 860,869,440 | 200,056,320 |
| Size | 821.0 MB | 190.8 MB |
| Events in quadrant A | 8,396,423 | 1,328,406 |
| Events in quadrant B | 6,641,802 | 1,364,866 |
| Events in quadrant C | 5,899,960 | 1,323,622 |
| Events in quadrant D | 9,937,229 | 1,154,824 |
| Mode M0 | |||
|---|---|---|---|
| Quadrant | BADHDUFLAG | Total packets | Discarded packets |
| A | 0 | 35232 | 3 |
| B | 0 | 28442 | 3 |
| C | 0 | 26765 | 13 |
| D | 0 | 38473 | 2 |
| Mode SS | |||
|---|---|---|---|
| Quadrant | BADHDUFLAG | Total packets | Discarded packets |
| A | 0 | 262 | 0 |
| B | 0 | 262 | 0 |
| C | 0 | 262 | 0 |
| D | 0 | 262 | 0 |
| Mode M9 | |||
|---|---|---|---|
| Quadrant | BADHDUFLAG | Total packets | Discarded packets |
| A | 0 | 10 | 0 |
| B | 0 | 10 | 0 |
| C | 0 | 10 | 0 |
| D | 0 | 10 | 0 |
| Quadrant | Total seconds | Saturated seconds | Saturation percentage |
|---|---|---|---|
| A | 12801 | 151 | 1.179595% |
| B | 12800 | 221 | 1.726562% |
| C | 12799 | 70 | 0.546918% |
| D | 12802 | 846 | 6.608342% |
Noise dominated data is calculated using 1-second bins in cleaned event files. If a bin has >2000 counts, and if more than 50% of those come from <1% of pixels, then it is considered to be noise-dominated and hence unusable.
| Quadrant | # 1 sec bins | Bins with >0 counts | Bins with >2000 counts | High rate bins dominated by noise | Noise dominated (total time) | Noise dominated (detector-on time) | Marked lightcurve |
|---|---|---|---|---|---|---|---|
| A | 13836 | 12803 | 4 | 4 | 0.03% | 0.03% | 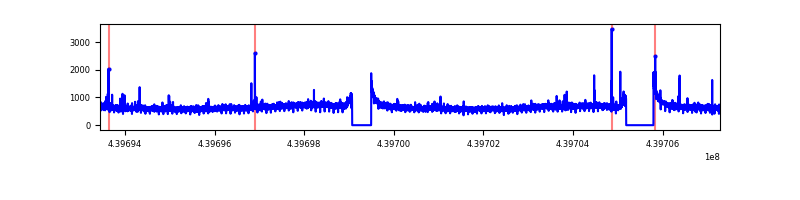 |
| B | 13836 | 12802 | 71 | 71 | 0.51% | 0.55% | 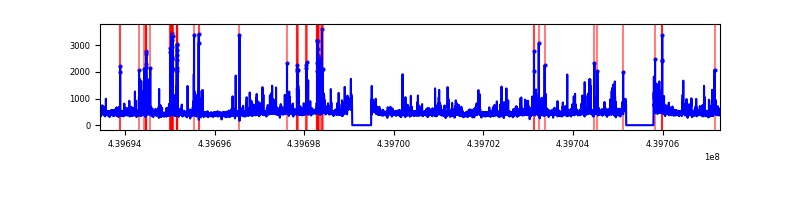 |
| C | 13837 | 12802 | 23 | 23 | 0.17% | 0.18% | 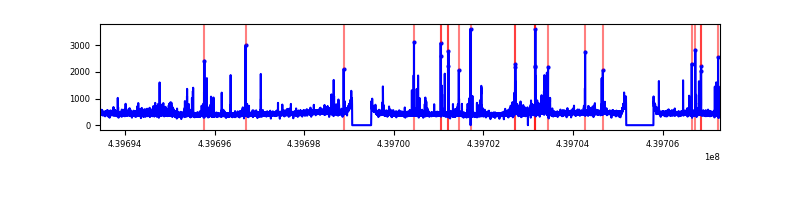 |
| D | 13837 | 12804 | 669 | 669 | 4.83% | 5.22% | 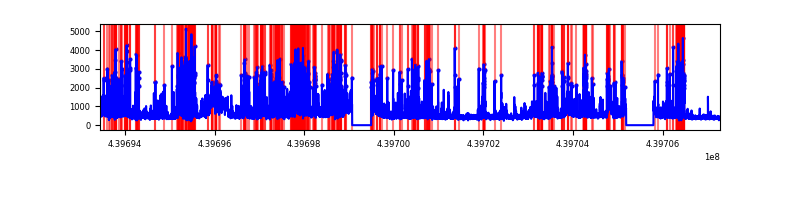 |
Top three noisy pixels from each quadrant. If the there are fewer than three noisy pixels in the level2.evt file, extra rows are filled as -1
| Pixel properties | Quadrant properties | ||||||
|---|---|---|---|---|---|---|---|
| Quadrant | DetID | PixID | Counts | Sigma | Mean | Median | Sigma |
| A | 10 | 83 | 2793309 | 9456.78 | 1418 | 1386 | 295.2 |
| A | 7 | 3 | 52162 | 171.99 | 1418 | 1386 | 295.2 |
| A | 15 | 223 | 34271 | 111.39 | 1418 | 1386 | 295.2 |
| B | 5 | 255 | 312669 | 1121.51 | 1409 | 1363 | 277.6 |
| B | 0 | 190 | 250616 | 897.96 | 1409 | 1363 | 277.6 |
| B | 0 | 219 | 134055 | 478.04 | 1409 | 1363 | 277.6 |
| C | 14 | 254 | 295363 | 898.21 | 1395 | 1397 | 327.3 |
| C | 3 | 233 | 89866 | 270.32 | 1395 | 1397 | 327.3 |
| C | 9 | 54 | 52481 | 156.09 | 1395 | 1397 | 327.3 |
| D | 13 | 171 | 969543 | 2840.54 | 1359 | 1319 | 340.9 |
| D | 13 | 249 | 813022 | 2381.34 | 1359 | 1319 | 340.9 |
| D | 1 | 20 | 786873 | 2304.63 | 1359 | 1319 | 340.9 |
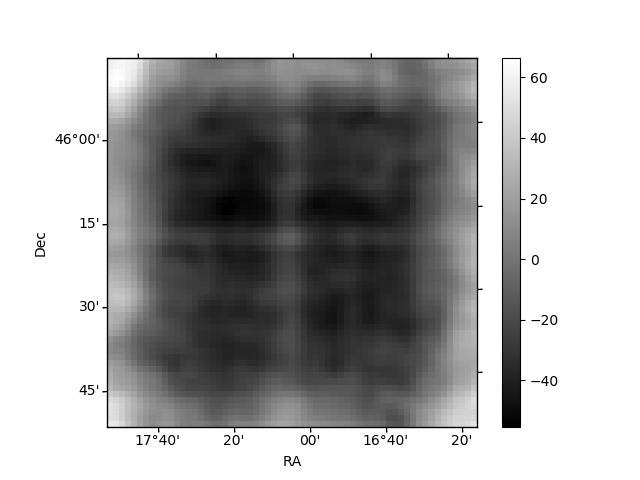
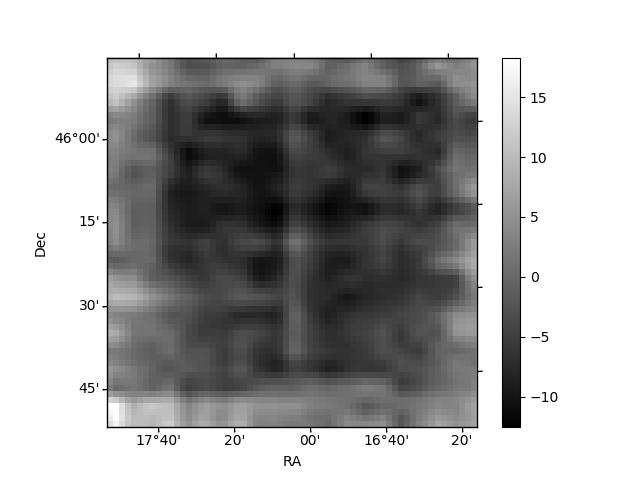
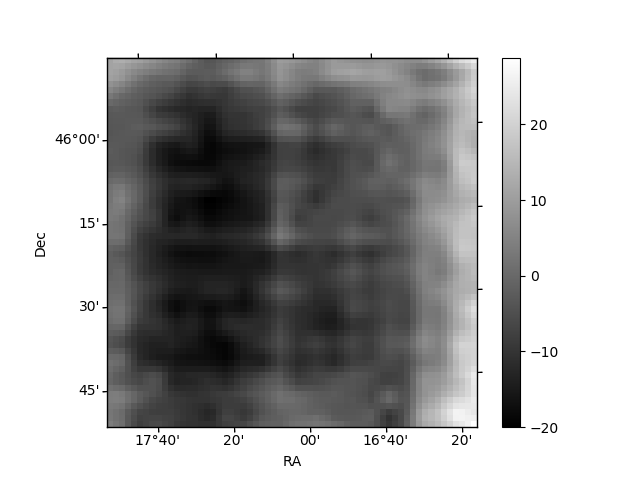
Histogram calculated using DETX and DETY for each event in the final _common_clean file
| Quadrant A | 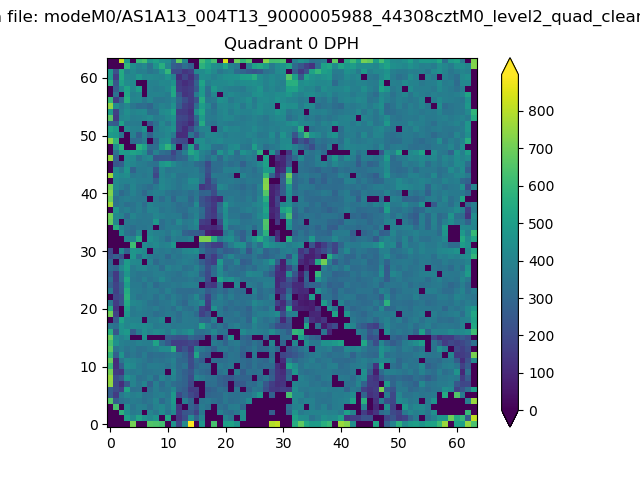 |
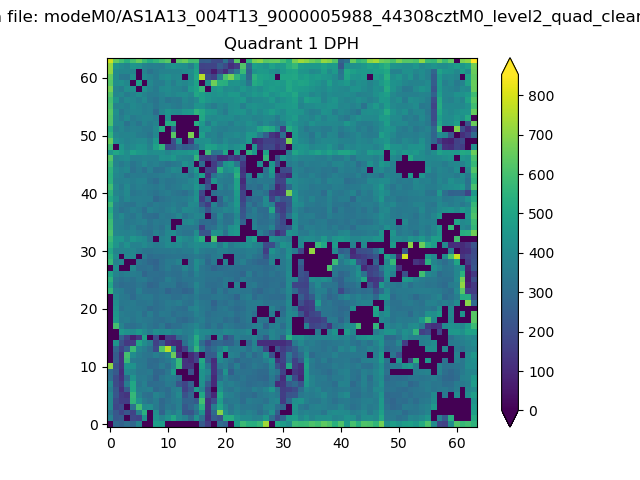 |
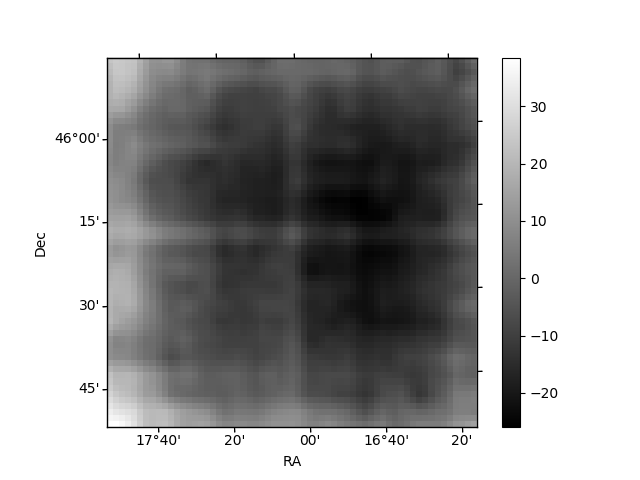
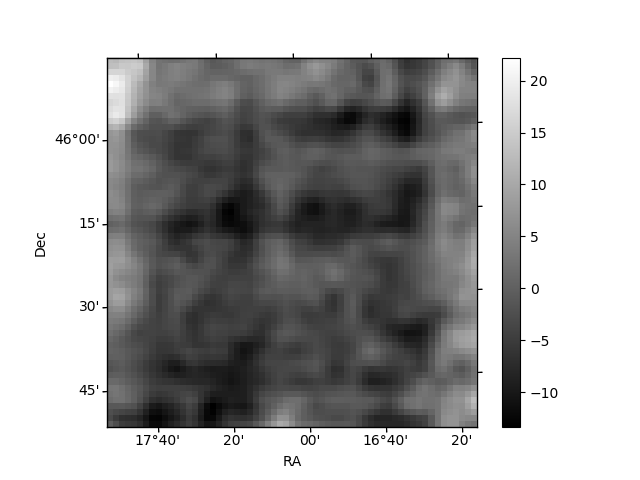
Quadrant B |
|---|---|---|---|
| Quadrant D | 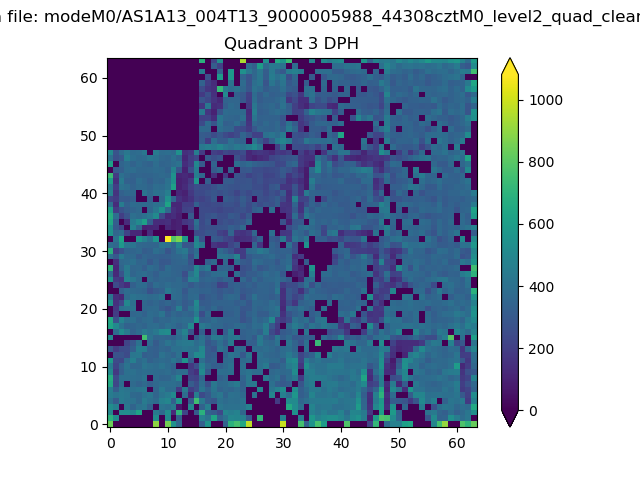 |
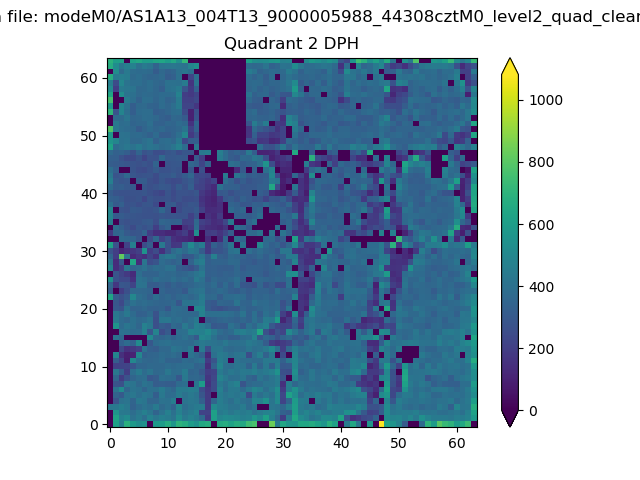 |
Quadrant C |
| Plot type | Count rate plots | Images |
|---|---|---|
| Comparison with Poisson distribution Blue bars denote a histogram of data divided into 1 sec bins. Red curve is a Poisson curve with rate = median count rate of data. |
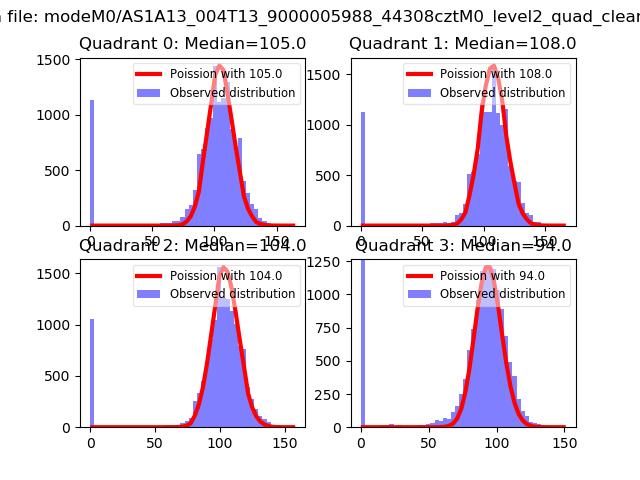 |
 |
| Quadrant-wise count rates Data is divided into 100 sec bins |
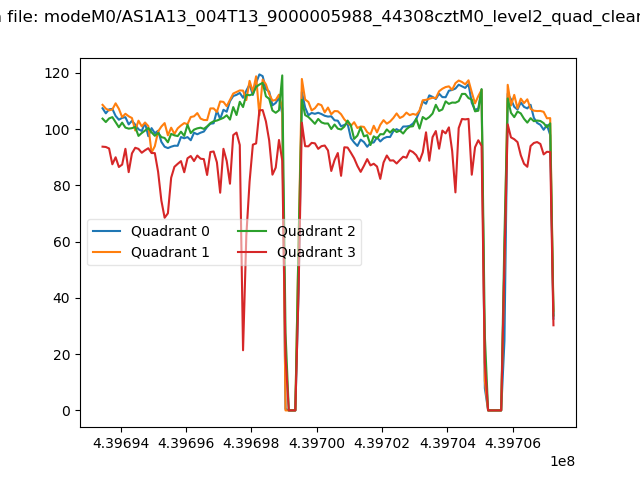 |
|
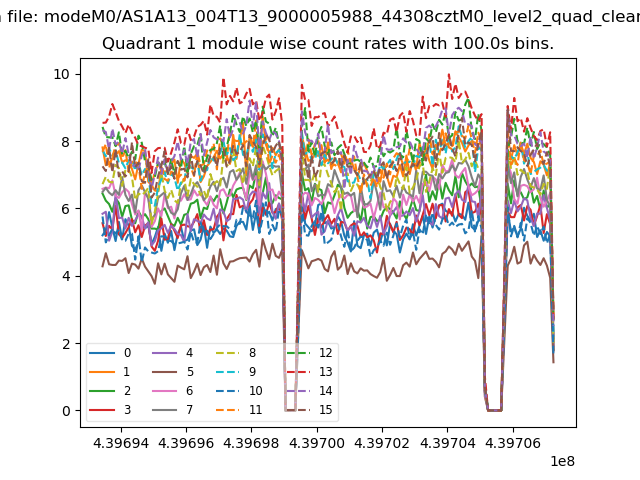
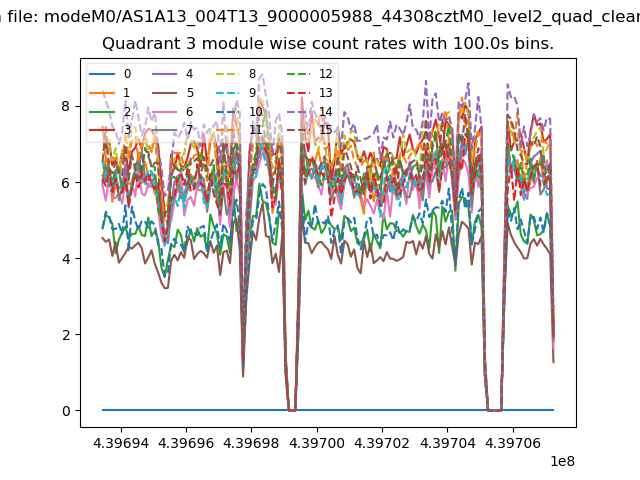
| Module-wise count rates for Quadrant A Data is divided into 100 sec bins |
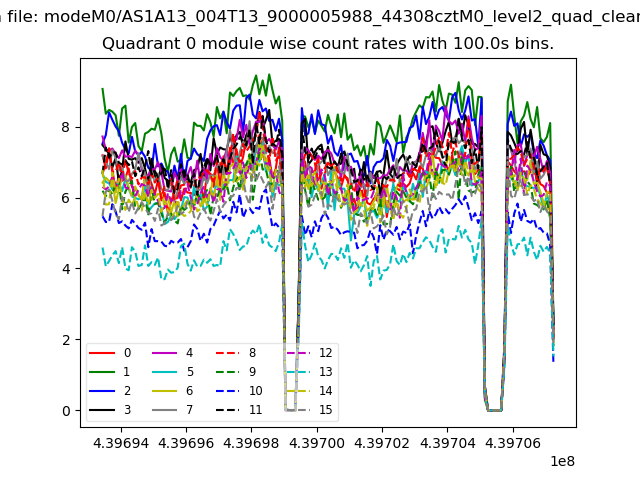 |
 |
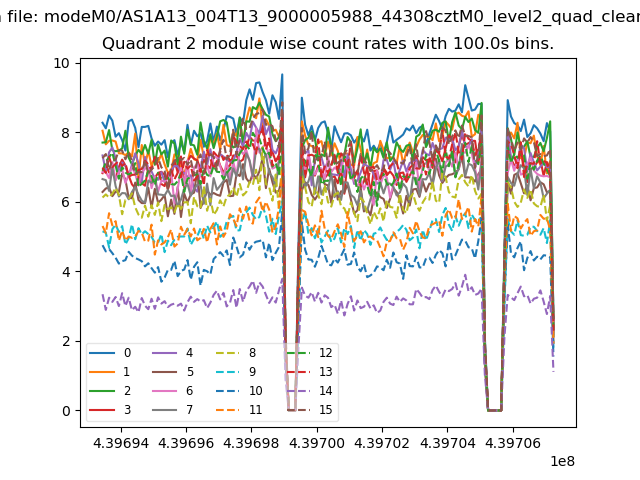
| Module-wise count rates for Quadrant B Data is divided into 100 sec bins |
 |
 |
| Module-wise count rates for Quadrant C Data is divided into 100 sec bins |
 |
 |
| Module-wise count rates for Quadrant D Data is divided into 100 sec bins |
 |
 |
| Parameter | Plot |
|---|---|
| CZT HV Monitor |  |
| D_VDD | 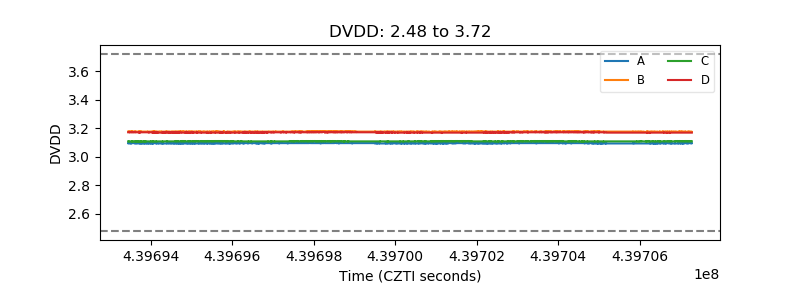 |
| Temperature 1 | 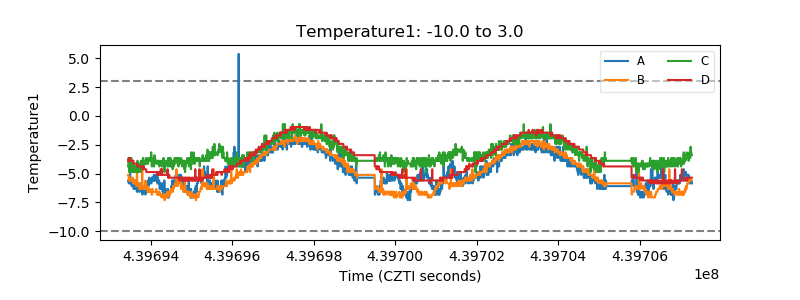 |
| Veto HV Monitor | 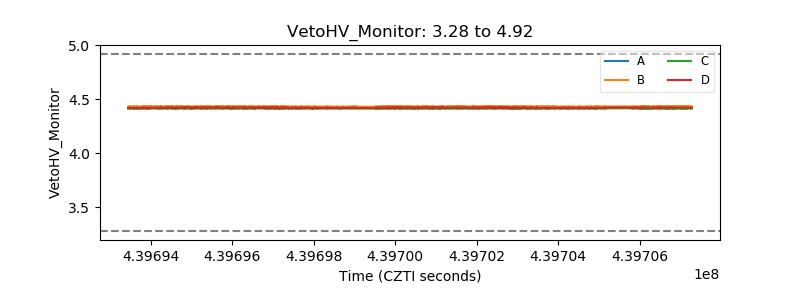 |
| Veto LLD | 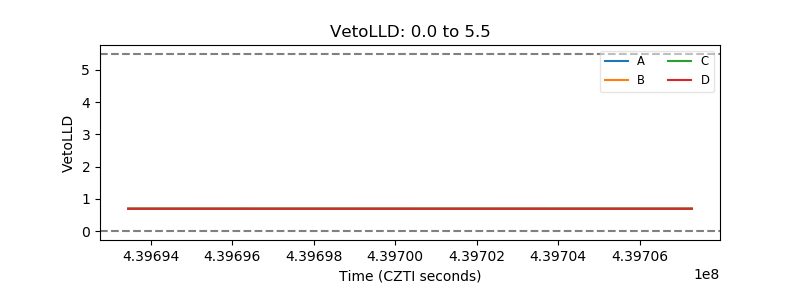 |
| Alpha Counter | 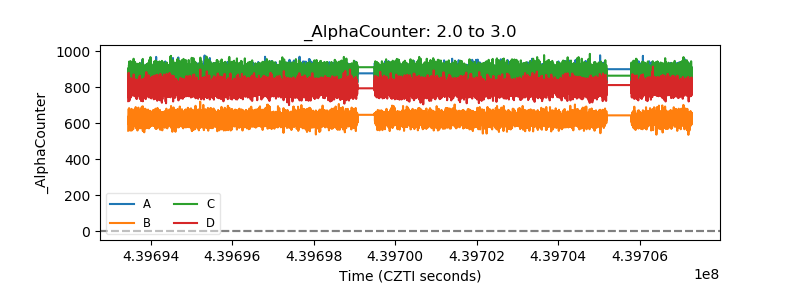 |
| _CPM_Rate | 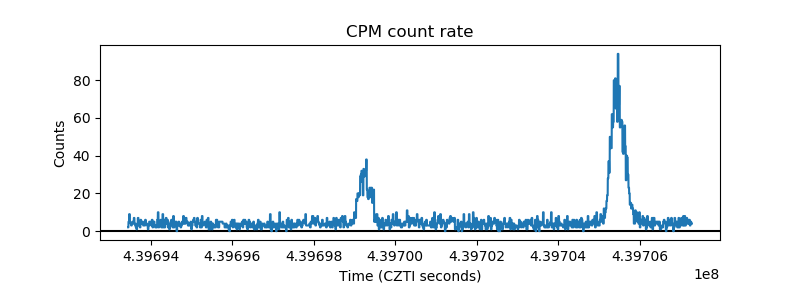 |
| CZT Counter | 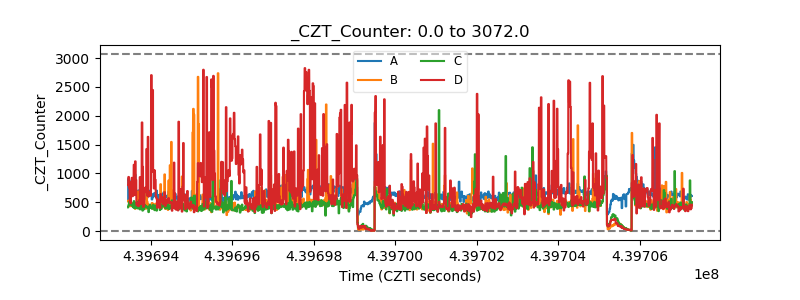 |
| +2.5 Volts monitor | 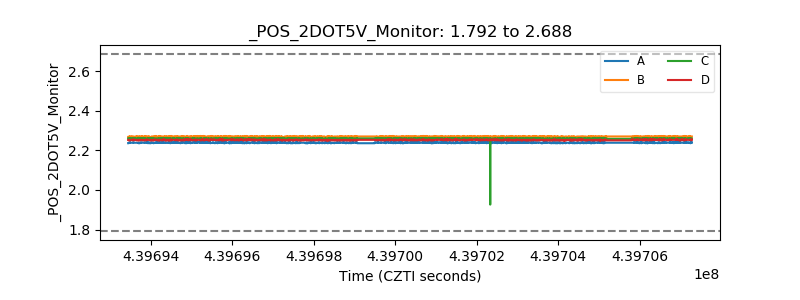 |
| +5 Volts monitor | 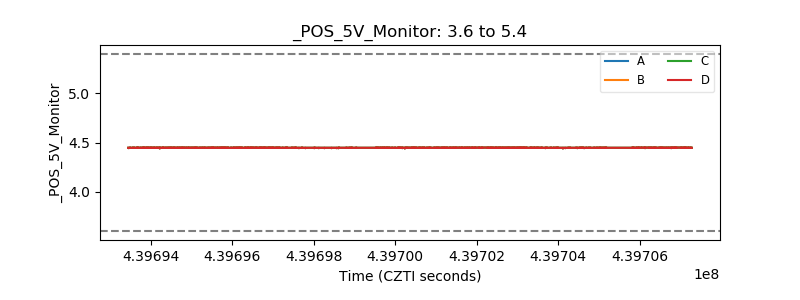 |
| _ROLL_ROT | 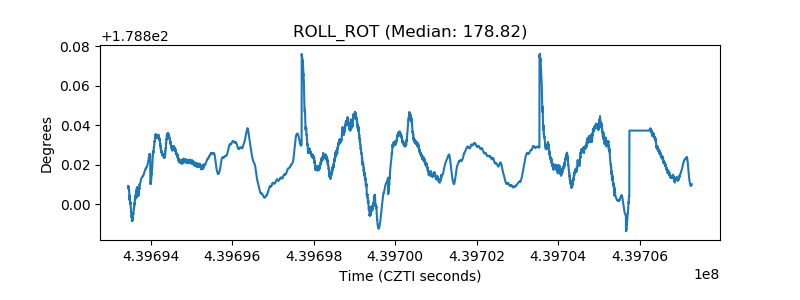 |
| _Roll_DEC | 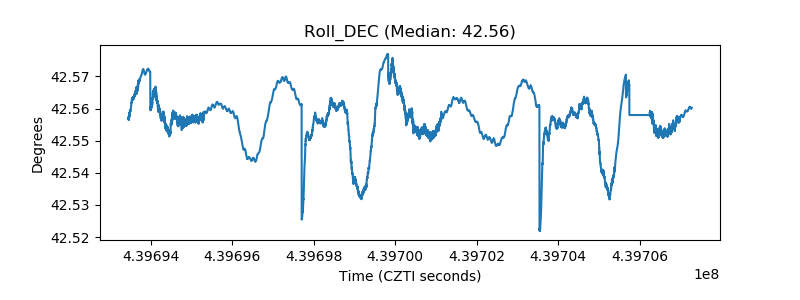 |
| _Roll_RA | 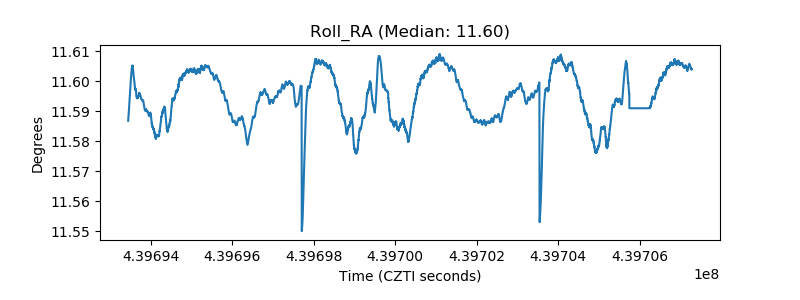 |
| Veto Counter | 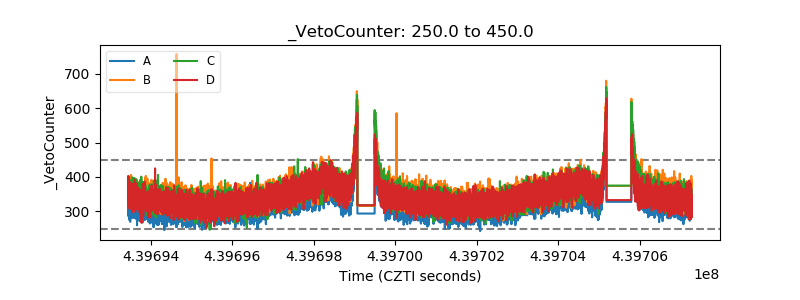 |