| Param | Original file | Final file |
|---|---|---|
| Filename | modeM0/AS1A13_004T13_9000005988_44309cztM0_level2.fits | modeM0/AS1A13_004T13_9000005988_44309cztM0_level2_quad_clean.evt |
| Size (bytes) | 506,707,200 | 124,064,640 |
| Size | 483.2 MB | 118.3 MB |
| Events in quadrant A | 5,407,779 | 821,150 |
| Events in quadrant B | 4,174,542 | 840,272 |
| Events in quadrant C | 3,886,690 | 808,177 |
| Events in quadrant D | 4,683,245 | 744,857 |
| Mode M0 | |||
|---|---|---|---|
| Quadrant | BADHDUFLAG | Total packets | Discarded packets |
| A | 0 | 22468 | 3 |
| B | 0 | 17642 | 3 |
| C | 0 | 17051 | 3 |
| D | 0 | 19434 | 3 |
| Mode SS | |||
|---|---|---|---|
| Quadrant | BADHDUFLAG | Total packets | Discarded packets |
| A | 0 | 162 | 0 |
| B | 0 | 162 | 0 |
| C | 0 | 162 | 0 |
| D | 0 | 162 | 0 |
| Mode M9 | |||
|---|---|---|---|
| Quadrant | BADHDUFLAG | Total packets | Discarded packets |
| A | 0 | 13 | 0 |
| B | 0 | 13 | 0 |
| C | 0 | 13 | 0 |
| D | 0 | 13 | 0 |
| Quadrant | Total seconds | Saturated seconds | Saturation percentage |
|---|---|---|---|
| A | 7783 | 170 | 2.184248% |
| B | 7783 | 190 | 2.441218% |
| C | 7783 | 163 | 2.094308% |
| D | 7783 | 255 | 3.276372% |
Noise dominated data is calculated using 1-second bins in cleaned event files. If a bin has >2000 counts, and if more than 50% of those come from <1% of pixels, then it is considered to be noise-dominated and hence unusable.
| Quadrant | # 1 sec bins | Bins with >0 counts | Bins with >2000 counts | High rate bins dominated by noise | Noise dominated (total time) | Noise dominated (detector-on time) | Marked lightcurve |
|---|---|---|---|---|---|---|---|
| A | 9173 | 7784 | 16 | 16 | 0.17% | 0.21% | 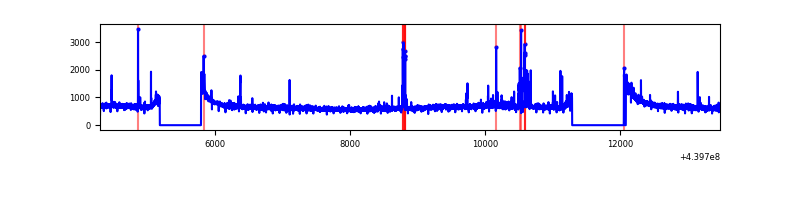 |
| B | 9173 | 7784 | 41 | 41 | 0.45% | 0.53% | 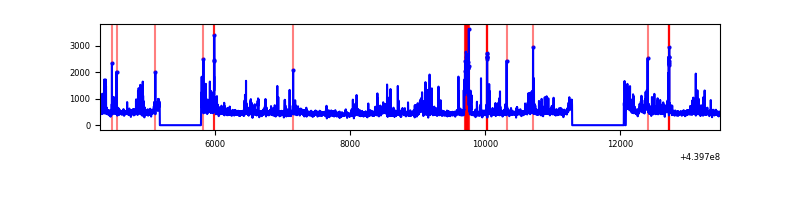 |
| C | 9173 | 7786 | 81 | 81 | 0.88% | 1.04% | 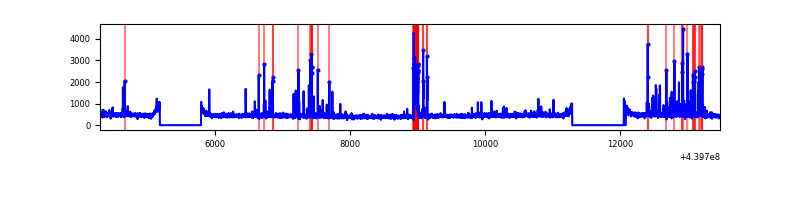 |
| D | 9173 | 7785 | 156 | 156 | 1.70% | 2.00% | 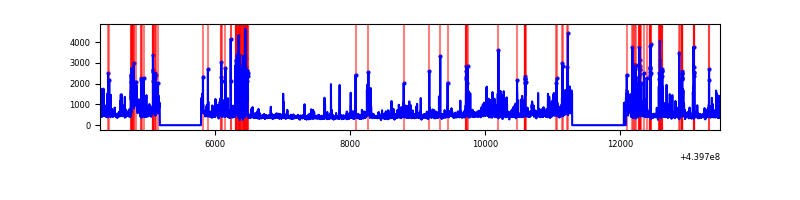 |
Top three noisy pixels from each quadrant. If the there are fewer than three noisy pixels in the level2.evt file, extra rows are filled as -1
| Pixel properties | Quadrant properties | ||||||
|---|---|---|---|---|---|---|---|
| Quadrant | DetID | PixID | Counts | Sigma | Mean | Median | Sigma |
| A | 10 | 83 | 1766546 | 9588.76 | 879 | 861 | 184.1 |
| A | 7 | 3 | 98759 | 531.65 | 879 | 861 | 184.1 |
| A | 10 | 248 | 62620 | 335.39 | 879 | 861 | 184.1 |
| B | 5 | 172 | 201120 | 1134.71 | 879 | 851 | 176.5 |
| B | 0 | 190 | 197451 | 1113.92 | 879 | 851 | 176.5 |
| B | 5 | 255 | 109720 | 616.84 | 879 | 851 | 176.5 |
| C | 14 | 254 | 465858 | 2273.04 | 865 | 869 | 204.6 |
| C | 3 | 233 | 32914 | 156.65 | 865 | 869 | 204.6 |
| C | 1 | 3 | 11208 | 50.54 | 865 | 869 | 204.6 |
| D | 13 | 249 | 405169 | 1862.87 | 863 | 836 | 217.0 |
| D | 13 | 171 | 320814 | 1474.22 | 863 | 836 | 217.0 |
| D | 13 | 138 | 177045 | 811.84 | 863 | 836 | 217.0 |
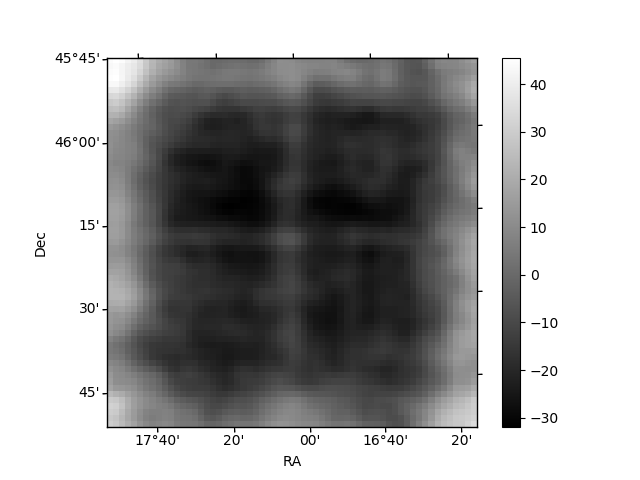
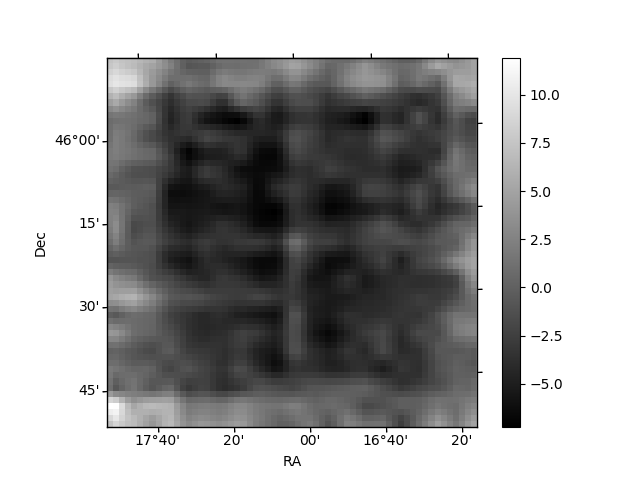
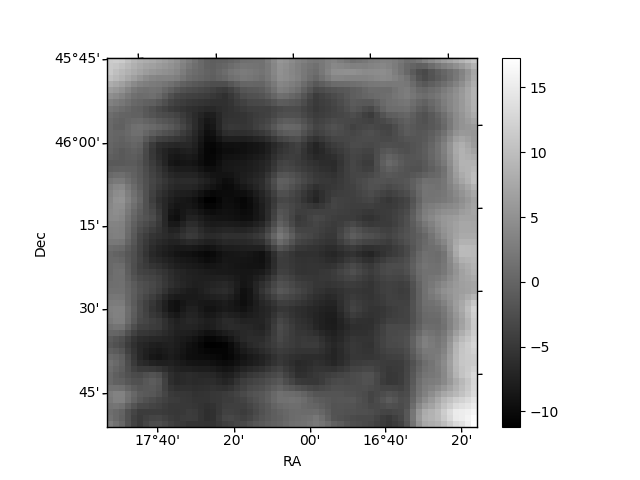
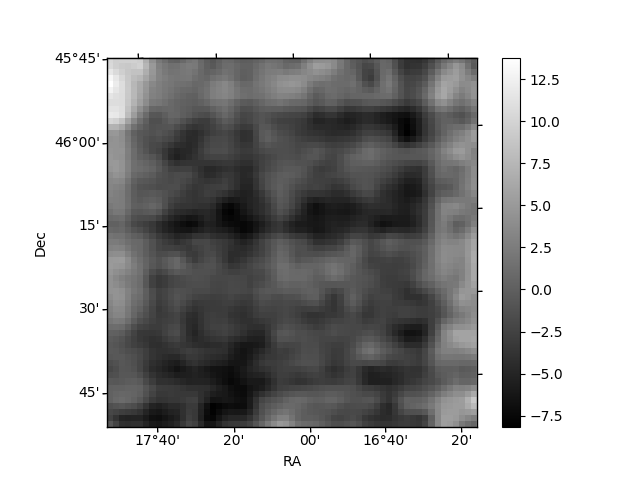
Histogram calculated using DETX and DETY for each event in the final _common_clean file
| Quadrant A | 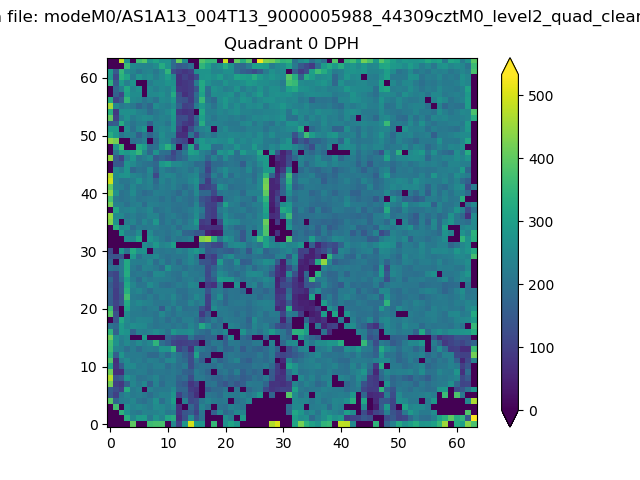 |
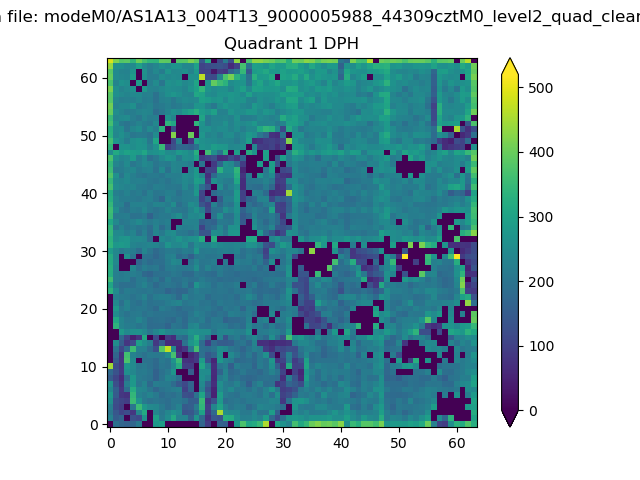 |
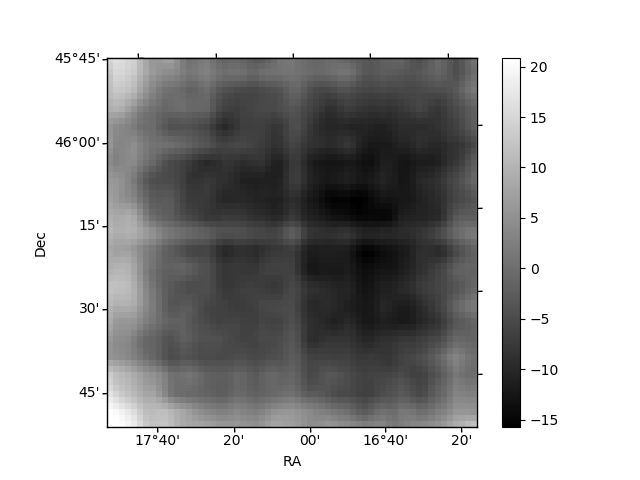
Quadrant B |
|---|---|---|---|
| Quadrant D | 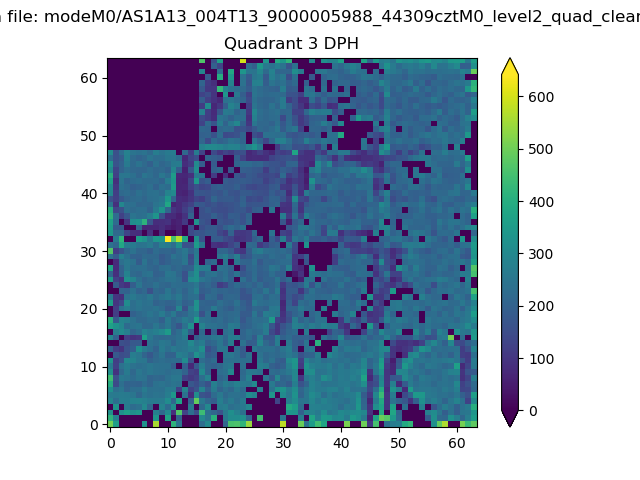 |
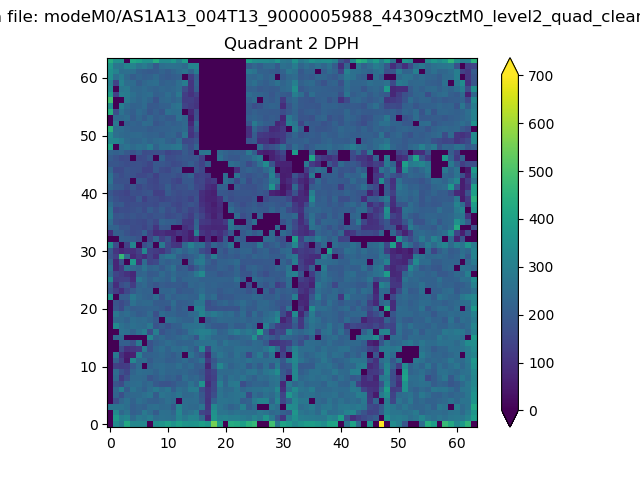 |
Quadrant C |
| Plot type | Count rate plots | Images |
|---|---|---|
| Comparison with Poisson distribution Blue bars denote a histogram of data divided into 1 sec bins. Red curve is a Poisson curve with rate = median count rate of data. |
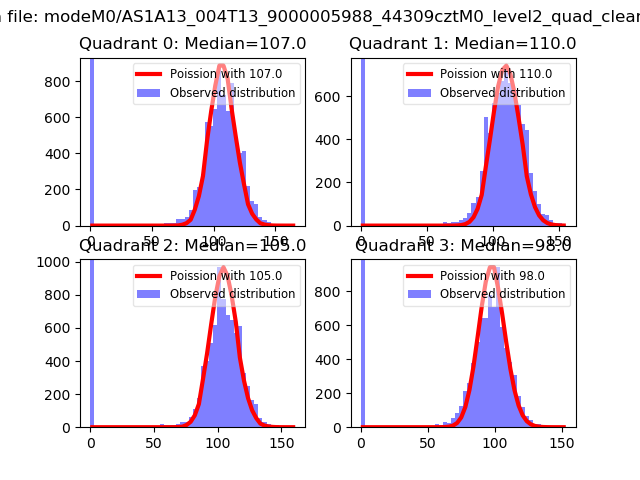 |
 |
| Quadrant-wise count rates Data is divided into 100 sec bins |
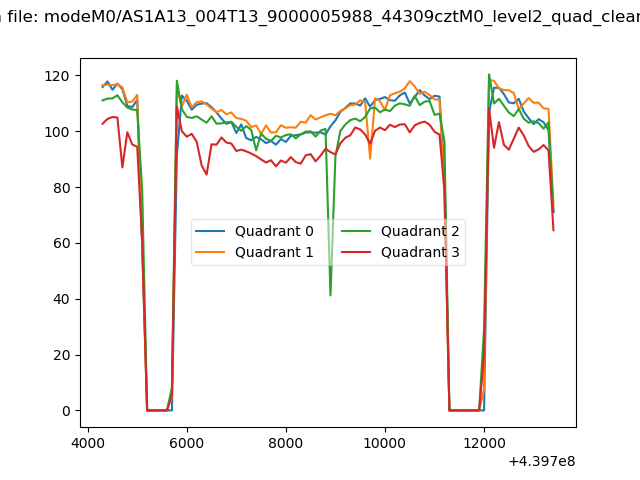 |
|
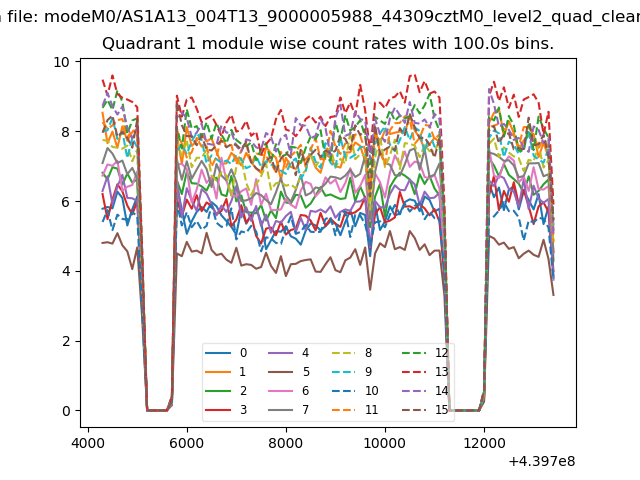
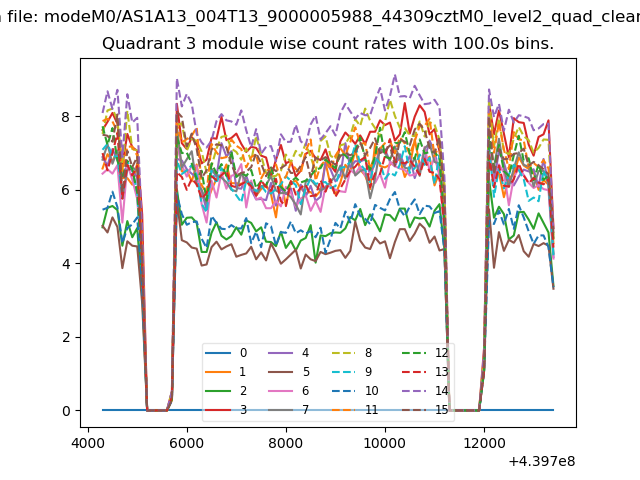
| Module-wise count rates for Quadrant A Data is divided into 100 sec bins |
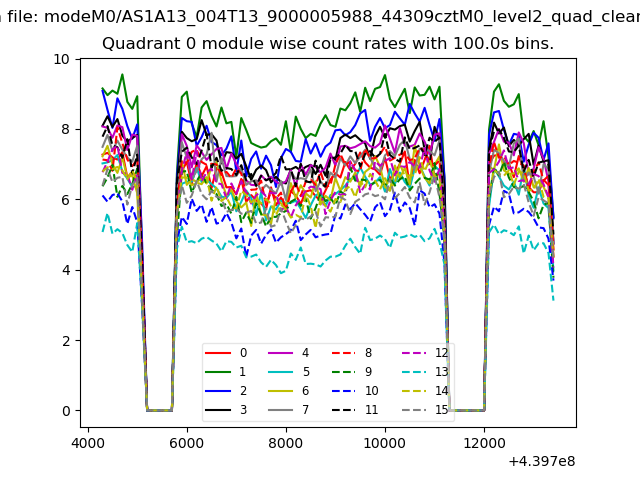 |
 |
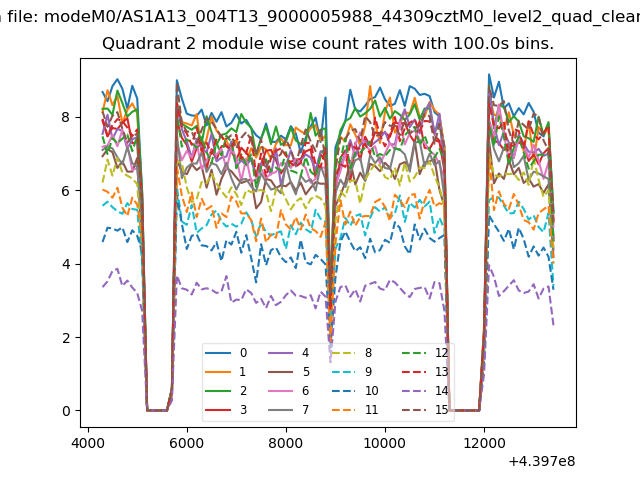
| Module-wise count rates for Quadrant B Data is divided into 100 sec bins |
 |
 |
| Module-wise count rates for Quadrant C Data is divided into 100 sec bins |
 |
 |
| Module-wise count rates for Quadrant D Data is divided into 100 sec bins |
 |
 |
| Parameter | Plot |
|---|---|
| CZT HV Monitor | 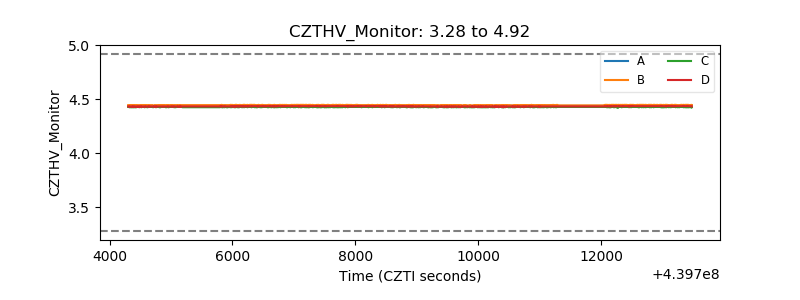 |
| D_VDD | 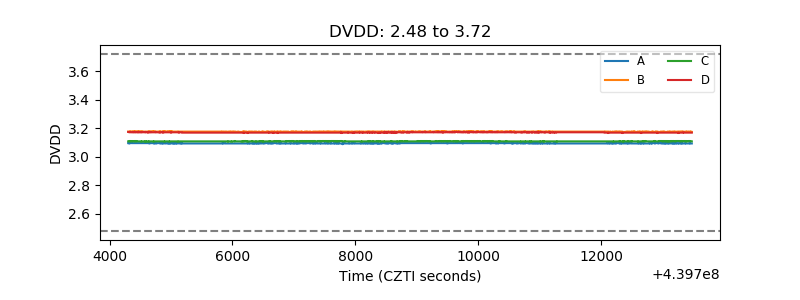 |
| Temperature 1 | 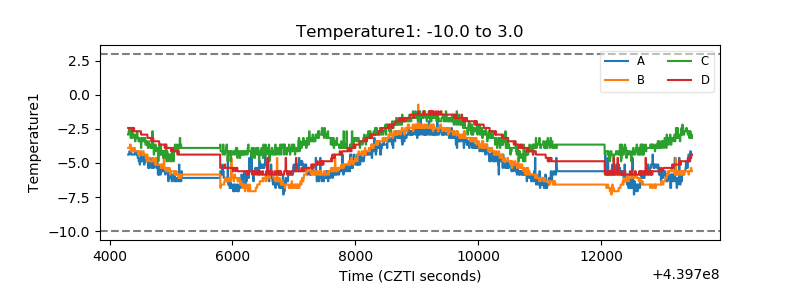 |
| Veto HV Monitor | 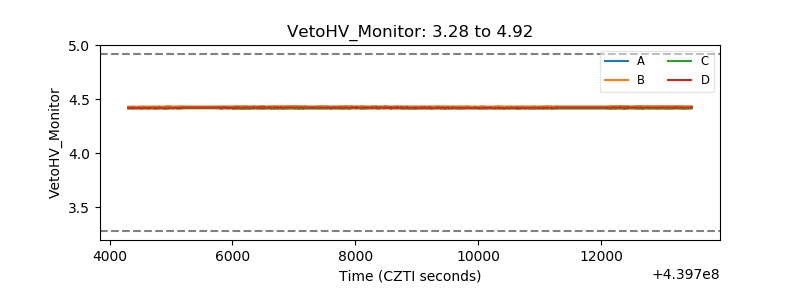 |
| Veto LLD | 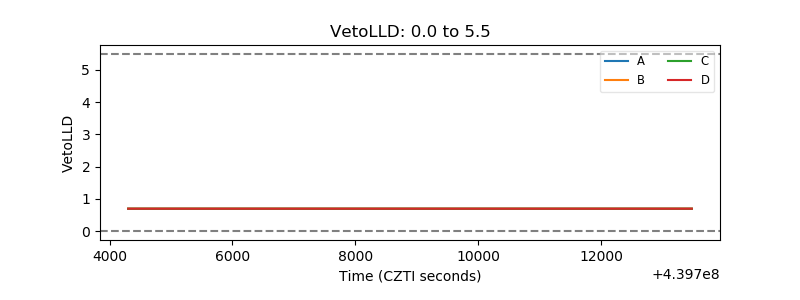 |
| Alpha Counter | 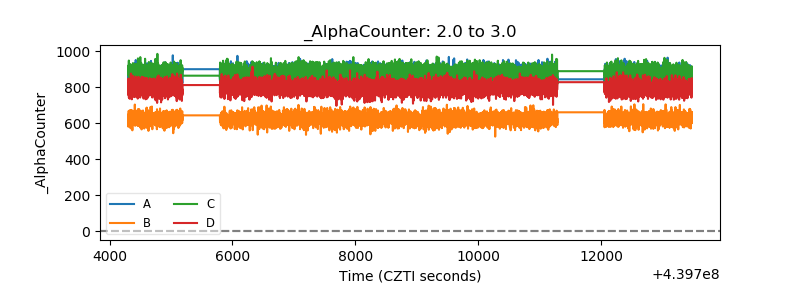 |
| _CPM_Rate | 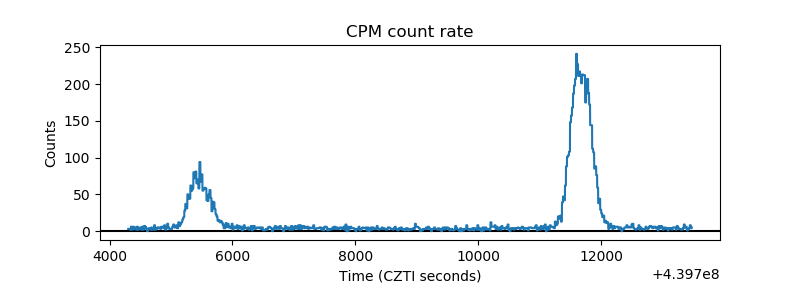 |
| CZT Counter | 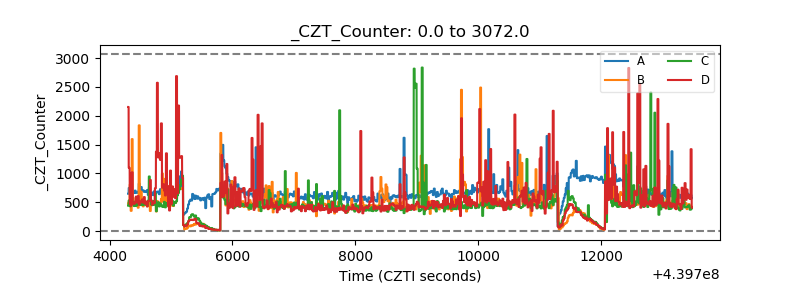 |
| +2.5 Volts monitor | 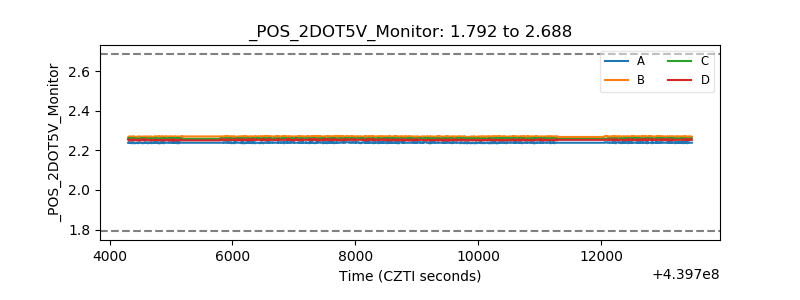 |
| +5 Volts monitor | 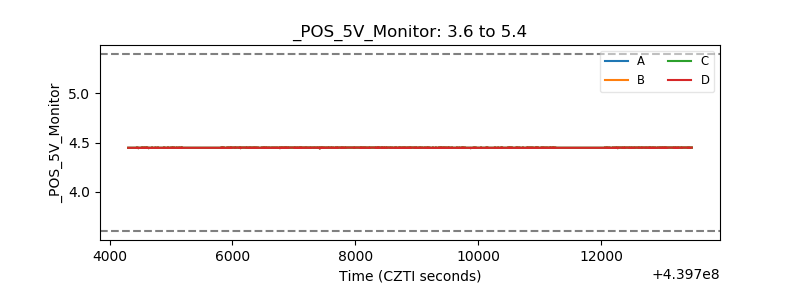 |
| _ROLL_ROT | 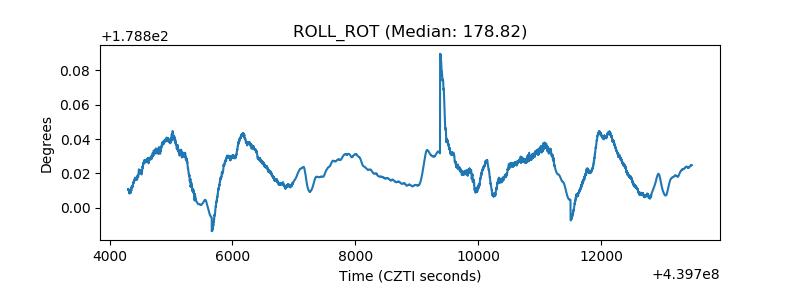 |
| _Roll_DEC | 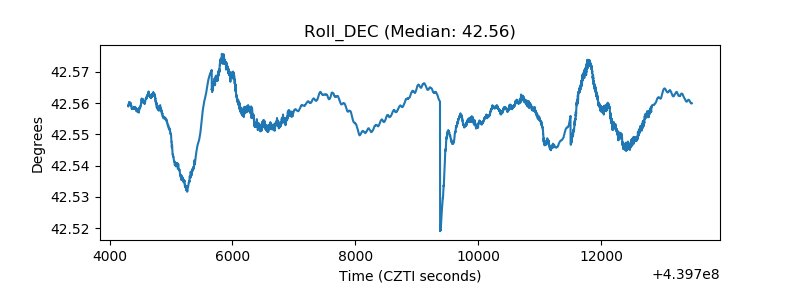 |
| _Roll_RA | 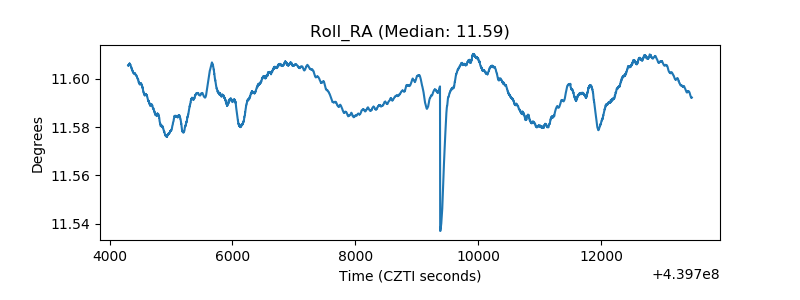 |
| Veto Counter | 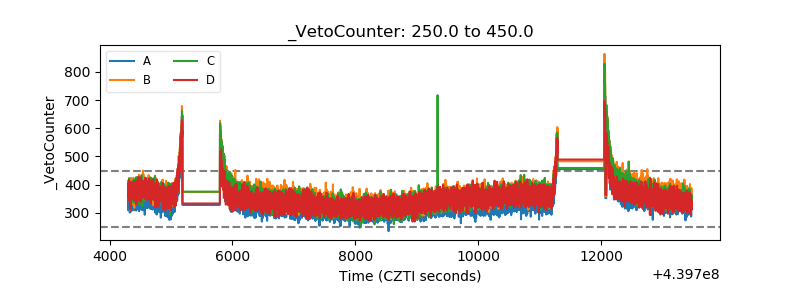 |