| Param | Original file | Final file |
|---|---|---|
| Filename | modeM0/AS1A13_004T13_9000005988_44310cztM0_level2.fits | modeM0/AS1A13_004T13_9000005988_44310cztM0_level2_quad_clean.evt |
| Size (bytes) | 495,040,320 | 117,354,240 |
| Size | 472.1 MB | 111.9 MB |
| Events in quadrant A | 5,572,554 | 770,865 |
| Events in quadrant B | 3,968,169 | 800,385 |
| Events in quadrant C | 3,515,680 | 775,366 |
| Events in quadrant D | 4,703,091 | 700,052 |
| Mode M0 | |||
|---|---|---|---|
| Quadrant | BADHDUFLAG | Total packets | Discarded packets |
| A | 0 | 22538 | 3 |
| B | 0 | 16630 | 3 |
| C | 0 | 15608 | 3 |
| D | 0 | 18930 | 3 |
| Mode SS | |||
|---|---|---|---|
| Quadrant | BADHDUFLAG | Total packets | Discarded packets |
| A | 0 | 148 | 0 |
| B | 0 | 148 | 0 |
| C | 0 | 148 | 0 |
| D | 0 | 148 | 0 |
| Mode M9 | |||
|---|---|---|---|
| Quadrant | BADHDUFLAG | Total packets | Discarded packets |
| A | 0 | 17 | 0 |
| B | 0 | 17 | 0 |
| C | 0 | 17 | 0 |
| D | 0 | 17 | 0 |
| Quadrant | Total seconds | Saturated seconds | Saturation percentage |
|---|---|---|---|
| A | 7281 | 272 | 3.735751% |
| B | 7282 | 190 | 2.609173% |
| C | 7282 | 96 | 1.318319% |
| D | 7282 | 249 | 3.419390% |
Noise dominated data is calculated using 1-second bins in cleaned event files. If a bin has >2000 counts, and if more than 50% of those come from <1% of pixels, then it is considered to be noise-dominated and hence unusable.
| Quadrant | # 1 sec bins | Bins with >0 counts | Bins with >2000 counts | High rate bins dominated by noise | Noise dominated (total time) | Noise dominated (detector-on time) | Marked lightcurve |
|---|---|---|---|---|---|---|---|
| A | 8996 | 7281 | 49 | 49 | 0.54% | 0.67% | 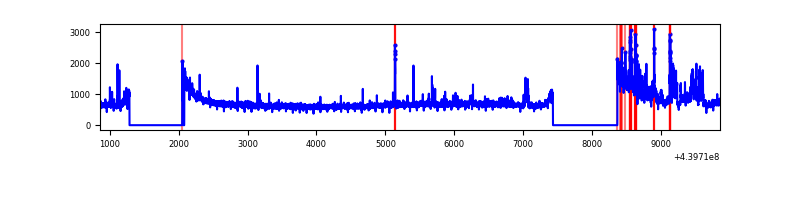 |
| B | 8997 | 7284 | 41 | 41 | 0.46% | 0.56% | 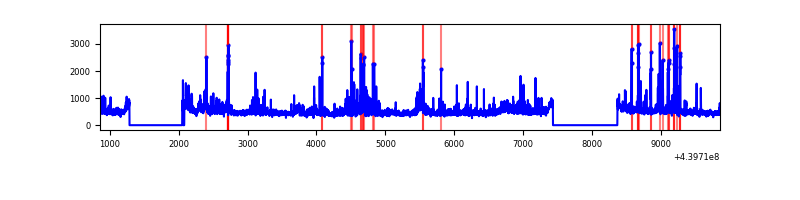 |
| C | 8997 | 7285 | 37 | 37 | 0.41% | 0.51% | 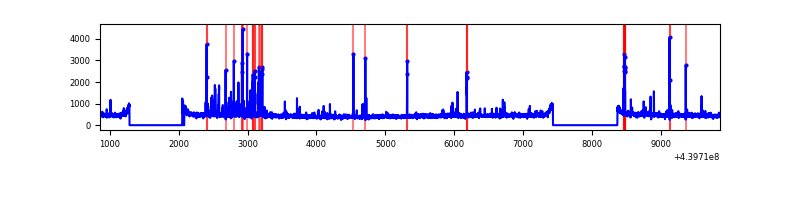 |
| D | 8997 | 7284 | 139 | 139 | 1.54% | 1.91% | 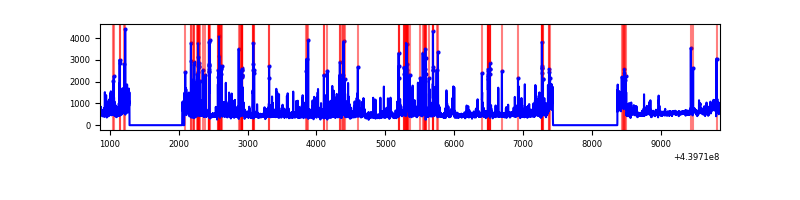 |
Top three noisy pixels from each quadrant. If the there are fewer than three noisy pixels in the level2.evt file, extra rows are filled as -1
| Pixel properties | Quadrant properties | ||||||
|---|---|---|---|---|---|---|---|
| Quadrant | DetID | PixID | Counts | Sigma | Mean | Median | Sigma |
| A | 10 | 83 | 1704374 | 9867.77 | 828 | 811 | 172.6 |
| A | 15 | 223 | 565894 | 3273.2 | 828 | 811 | 172.6 |
| A | 7 | 3 | 32996 | 186.43 | 828 | 811 | 172.6 |
| B | 5 | 255 | 215206 | 1301.72 | 829 | 803 | 164.7 |
| B | 0 | 155 | 112291 | 676.89 | 829 | 803 | 164.7 |
| B | 0 | 190 | 100131 | 603.06 | 829 | 803 | 164.7 |
| C | 14 | 254 | 230520 | 1191.65 | 818 | 824 | 192.8 |
| C | 1 | 16 | 27670 | 139.27 | 818 | 824 | 192.8 |
| C | 15 | 208 | 23787 | 119.13 | 818 | 824 | 192.8 |
| D | 5 | 222 | 469116 | 2305.78 | 809 | 785 | 203.1 |
| D | 13 | 249 | 208946 | 1024.86 | 809 | 785 | 203.1 |
| D | 1 | 20 | 204424 | 1002.6 | 809 | 785 | 203.1 |
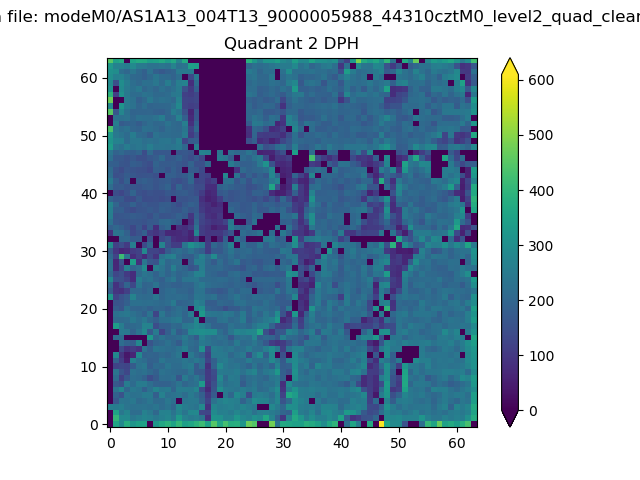
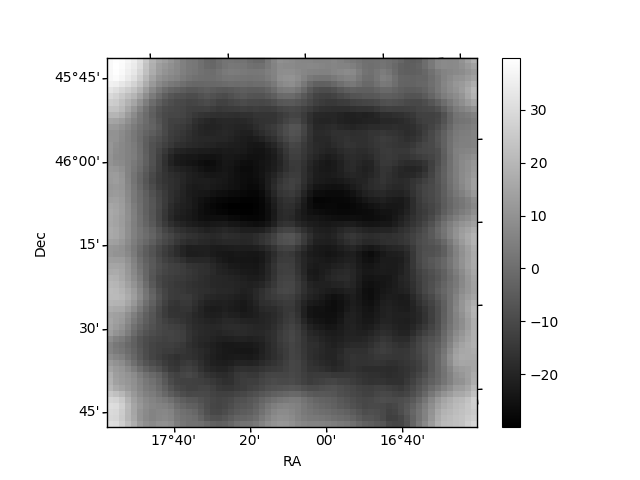
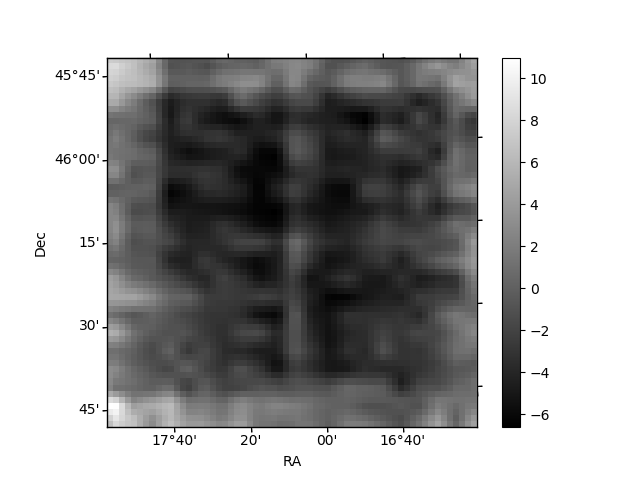
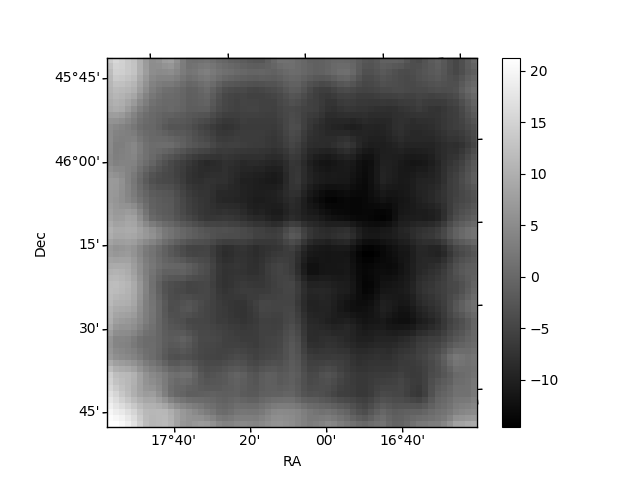
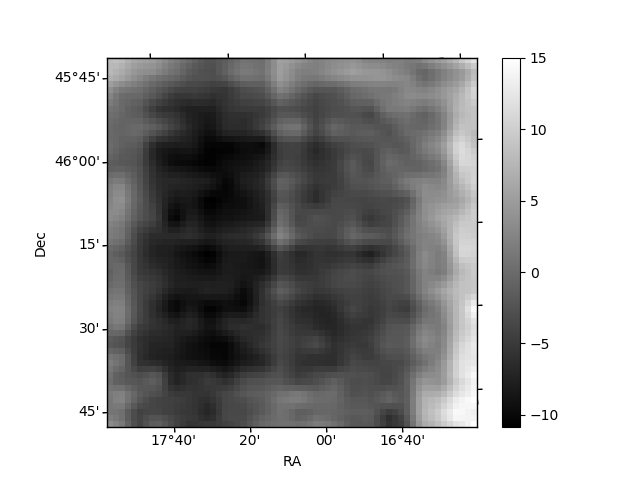
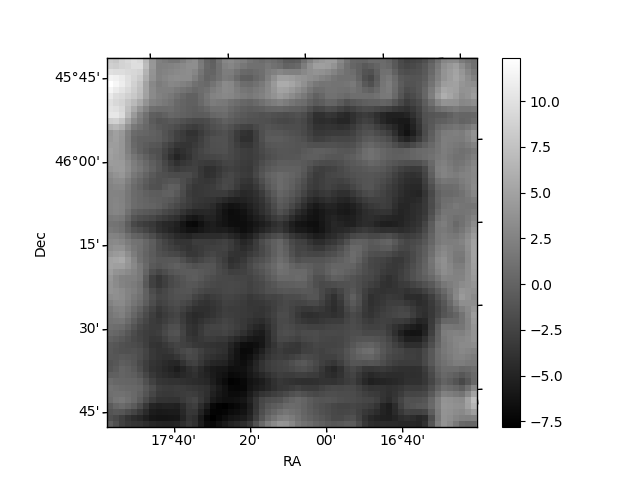
Histogram calculated using DETX and DETY for each event in the final _common_clean file
| Quadrant A | 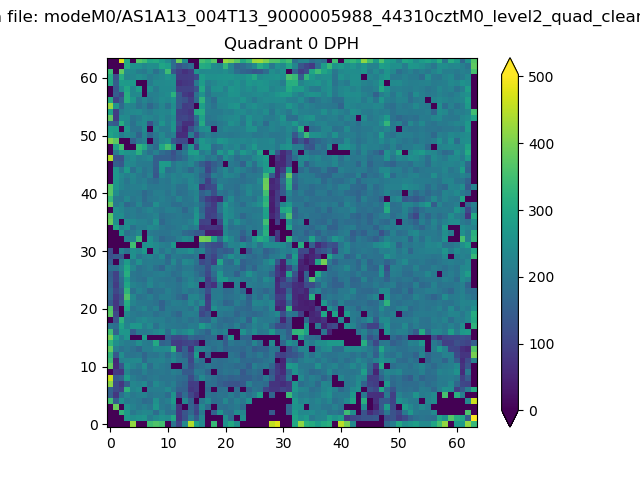 |
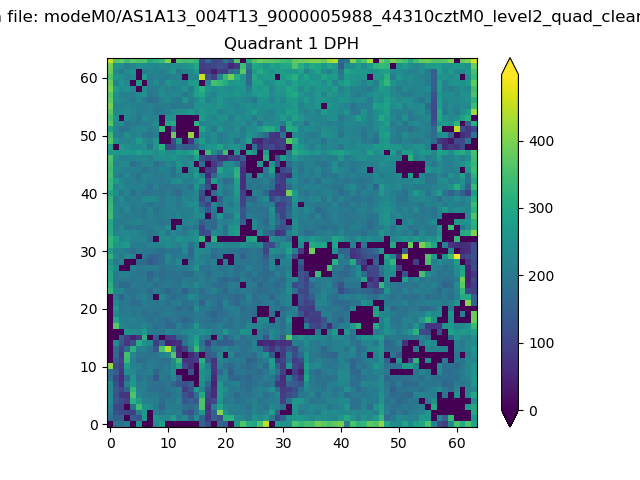 |
Quadrant B |
|---|---|---|---|
| Quadrant D | 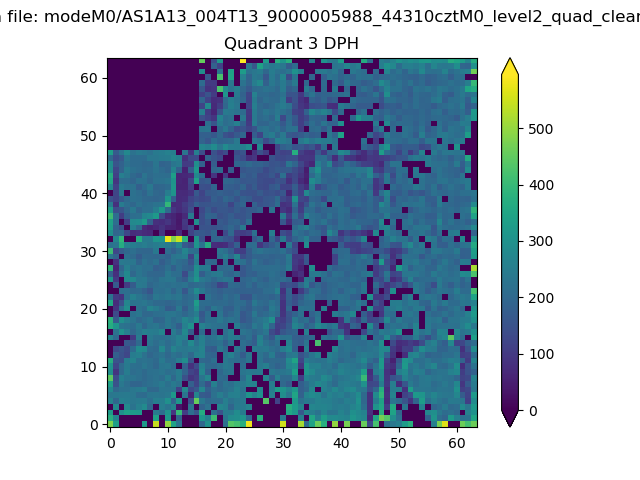 |
 |
Quadrant C |
| Plot type | Count rate plots | Images |
|---|---|---|
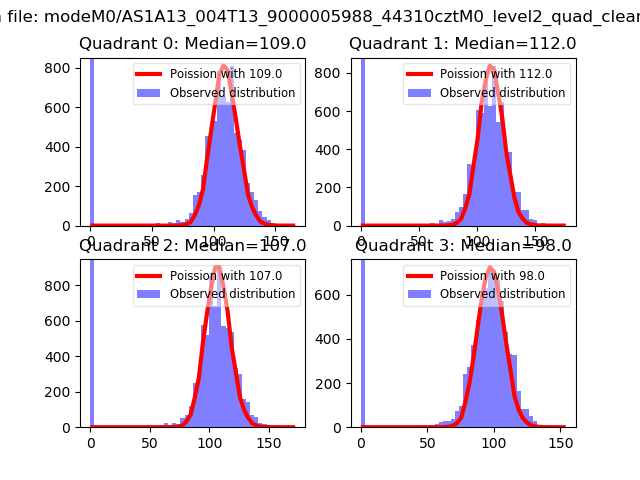
| Comparison with Poisson distribution Blue bars denote a histogram of data divided into 1 sec bins. Red curve is a Poisson curve with rate = median count rate of data. |
 |
 |
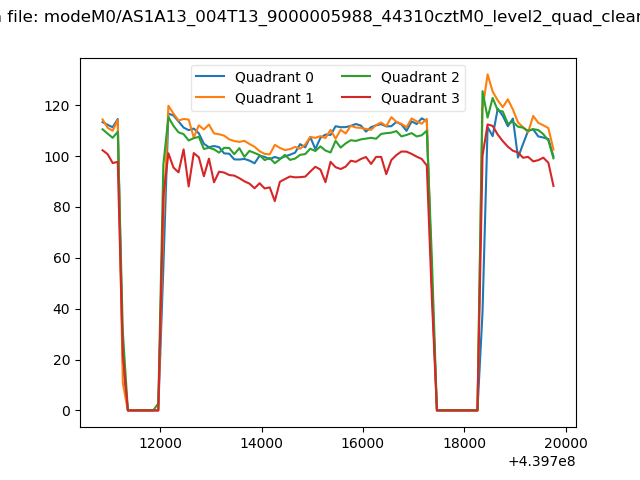
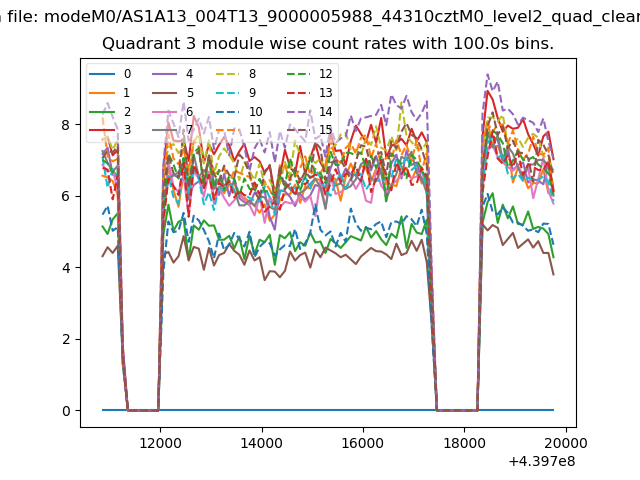
| Quadrant-wise count rates Data is divided into 100 sec bins |
 |
|
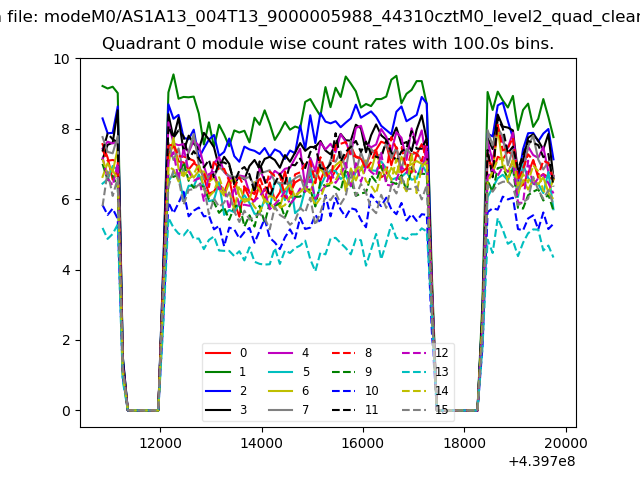
| Module-wise count rates for Quadrant A Data is divided into 100 sec bins |
 |
 |
| Module-wise count rates for Quadrant B Data is divided into 100 sec bins |
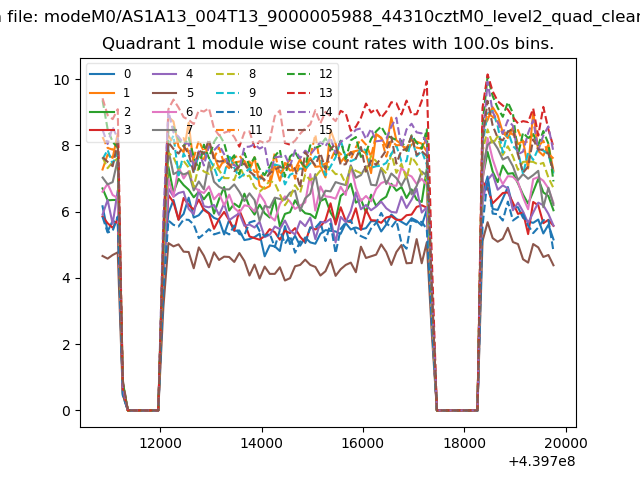 |
 |
| Module-wise count rates for Quadrant C Data is divided into 100 sec bins |
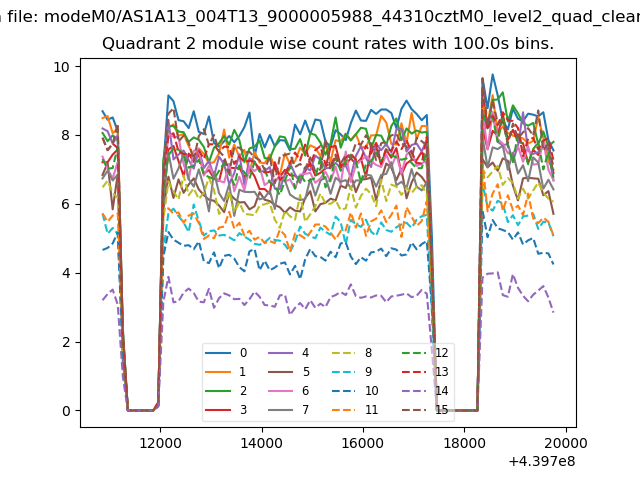 |
 |
| Module-wise count rates for Quadrant D Data is divided into 100 sec bins |
 |
 |
| Parameter | Plot |
|---|---|
| CZT HV Monitor | 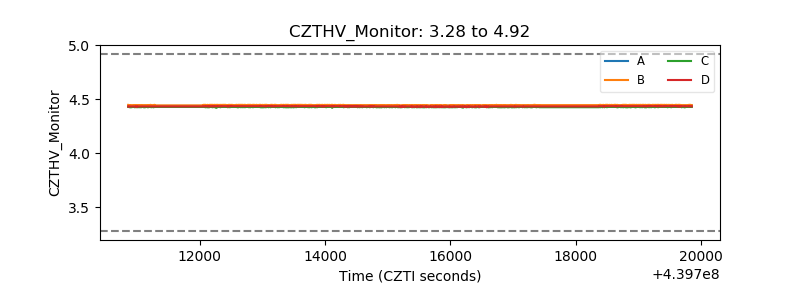 |
| D_VDD | 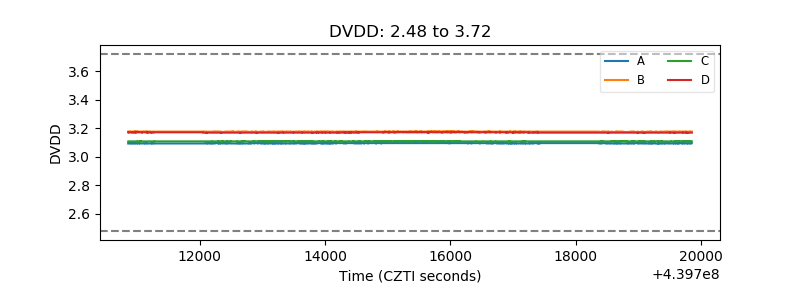 |
| Temperature 1 | 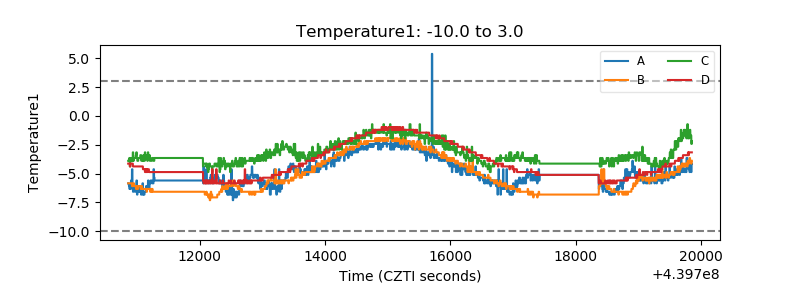 |
| Veto HV Monitor | 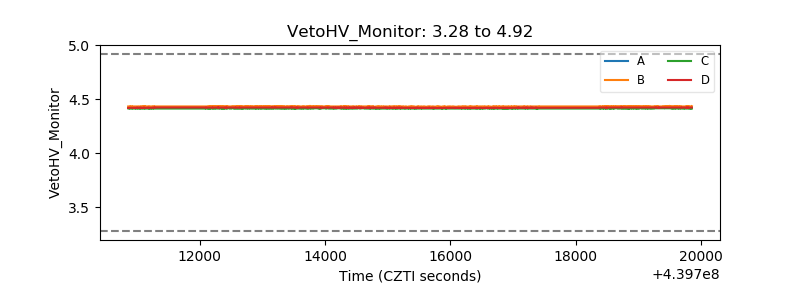 |
| Veto LLD | 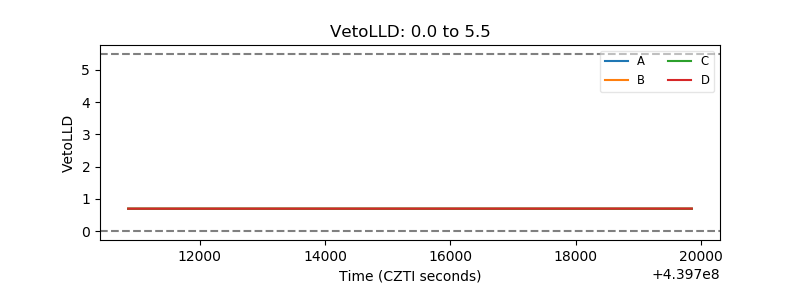 |
| Alpha Counter | 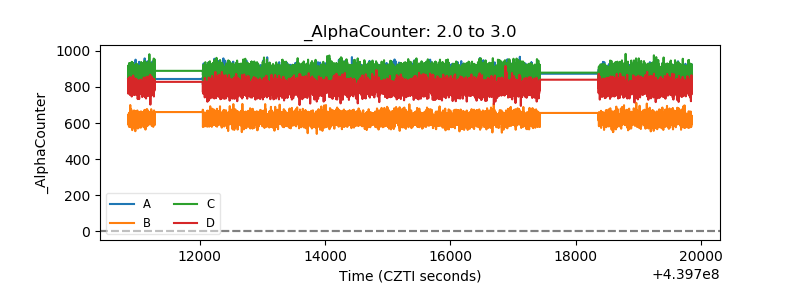 |
| _CPM_Rate | 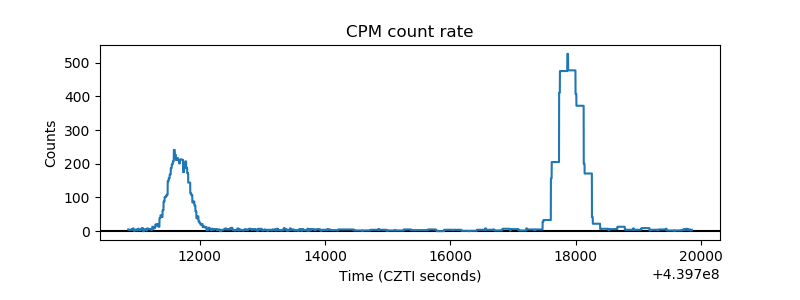 |
| CZT Counter |  |
| +2.5 Volts monitor | 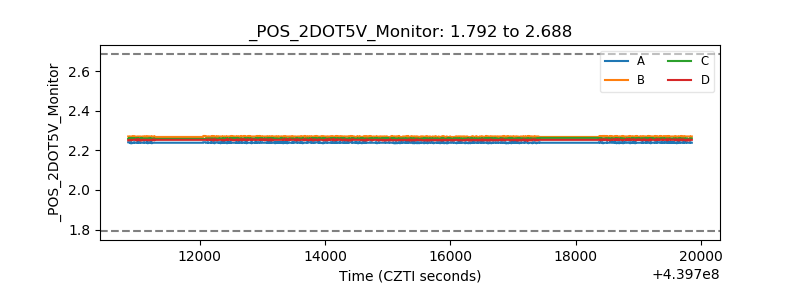 |
| +5 Volts monitor | 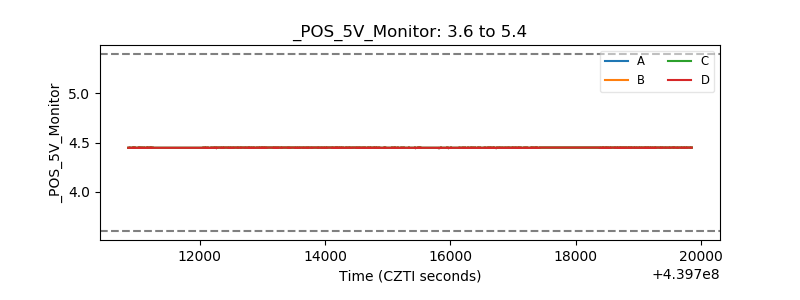 |
| _ROLL_ROT | 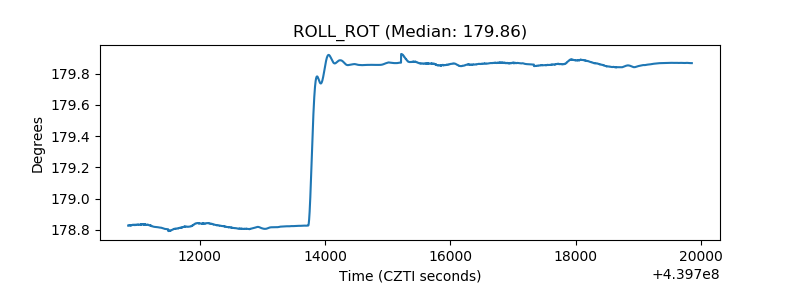 |
| _Roll_DEC | 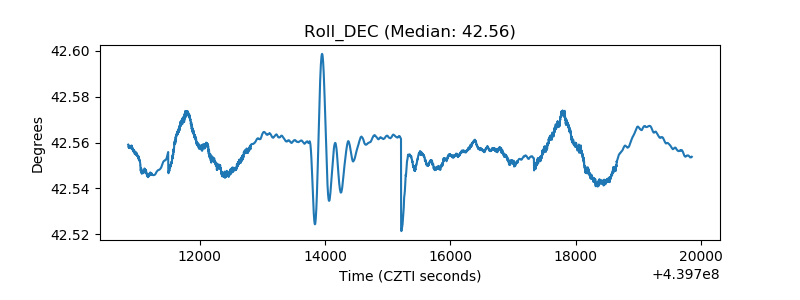 |
| _Roll_RA | 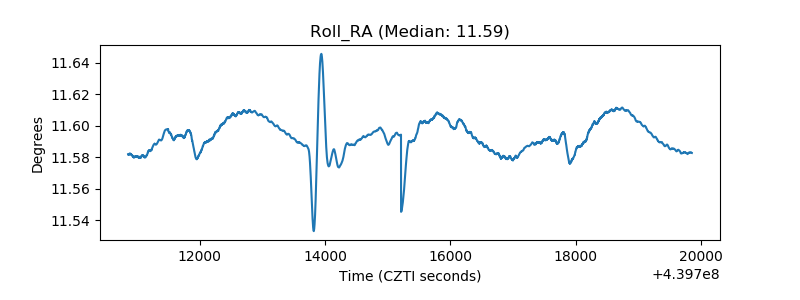 |
| Veto Counter | 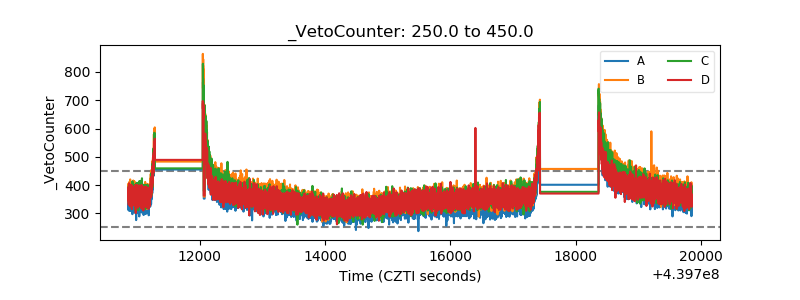 |