| Param | Original file | Final file |
|---|---|---|
| Filename | modeM0/AS1A13_004T13_9000005988_44312cztM0_level2.fits | modeM0/AS1A13_004T13_9000005988_44312cztM0_level2_quad_clean.evt |
| Size (bytes) | 498,147,840 | 111,473,280 |
| Size | 475.1 MB | 106.3 MB |
| Events in quadrant A | 6,166,918 | 730,412 |
| Events in quadrant B | 3,831,774 | 768,100 |
| Events in quadrant C | 3,235,822 | 740,918 |
| Events in quadrant D | 4,684,831 | 668,338 |
| Mode M0 | |||
|---|---|---|---|
| Quadrant | BADHDUFLAG | Total packets | Discarded packets |
| A | 0 | 23555 | 2 |
| B | 0 | 15718 | 2 |
| C | 0 | 14284 | 2 |
| D | 0 | 18359 | 3 |
| Mode SS | |||
|---|---|---|---|
| Quadrant | BADHDUFLAG | Total packets | Discarded packets |
| A | 0 | 138 | 0 |
| B | 0 | 138 | 0 |
| C | 0 | 138 | 0 |
| D | 0 | 138 | 0 |
| Mode M9 | |||
|---|---|---|---|
| Quadrant | BADHDUFLAG | Total packets | Discarded packets |
| A | 0 | 20 | 0 |
| B | 0 | 20 | 0 |
| C | 0 | 20 | 0 |
| D | 0 | 20 | 0 |
| Quadrant | Total seconds | Saturated seconds | Saturation percentage |
|---|---|---|---|
| A | 6708 | 420 | 6.261181% |
| B | 6708 | 217 | 3.234943% |
| C | 6708 | 108 | 1.610018% |
| D | 6707 | 299 | 4.458029% |
Noise dominated data is calculated using 1-second bins in cleaned event files. If a bin has >2000 counts, and if more than 50% of those come from <1% of pixels, then it is considered to be noise-dominated and hence unusable.
| Quadrant | # 1 sec bins | Bins with >0 counts | Bins with >2000 counts | High rate bins dominated by noise | Noise dominated (total time) | Noise dominated (detector-on time) | Marked lightcurve |
|---|---|---|---|---|---|---|---|
| A | 8678 | 6708 | 133 | 133 | 1.53% | 1.98% | 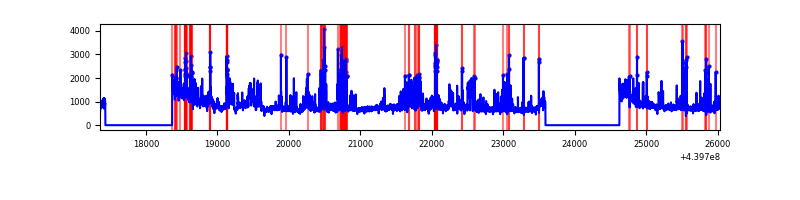 |
| B | 8678 | 6709 | 46 | 46 | 0.53% | 0.69% | 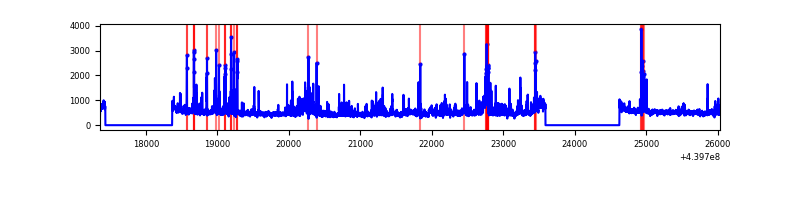 |
| C | 8678 | 6709 | 22 | 22 | 0.25% | 0.33% | 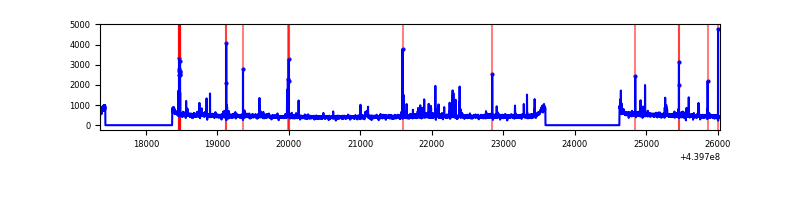 |
| D | 8677 | 6708 | 172 | 172 | 1.98% | 2.56% | 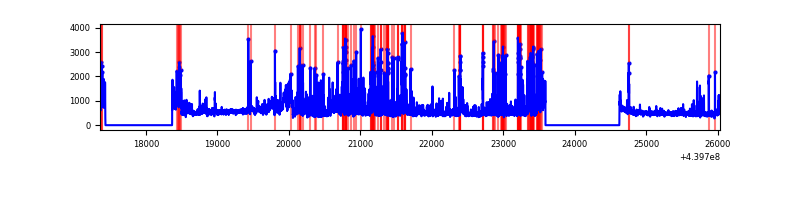 |
Top three noisy pixels from each quadrant. If the there are fewer than three noisy pixels in the level2.evt file, extra rows are filled as -1
| Pixel properties | Quadrant properties | ||||||
|---|---|---|---|---|---|---|---|
| Quadrant | DetID | PixID | Counts | Sigma | Mean | Median | Sigma |
| A | 10 | 83 | 1628651 | 10067.9 | 781 | 766 | 161.7 |
| A | 15 | 223 | 1477442 | 9132.73 | 781 | 766 | 161.7 |
| A | 10 | 248 | 15028 | 88.21 | 781 | 766 | 161.7 |
| B | 5 | 255 | 195384 | 1244.64 | 783 | 758 | 156.4 |
| B | 0 | 190 | 172693 | 1099.53 | 783 | 758 | 156.4 |
| B | 5 | 235 | 119966 | 762.34 | 783 | 758 | 156.4 |
| C | 14 | 254 | 139720 | 770.72 | 770 | 774 | 180.3 |
| C | 1 | 16 | 28351 | 152.97 | 770 | 774 | 180.3 |
| C | 1 | 3 | 25207 | 135.53 | 770 | 774 | 180.3 |
| D | 13 | 249 | 751721 | 3914.59 | 765 | 741 | 191.8 |
| D | 1 | 20 | 412112 | 2144.33 | 765 | 741 | 191.8 |
| D | 5 | 222 | 89402 | 462.16 | 765 | 741 | 191.8 |
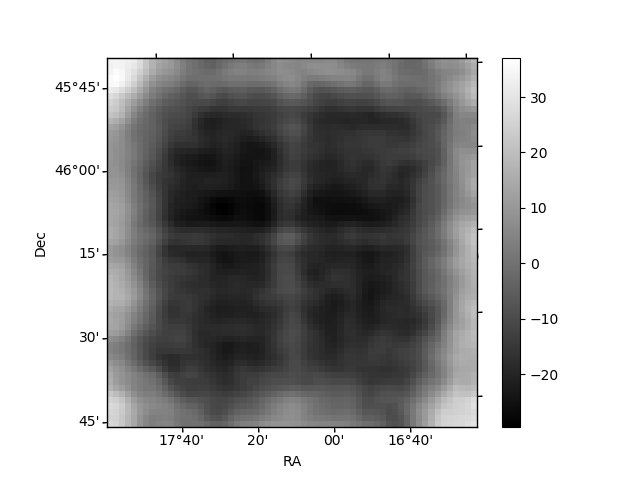
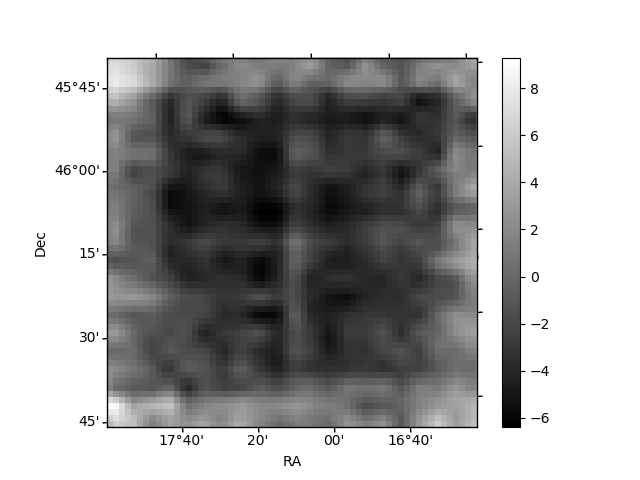
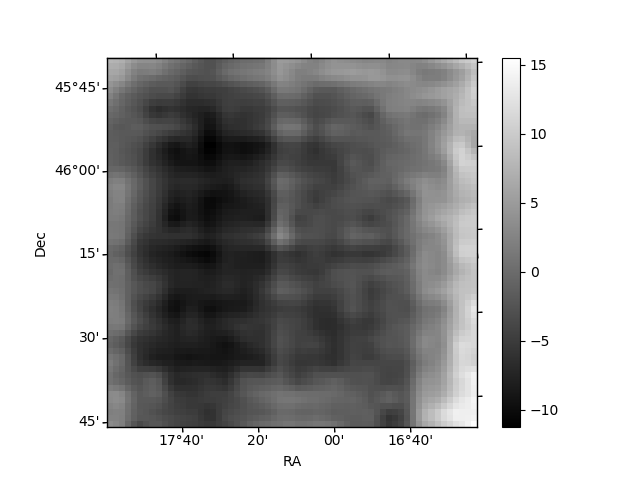
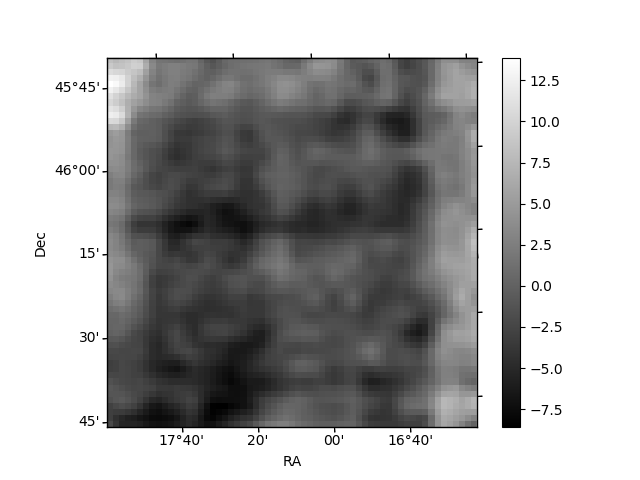
Histogram calculated using DETX and DETY for each event in the final _common_clean file
| Quadrant A | 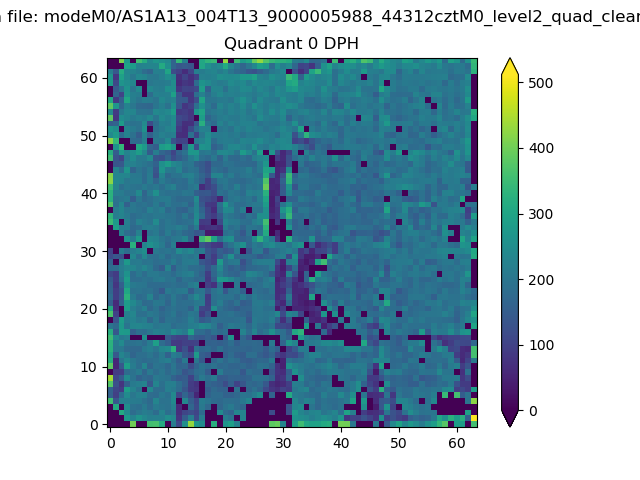 |
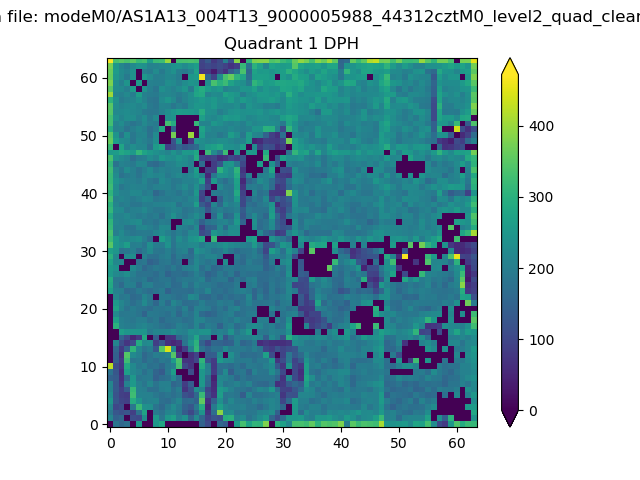 |
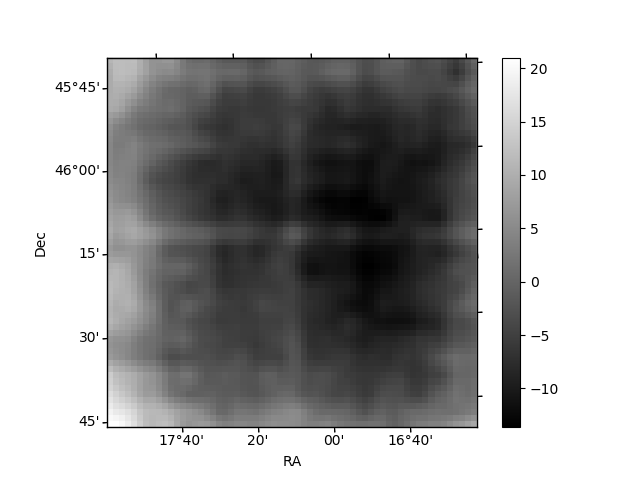
Quadrant B |
|---|---|---|---|
| Quadrant D | 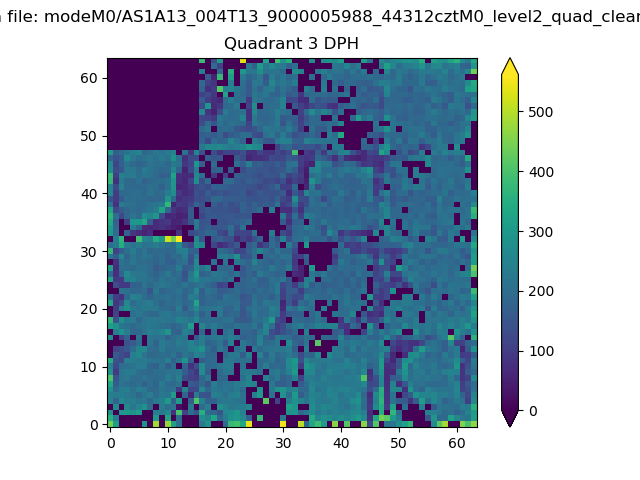 |
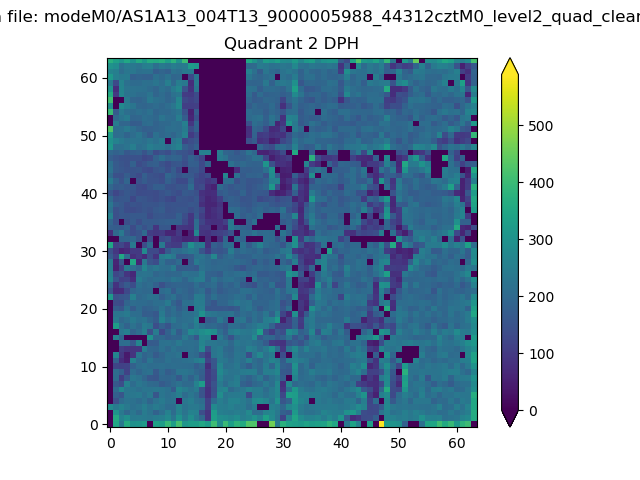 |
Quadrant C |
| Plot type | Count rate plots | Images |
|---|---|---|
| Comparison with Poisson distribution Blue bars denote a histogram of data divided into 1 sec bins. Red curve is a Poisson curve with rate = median count rate of data. |
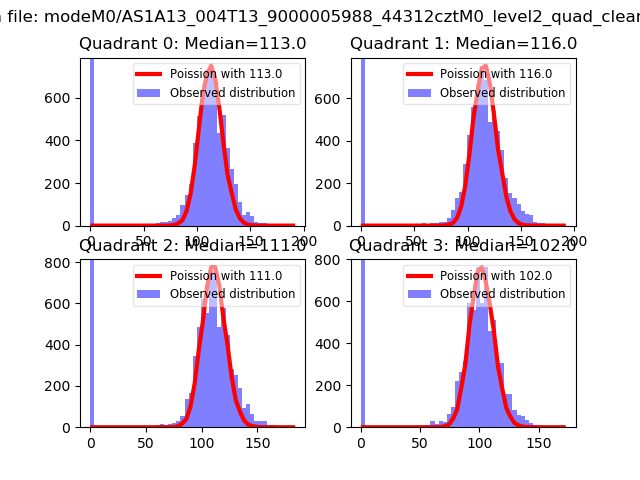 |
 |
| Quadrant-wise count rates Data is divided into 100 sec bins |
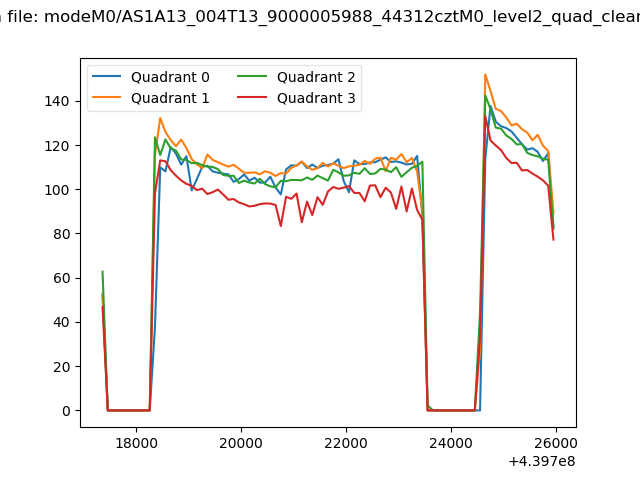 |
|
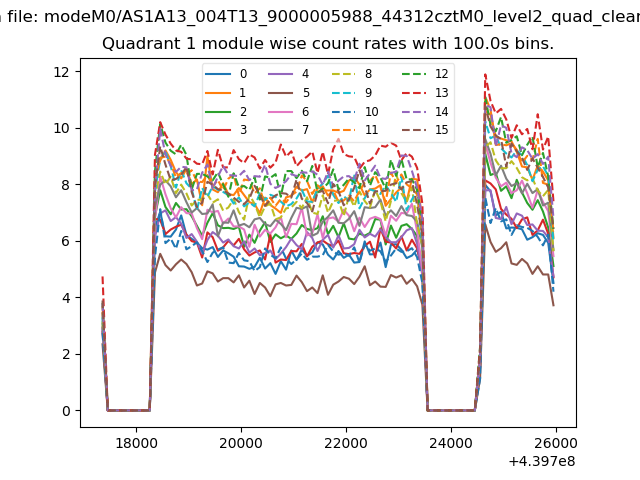
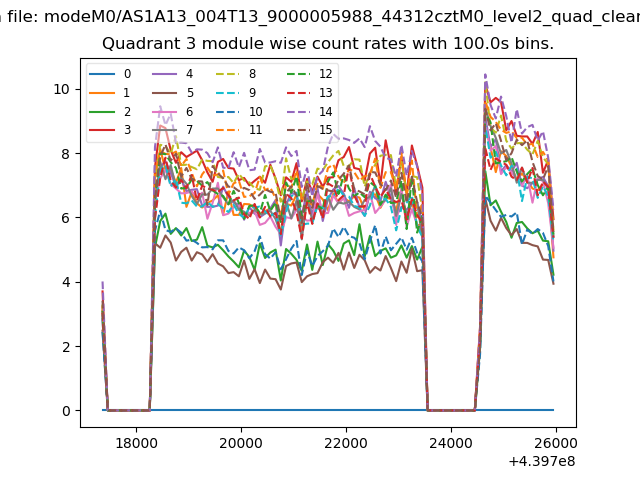
| Module-wise count rates for Quadrant A Data is divided into 100 sec bins |
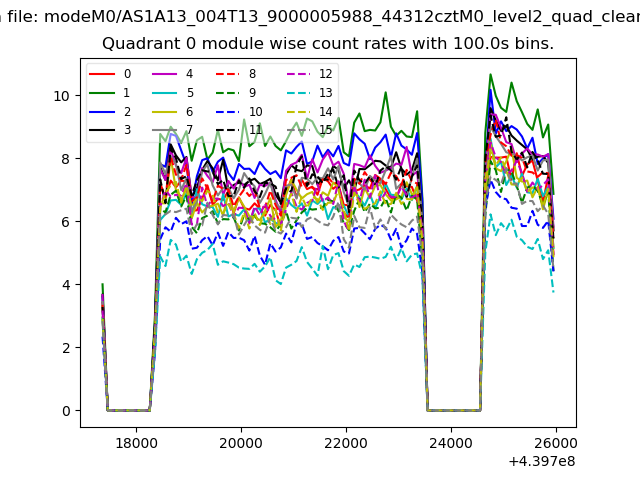 |
 |
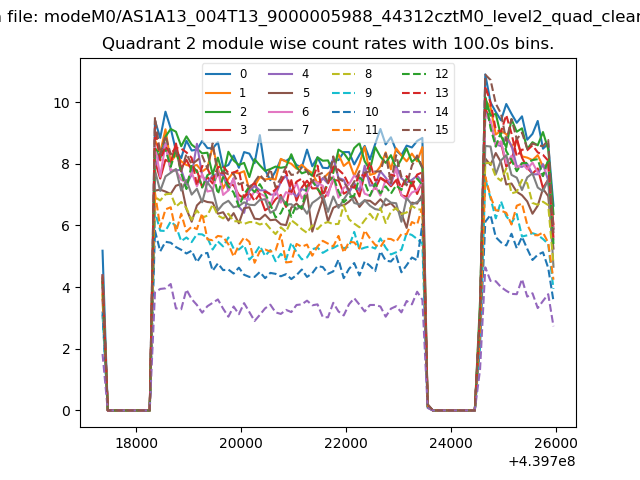
| Module-wise count rates for Quadrant B Data is divided into 100 sec bins |
 |
 |
| Module-wise count rates for Quadrant C Data is divided into 100 sec bins |
 |
 |
| Module-wise count rates for Quadrant D Data is divided into 100 sec bins |
 |
 |
| Parameter | Plot |
|---|---|
| CZT HV Monitor | 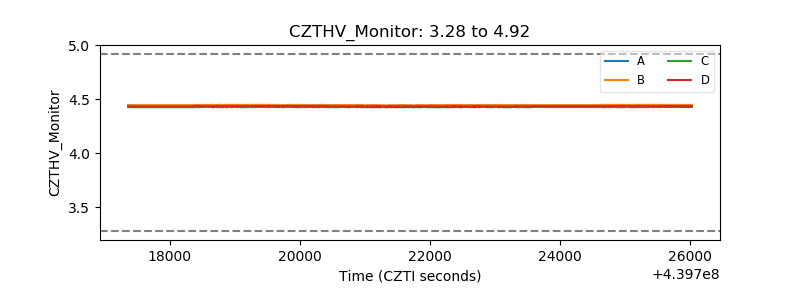 |
| D_VDD | 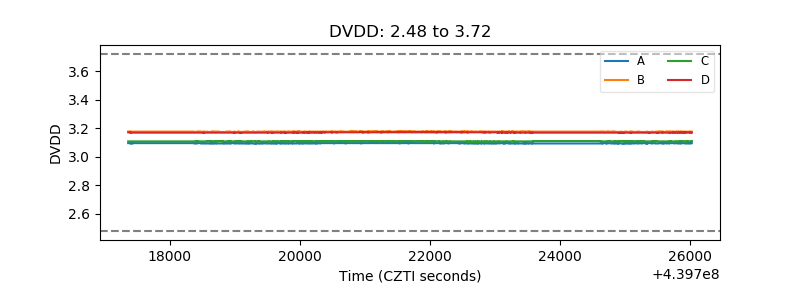 |
| Temperature 1 | 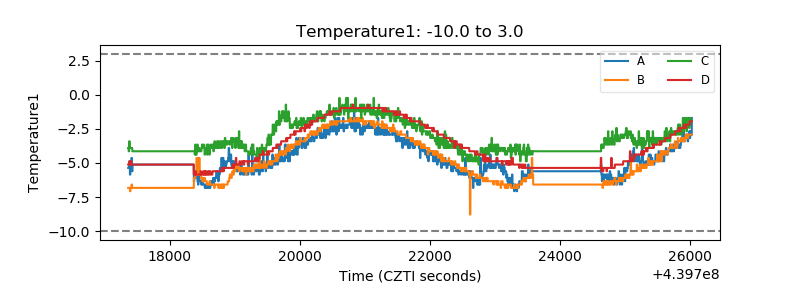 |
| Veto HV Monitor | 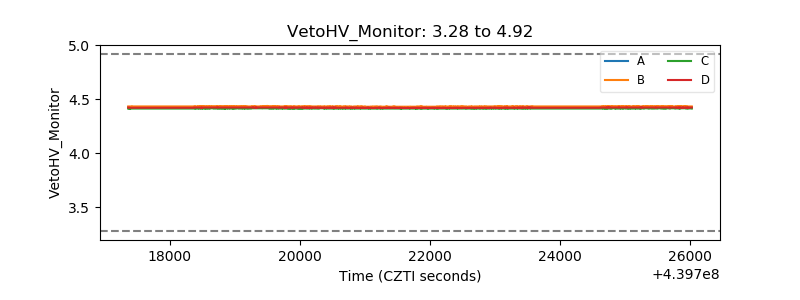 |
| Veto LLD | 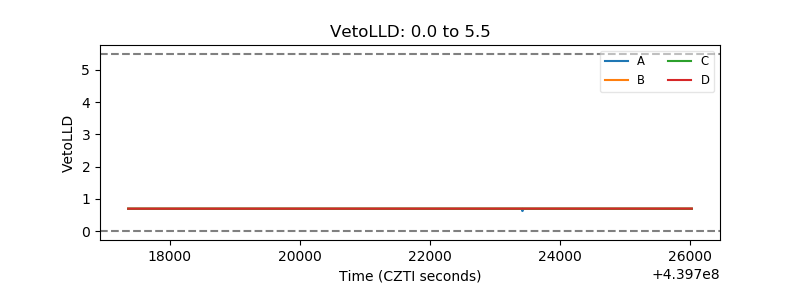 |
| Alpha Counter | 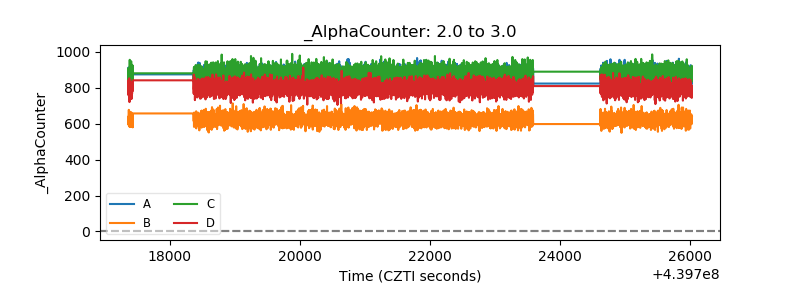 |
| _CPM_Rate | 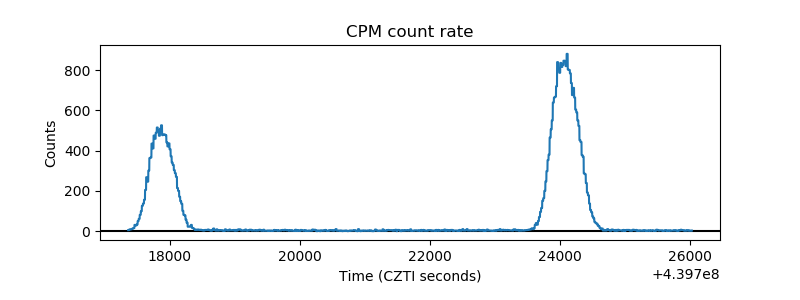 |
| CZT Counter | 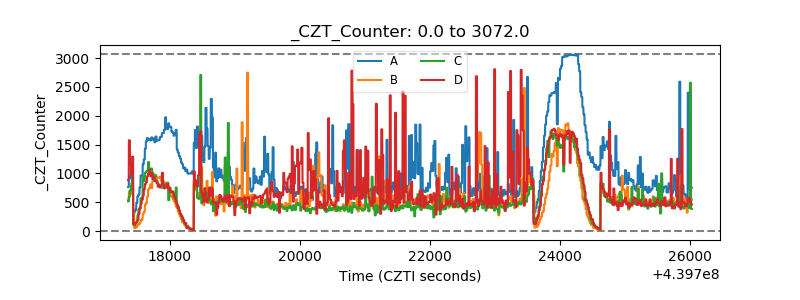 |
| +2.5 Volts monitor | 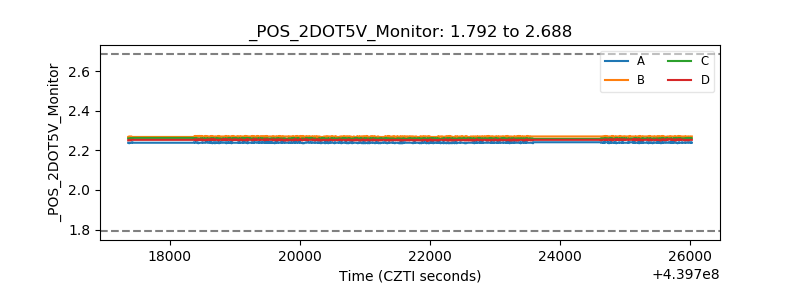 |
| +5 Volts monitor | 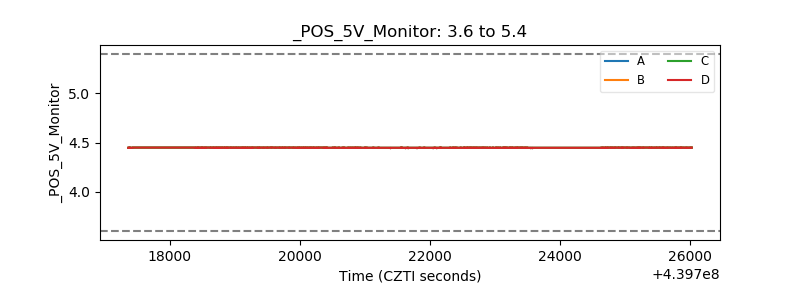 |
| _ROLL_ROT | 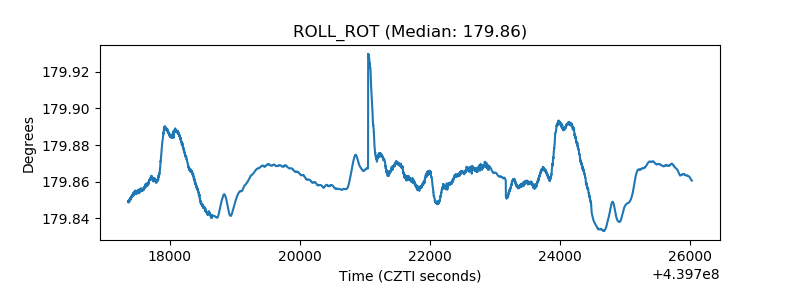 |
| _Roll_DEC | 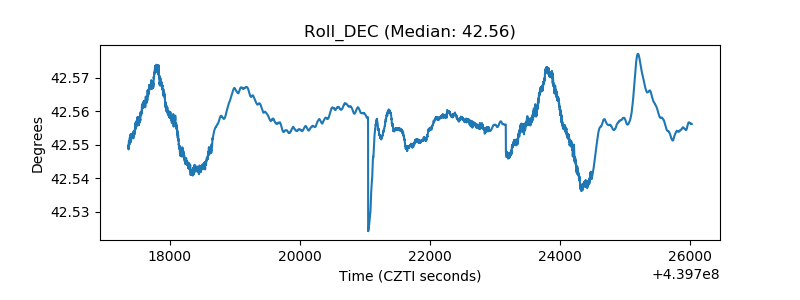 |
| _Roll_RA | 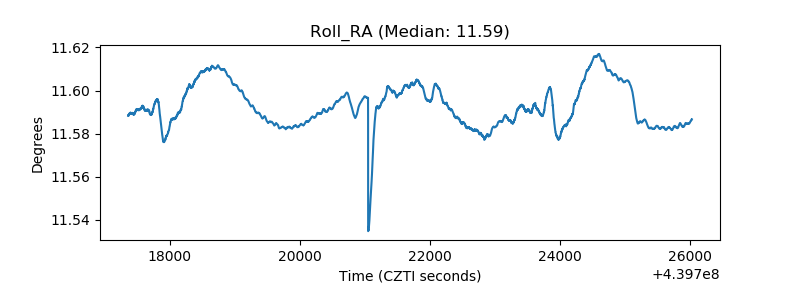 |
| Veto Counter | 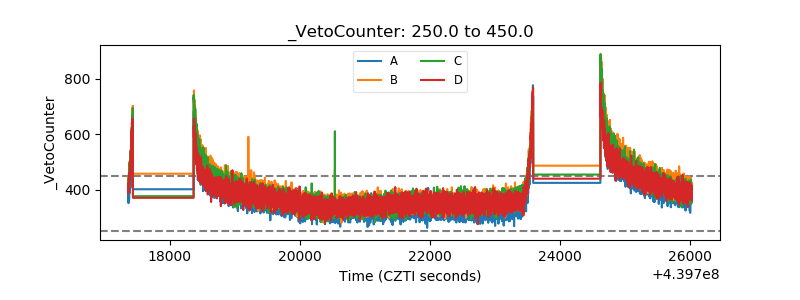 |